. 2023:2023:10.6084/m9.figshare.24846285.
doi: 10.6084/m9.figshare.24846285.

Assessment of Vecuronium Quality Using Near-Infrared Spectrometry

Affiliations

Assessment of Vecuronium Quality Using Near-Infrared Spectrometry

James T Isaacs et al. Contact Context. 2023.

Abstract

This study employed Fourier Transform near-infrared spectrometry to assess the quality of vecuronium bromide, a neuromuscular blocking agent. Spectral data from two lots of vecuronium were collected and analyzed using the BEST metric, principal component analysis (PCA) and other statistical techniques. The results showed that there was variability between the two lots and within each lot. Several outliers in the spectral data suggested potential differences in the chemical composition or sample condition of the vials. The outliers were identified and their spectral features were examined. A total of eight unique outliers were found in the PC space from PCs 1 to 9, so 22% of the total vials were outliers. The study findings suggest that the manufacturing process of vecuronium bromide may have been operating outside of a state of process control. Further investigation is needed to determine the source of these variations and their impact on the safety and efficacy of the drug product.


Figures
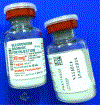
Figure 1.
Figure 1.
Photo of vials of the vecuronium bromide drug product. The lot numbers making up the spectral library were 41576CA and 41580CA.
Figure 2.
Figure 2.
Smoothed graphs of 36 spectra in the library formed by the two lots
Figure 3.
Figure 3.
PC plot of the spectra of 36 vials in the library. Vials 28, 29, and 33 appear to be possible outliers. Vial 15 might be an outlier as well.
Figure 4.
Figure 4.
Another rotation of the PC plot of the spectra of 36 vials in the library (compare to Figure 3). In this rotation vial 35 looks like the only possible outlier.
Figure 5.
Figure 5.
Another rotation of the PC plot of the spectra of 36 vials in the library (compare to Figure 3 and Figure 4). In this rotation, vials 28, 29, 33 and vials 31, 30, 34, and 35 all appear to be possible outliers. Vials 28 and 35 are orthogonal outliers, so the chemical changes occurring in them and other vials in the same direction (3, 15, 30, 31, and 34 for vial 35, and 6, 13, 29, 33) might be completely different.
Figure 6.
Figure 6.
Representative spectra of typical and unusual vials of vecuronium in the library. The typical vial is shown in the blue graph of vial 11. The potential outliers are vials 28 (red) and 35 (yellow). Compare these with Figure 3, Figure 4, and Figure 5.
Figure 7.
Figure 7.
A zoom in on the region from 5650 to 5950 cm−1 shown in Figure 6. The spectrum of vial 15 is added.
Figure 8.
Figure 8.
A zoom in on the region from 4200 to 4800 cm−1 shown in Figure 6. The same vials are depicted as those that appear in Figure 7 (vials 11, 15, 28, and 35)
Figure 9.
Figure 9.
A plot of the spectra in the library on PCs 4, 5, and 6. Vials 19 (4.1 SDs) and 26 (3.6 SDs) are outliers.Vial 8 is an outlier in another rotation (3.6 SDs).
Figure 10.
Figure 10.
A plot of the spectra in the library on PCs 7 , 8, and 9. Vials 27 (4.2 SDs) and 36 (3.5 SDs) are outliers in PCs 7 through 9. These principal components contain substantial noise, however.
Figure 11.
Figure 11.
A graph of the loadings of PC 1 of the spectral library. Important spectral features are marked at 4242, 4376, 5083, and 8359 cm−1.
Figure 12.
Figure 12.
A graph of the loadings of PC 2 of the spectral library.
Figure 13.
Figure 13.
A graph of the loadings of PC 3 of the spectral library.
Figure 14.
Figure 14.
A graph of the loadings of PC 3 of the spectral library.
Figure 15.
Figure 15.
A graph of the loadings of PC 4 of the spectral library.
Figure 16.
Figure 16.
A graph of the loadings of PC 6 of the spectral library.
Figure 17.
Figure 17.
A graph of the loadings of PC 7 of the spectral library.
Figure 18.
Figure 18.
A graph of the loadings of PC 8 of the spectral library.
Figure 19.
Figure 19.
A graph of the loadings of PC 9 of the spectral library.

References

    1. ASHP, 2023. Vecuronium Bromide Injection. https://www.ashp.org/drug-shortages/current-shortages/drug-shortage-deta..., retrieved Nov. 25, 2023
    1. Bayable SD, Ayenew NT, Misganaw A, Fetene MB, & Amberbir WD (2023). The Effects of Prophylactic Intravenous Lignocaine vs Vecuronium on Succinylcholine-Induced Fasciculation and Postoperative Myalgia in Patients Undergoing Elective Surgery at Debre Markos Comprehensive Specialized Hospital, Ethiopia, 2022: Prospective Cohort Study. International Journal of General Medicine, 2663–2670. - PMC - PubMed
    1. Crocker A, Gunn J, Li AR, & Tackeff M (2023) Tennessee Suspends Executions And Authorizes Independent Investigation Of Lethal Injection Protocol. Amicus Journal,, Issue 44, 22–28. https://www.bassberry.com/wp-content/uploads/lethal-injection-protocol-t...
    1. Dempsey RJ, Davis DG, Buice RG Jr, & Lodder RA (1996). Biological and medical applications of near-infrared spectrometry. Applied Spectroscopy, 50(2), 18A–34A.
    1. FDA Access Data, 2018. Vecuronium Bromide For Injection, https://www.accessdata.fda.gov/drugsatfda_docs/label/2018/075549s013lbl.pdf, retrieved Nov. 15, 2023

LinkOut - more resources