. 2023 Dec 21:17:1307777.
doi: 10.3389/fnins.2023.1307777. eCollection 2023.

Impact of SNR, peripheral auditory sensitivity, and central cognitive profile on the psychometric relation between pupillary response and speech performance in CI users

Affiliations

Impact of SNR, peripheral auditory sensitivity, and central cognitive profile on the psychometric relation between pupillary response and speech performance in CI users

Yue Zhang et al. Front Neurosci. .

Abstract

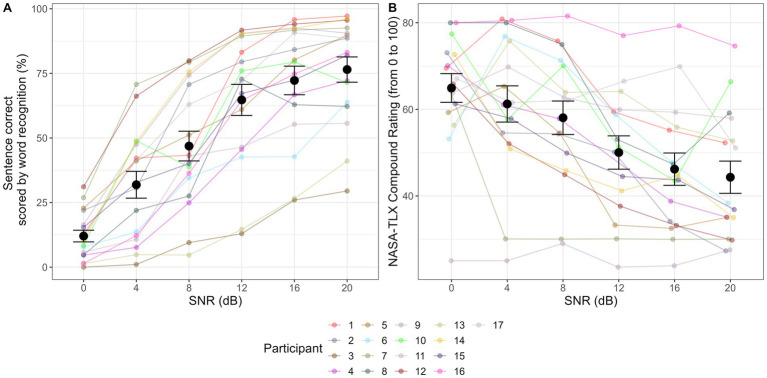
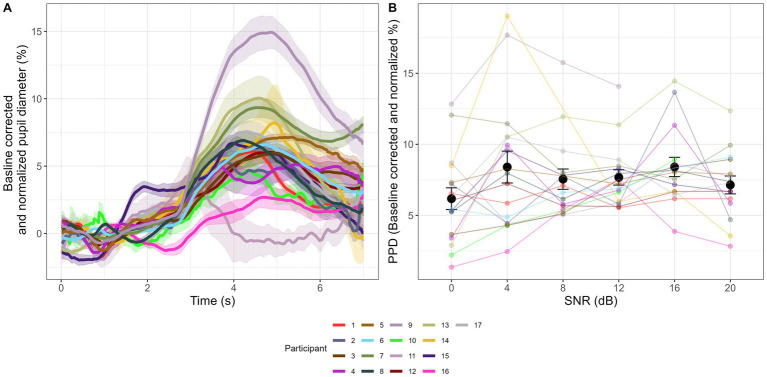
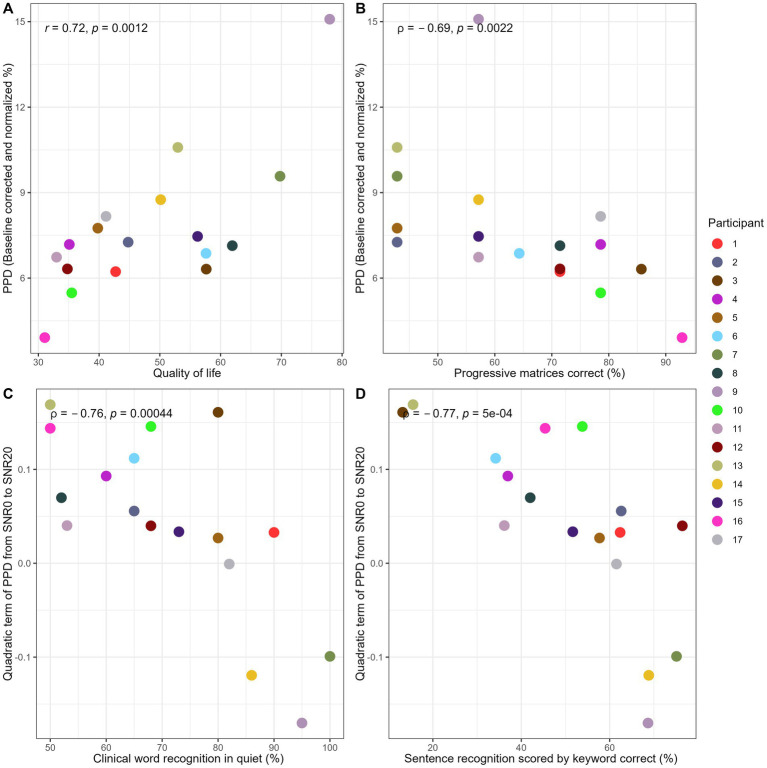
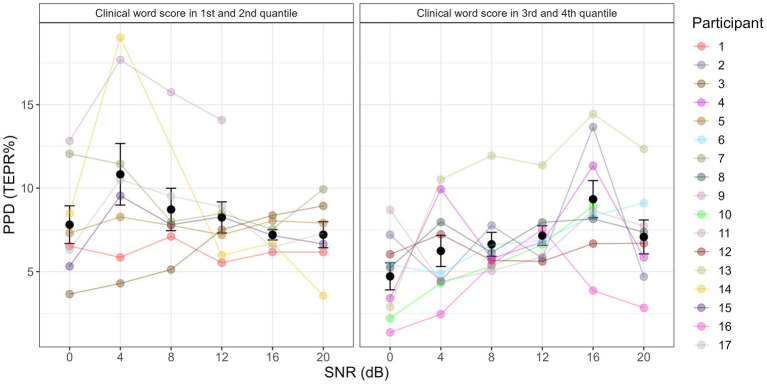
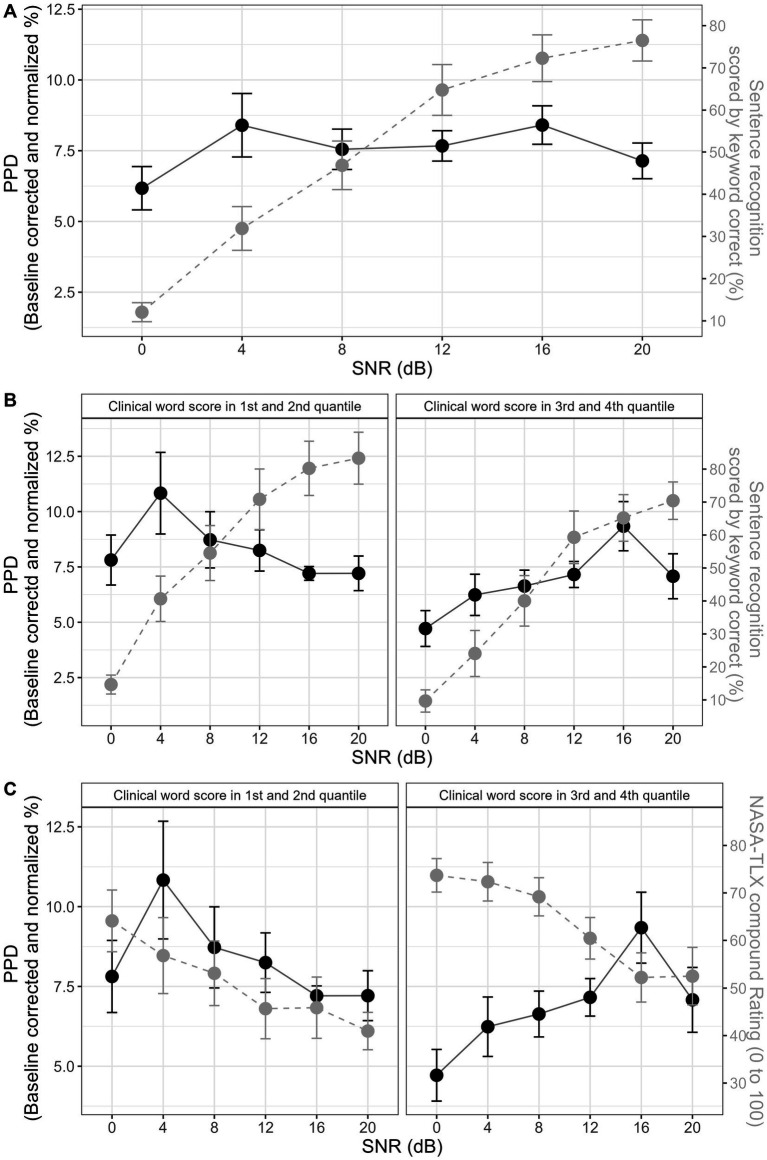
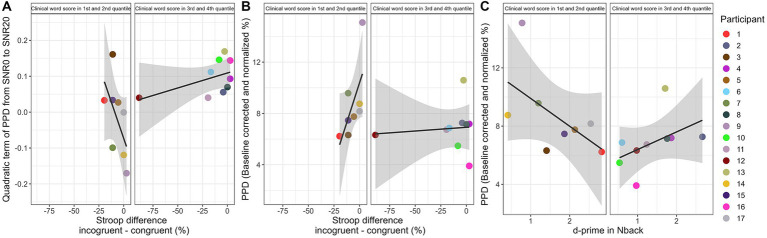
Despite substantial technical advances and wider clinical use, cochlear implant (CI) users continue to report high and elevated listening effort especially under challenging noisy conditions. Among all the objective measures to quantify listening effort, pupillometry is one of the most widely used and robust physiological measures. Previous studies with normally hearing (NH) and hearing-impaired (HI) listeners have shown that the relation between speech performance in noise and listening effort (as measured by peak pupil dilation) is not linear and exhibits an inverted-U shape. However, it is unclear whether the same psychometric relation exists in CI users, and whether individual differences in auditory sensitivity and central cognitive capacity affect this relation. Therefore, we recruited 17 post-lingually deaf CI adults to perform speech-in-noise tasks from 0 to 20 dB SNR with a 4 dB step size. Simultaneously, their pupillary responses and self-reported subjective effort were recorded. To characterize top-down and bottom-up individual variabilities, a spectro-temporal modulation task and a set of cognitive abilities were measured. Clinical word recognition in quiet and Quality of Life (QoL) were also collected. Results showed that at a group level, an inverted-U shape psychometric curve between task difficulty (SNR) and peak pupil dilation (PPD) was not observed. Individual shape of the psychometric curve was significantly associated with some individual factors: CI users with higher clinical word and speech-in-noise recognition showed a quadratic decrease of PPD over increasing SNRs; CI users with better non-verbal intelligence and lower QoL showed smaller average PPD. To summarize, individual differences in CI users had a significant impact on the psychometric relation between pupillary response and task difficulty, hence affecting the interpretation of pupillary response as listening effort (or engagement) at different task difficulty levels. Future research and clinical applications should further characterize the possible effects of individual factors (such as motivation or engagement) in modulating CI users' occurrence of 'tipping point' on their psychometric functions, and develop an individualized method for reliably quantifying listening effort using pupillometry.

Keywords: CI; cognitive abilities; listening effort; pupillometry; speech performance.


Conflict of interest statement

YZ and FP are employees of Oticon Medical, manufacturer of the cochlear implants used by the patients in this study and receive salaries as part of their employment. MC-L’s research is funded by a Torres Quevedo grant from the Spanish Ministry of Science and Innovation (PTQ 2019-010594/AEI/10.13039/501100011033) and co-funded by Oticon Medical. The remaining authors declare that the research was conducted in the absence of any commercial or financial relationships that could cause a potential conflict of interest.

Figures

Figure 1
Figure 1
Sentence keyword correct and NASA-TLX rating in sentence recognition in noise tasks. Panel (A) shows keyword correct at 0 dB, 4 dB, 8 dB, 12 dB, 16 dB, and 20 dB SNR conditions. Panel (B) shows NASA-TLX rating at 0 dB, 4 dB, 8 dB, 12 dB, 16 dB, and 20 dB SNR conditions. Each colored dot corresponds to the average performance of each participant. Black dot corresponds to the average performance across 17 participants, and the error bar corresponds to 1 standard error (SE) from the mean.
Figure 2
Figure 2
Pupillometry results in sentence recognition in noise tasks. Colored lines in Panel (A) indicate aggregated pupil traces of each participant and shaded areas show 1 standard error (SE) region from the mean. 0 s – 2 s is the baseline period where participant listened to masking noise at 65 dB SPL. At 2 s, target sentence embedded in the same level of noise kicks in. At the sentence offset, the masking noise continues for another 2 s to wait for the pupil peak dilation to emerge. All sample points are baseline corrected and normalized following the equation in data pre-processing section. Panel (B) shows PPD at 0 dB, 4 dB, 8 dB, 12 dB, 16 dB, and 20 dB SNR levels. Each colored dot corresponds to the average performance of each participant. Black dot corresponds to the average performance across 17 participants, and the error bar corresponds to 1 SE from the mean.
Figure 3
Figure 3
Plots of significant correlation between psychometric shape parameters and individual variabilities. Colored dots correspond to each participant. Panel (A) shows the scatterplot between QoL and PPD. Panel (B) shows the scatterplot between progressive matrices score and PPD. Panel (C) shows the relation between clinical word recognition in quiet and the quadratic term of PPD from SNR0 to SNR20. Panel (D) shows the scatterplot between sentence recognition in noise and the quadratic term of PPD from SNR0 to SNR20. Statistical results are presented on the top left of each panel.
Figure 4
Figure 4
PPD results at different SNR levels, with participants split into two groups. Left panel shows results for participants whose clinical word scores are in the 1st and 2nd quantile, and 4 dB SNR condition was significantly higher than 0 dB, 16 dB, and 20 dB SNR. The right panel shows results for participants whose clinical word scores are in the 3rd and 4th quantile, and 16 dB SNR condition was significantly higher than 0 dB, 4 dB, 8 dB, 12 dB, and 20 dB SNR.
Figure 5
Figure 5
Double psychometric function figures for PPD, sentence recognition in noise and NASA-TLX. In all panels, dot corresponds to the average performance, and the error bar corresponds to 1 standard error (SE) from the mean. Panel (A) combines dots and error bars in black solid line to indicate PPD psychometric function, and gray dashed line to indicate sentence recognition psychometric function. Panel (B) splits participants into two group, with the left side containing participants whose clinical word recognition falls in the 1st and 2nd quantile and the right-side 3rd and 4th quantile. Gray dashed lines in panel (C) connect dots and error bars to indicate NASA-TLX psychometric functions.
Figure 6
Figure 6
The relationship between individual Stroop difference score and the quadratic term of PPD from SNR0 to SNR20 Panel (A), and the PPD Panel (B) are shown for the two groups. Panel (C) shows the relationship between d-prime score and the PPD..

Similar articles

Cited by

References

    1. Akeroyd M. A. (2008). Are individual differences in speech reception related to individual differences in cognitive ability? A survey of twenty experimental studies with normal and hearing-impaired adults. Scand. Audiol. 47, S53–S71. doi: 10.1080/14992020802301142, PMID: - DOI - PubMed
    1. Alhanbali S., Millman R. E., Munro K. J., Munro K. J. (2019). Measures of listening effort are multidimensional. Ear Hear. 40, 1084–1097. doi: 10.1097/AUD.0000000000000697, PMID: - DOI - PMC - PubMed
    1. Alhanbali S., Munro K. J., Dawes P., Carolan P. J., Millman R. E. (2021). Dimensions of self-reported listening effort and fatigue on a digits-in-noise task, and association with baseline pupil size and performance accuracy 60, 762–772. doi: 10.1080/14992027.2020.1853262, PMID: - DOI - PubMed
    1. Amini A. E., et al. . (2023). Emerging relations among cognitive constructs and Cochlear implant outcomes: a systematic review and Meta-analysis. Otolaryngology. doi: 10.1002/OHN.344 - DOI - PubMed
    1. Aronoff J. M., Landsberger D. M. (2013). The development of a modified spectral ripple test. J. Acoust. Soc. Am. 134, EL217–EL222. doi: 10.1121/1.4813802, PMID: - DOI - PMC - PubMed