. 2024 Jan 2:12:e15638.
doi: 10.7717/peerj.15638. eCollection 2024.

Chemical and spectroscopic characterization of (Artemisinin/Querctin/ Zinc) novel mixed ligand complex with assessment of its potent high antiviral activity against SARS-CoV-2 and antioxidant capacity against toxicity induced by acrylamide in male rats

Affiliations

Chemical and spectroscopic characterization of (Artemisinin/Querctin/ Zinc) novel mixed ligand complex with assessment of its potent high antiviral activity against SARS-CoV-2 and antioxidant capacity against toxicity induced by acrylamide in male rats

Samy M El-Megharbel et al. PeerJ. .

Abstract

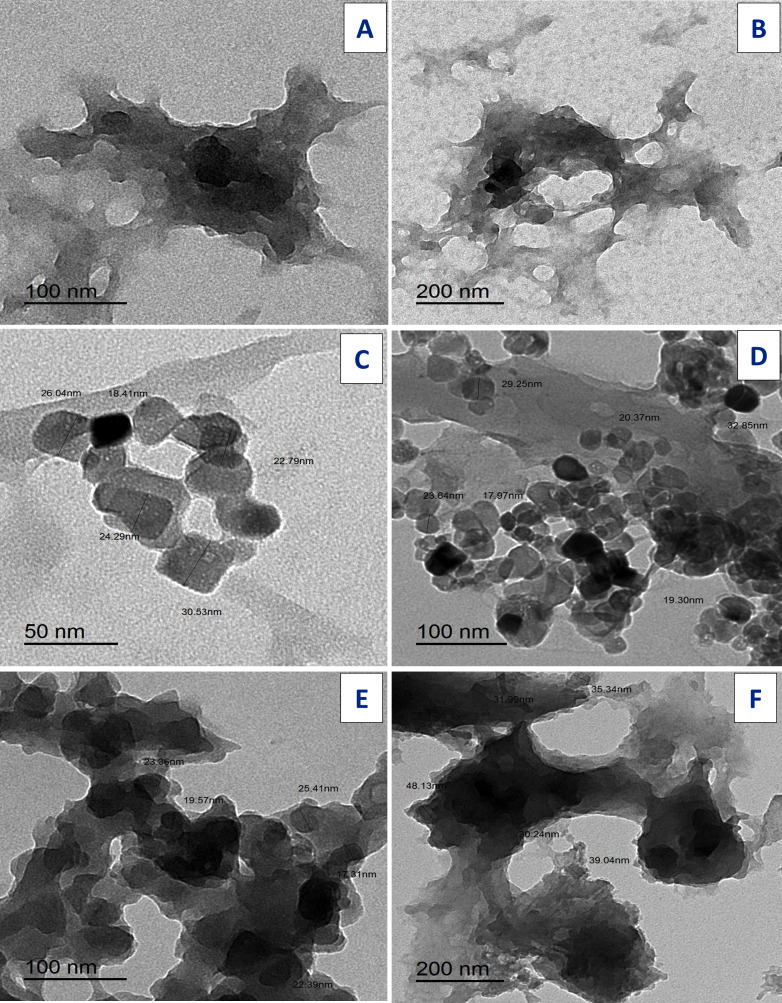
A novel Artemisinin/Quercetin/Zinc (Art/Q/Zn) mixed ligand complex was synthesized, tested for its antiviral activity against coronavirus (SARS-CoV-2), and investigated for its effect against toxicity and oxidative stress induced by acrylamide (Acy), which develops upon cooking starchy foods at high temperatures. The synthesized complex was chemically characterized by performing elemental analysis, conductance measurements, FT-IR, UV, magnetic measurements, and XRD. The morphological surface of the complex Art/Q/Zn was investigated using scanning and transmission electron microscopy (SEM and TEM) and energy dispersive X-ray analysis (XRD). The in vitro antiviral activity of the complex Art/Q/Zn against SARS-CoV-2 and its in vivo activity against Acy-induced toxicity in hepatic and pulmonary tissues were analyzed. An experimental model was used to evaluate the beneficial effects of the novel Art/Q/Zn novel complex on lung and liver toxicities of Acy. Forty male rats were randomly divided into four groups: control, Acy (500 mg/Kg), Art/Q/Zn (30 mg/kg), and a combination of Acy and Art/Q/Zn. The complex was orally administered for 30 days. Hepatic function and inflammation marker (CRP), tumor necrosis factor, interleukin-6 (IL-6), antioxidant enzyme (CAT, SOD, and GPx), marker of oxidative stress (MDA), and blood pressure levels were investigated. Histological and ultrastructure alterations and caspase-3 variations (immunological marker) were also investigated. FT-IR spectra revealed that Zn (II) is able to chelate through C=O and C-OH (Ring II) which are the carbonyl oxygen atoms of the quercetin ligand and carbonyl oxygen atom C=O of the Art ligand, forming Art/Q/Zn complex with the chemical formula [Zn(Q)(Art)(Cl)(H2O)2]⋅3H2O. The novel complex exhibited a potent anti-SARS-CoV-2 activity even at a low concentration (IC50 = 10.14 µg/ml) and was not cytotoxic to the cellular host (CC50 = 208.5 µg/ml). Art/Q/Zn may inhibit the viral replication and binding to the angiotensin-converting enzyme-2 (ACE2) receptor and the main protease inhibitor (MPro), thereby inhibiting the activity of SARS-CoV-2 and this proved by the molecular dynamics simulation. It alleviated Acy hepatic and pulmonary toxicity by improving all biochemical markers. Therefore, it can be concluded that the novel formula Art/Q/Zn complex is an effective antioxidant agent against the oxidative stress series, and it has high inhibitory effect against SARS-CoV-2.

Keywords: Artemisinin; Novel complex; Pandemic; SARS-CoV-2; Transmission electron microscope.


Conflict of interest statement

The authors declare there are no competing interests.

Figures

Figure 1
Figure 1. SARS-CoVs recognizes angiotensin-converting enzyme-2 (ACE2).
Figure 2
Figure 2. Chemical structure of (A) quercetin and (B) artemisinin.
Figure 3
Figure 3. Art/Q/Zn novel mixed ligand complex.
Figure 4
Figure 4. Timeline for the in vivo experimental design.
Experimental timeline for (Acy) and novel complex (Art/Q/Zn) treatment.
Figure 5
Figure 5. Schematic representation of the experimental design.
Figure 6
Figure 6. Structure of Art/Q/Zn novel complex.
Figure 7
Figure 7. FT-IR of (A) Art , (B) Q and (C) Art/Q/Zn.
Figure 8
Figure 8. UV-Vis spectra of Art and Art/Q/Zn.
Figure 9
Figure 9. 1H-NMR of Art/Q/Zn.
Figure 10
Figure 10. XRD of Art/Q/Zn mixed ligand.
Figure 11
Figure 11. SEM of Art (A,B) , Q (C, D), and Art/Q/Zn (E,F).
Figure 12
Figure 12. EDX of Art/Q/Zn mixed ligand complex.
Figure 13
Figure 13. TEM of Art (A, B) , Q (C, D), and Art/Q/Zn (E, F).
Figure 14
Figure 14. Values for the cytotoxicity concentration 50 (CC50) and inhibitory concentration 50 (IC50) (Art/Q/Zn) metal complex.
The figure shows the formula revealing its potent and promising activity against the SARS-CoV-2. The value of IC50 was calculated by the best line drawn between log concentration and viral inhibition % (triplicate/each concentration) to estimate the potent antiviral activity against the SARS-CoV-2 (hCoV-19/Egypt/NRC-03/2020; accession number SAMN14814607) using the Vero E6 cells. (Approved official report from center of scientific excellence for influenza viruses, National research center , Cairo , Dokki, Egypt). Cytotoxicity concentration 50 (CC50): on Vero E6 cells Inhibitory concentration 50 (IC50): Antiviral activity against Severe *Acute Respiratory Syndrome Coronavirus 2 (SARS-CoV-2) (hCoV-19/Egypt/NRC-03/2020).
Figure 15
Figure 15. Photomicrograph of cross sections of experimental rat liver.
A cross section of experimental rat liver showing: (A) control group showing normal hepatic structure with normal hepatocytes (orange arrow) and normal central vein (CV) (20 µm). (B) Acy treated group showing hepatotoxicity by hypertrophy of hepatocytes and increased eosinophilia, granular cytoplasm, vesicular nuclei and ballooning degeneration (blue arrow), dilatation of the portal vein with appearance of perivenular, periportal fibrosis (blue arrow), ductular reaction (green arrow) with accumulation of mononuclear inflammatory cells in the portal tract (interface hepatitis), focal necrosis in some hepatocytes with increased eosinophilia and nuclear disappearance (20 µm). (C) A cross section of liver tissues after Acy administration showing severe toxicity with hypertrophy of the hepatocytes and elevated eosinophilia, granular cytoplasm with vesicular nuclei (red arrow), with hemorrhage in the central vein (blue arrow) and necrotic tissues (green arrow) and nuclear disappearance, accumulation of few mononuclear inflammatory cells in blood sinusoids (20 µm). (D) A cross section of liver tissues after (Art/Q/Zn) administration showing normal hepatic structure with normal central vein (CV) and normal hepatocytes (orange arrow) (20 µm). (E) A cross section of liver tissues after administration of Acy followed by the novel complex (Art/Q/Zn) with showing high restoration of the hepatic tissues in the form of very mild fatty change, with some inflammatory cells resulting from the recovery process (blue arrow) with normal central vein (black star) (20 µm).
Figure 16
Figure 16. An electron micrograph of the liver tissues of different treated groups.
An electron micrograph of the hepatic tissues of the control group: (A) which showed a normal hepatic structure with normal appearance of normal nucleus (**), normal mitochondria (M) and endoplasmic reticulum (ER) (scale bar = 5 µm). (B) Acy treated group showed large red blood cells (orange arrow) with large fat droplets appeared as large white droplets with appearance of pyknotic nuclei with very small size (**) (scale bar = 5 µm). (C) Acy treated group showed high fatty change (white arrow) with some destructed mitochondria (green arrow), hemorrhage with appearance of red blood cells (red arrow) and med sized nucleus (**) in addition to dysregulation of nuclear membrane (scale bar = 5 µm). (D) Art/Q/Zn treated group showing normal hepatic structures with enlarged nucleus with normal nuclear boundaries (**) and normal sized mitochondria (M) (scale bar = 5 µm). (E) Acy plus novel mixed ligand complex (Art/Q/Zn) showed restoration of most of the hepatic structure with normal sized nucleus (**) with normal sized mitochondria (M) and reducing of fatty change (scale bar = 5 µm).
Figure 17
Figure 17. Immunostaining reactivity of the hepatic tissues.
(A) Control group: photomicrograph of a cross-section of the liver tissues showing negative caspase-3 immunostaining (-) negative immunostaining (320 µm). (B) Photomicrograph of a cross-section of the liver tissues given Acy showed highly marked hepatocyte immunostaining of caspase-3 indicating highly apoptosis and hepatotoxicity with inflammatory cells (++++) very immunostaining (320 µm). (C) Photomicrograph of a cross-section of the hepatic tissues after administration of novel complex of mixed ligand (Art/Q/Zn) showing negative cytoplasmic hepatocyte immunostaining of caspase-3 and induction of severe apoptosis and more inflammatory cells (-) negative immunostaining (320 µm). (D) Hepatic tissues of group treated with Acy and novel complex (Art/Q/Zn) showed very mild caspase-3 immunostaining and absence of inflammatory cells (+) weak immunostaining (320 µm) (DAB chromogen, Meyer‘s hematoxylin counterstain).
Figure 18
Figure 18. Photomicrograph of cross sections of experimental rat lung.
(A) Control group showing the normal perivascular cells of the lung tissues (20 µm). (B) Acy treated group showing pulmonary toxicity showing congested blood vessels (green arrow) with scattered aggregates of inflammatory cells (80 µm). (C) Sections of rat lung treated with Acy administration that show severe toxicity in the form of granular debris of fibrin and congested blood vessels and areas of hemorrhage with non-specific inflammatory cells (80 µm). (D) A cross section of rat lung after novel complex (Art/Q/Zn) administration that show normal pulmonary sacs with regular boundaries and normal perivascular cells of the lung tissues (20 µm). (E) A cross section of rat lung after administration of Acy followed by the novel complex (Art/Q/Zn) that showing restoration of the lung tissues with very mild congestion of the alveolar lung tissues (80 µm).
Figure 19
Figure 19. TEM examination of the pulmonary tissues.
(A) showed normal pulmonary structures with normal appearance of the nucleus (N), basement lamina (LB) and alveolar sacculus (AS) and normal Bronchioles (**) (scale bar = 2 µm). (B) Acy treated group showed large red blood cells (EC) that block completely the air sacs (red arrow) with appearance of small granules (g) with detaching of most pulmonary tissues with pulmonary fibrosis (green arrow) (scale bar = 10 µm). (C) Art/Q/Zn group showing normal pulmonary structures with normal nucleus (N) beside normal nuclear boundaries and normal Bronchioles (**), normal Alveolar epithelial cells (AC), alveolar sacculus (AS) and normal basal lamina (LB) (scale bar = 5 µm). (D) Acy plus novel mixed ligand complex (Art/Q/Zn) showed restoration of most of the pulmonary structure with normal sized nucleus (N), normal alveolar epithelial cells (AC), alveolar sacculus (AS) and opening of air sacs (**) with mild appearance of granules residues (light orange arrow) and red blood cells (green arrow) (scale bar = 5 µm).
Figure 20
Figure 20. Immunostaining reactivity of the pulmonary tissues.
(A) Section of the pulmonary tissues of control group showing (-ve) caspase-3 immunostaining (320 µm). (B) Cross-section of the pulmonary tissues given Acy showed significant immunostaining of caspase-3 indicating highly apoptosis (++++) very immunostaining (320 µm). (C) Cross-section of the pulmonary tissues after administration of novel complex of mixed ligand (Art/Q/Zn) showing negative cytoplasmic hepatocyte immunostaining of caspase-3 and induction of severe apoptosis and more inflammatory cells (-) negative immunostaining (320 µm). (D) Section of the pulmonary tissues treated with Acy and novel complex (Art/Q/Zn) showed very mild immunostaining for caspase-3 and absence of inflammatory cells (+) weak immunostaining (320 µm) (DAB chromogen, Meyer’s hematoxylin counterstain).
Figure 21
Figure 21. Live sections of both liver and lung tissues of either Acy and Art/Q/Zn treated groups.
(A) Lung tissues of Acy group. (B) Lung tissues of ART/Q/Zn group. (C, D, and E) Hepatic tissues of Acy treated group. (F, G, and H) Hepatic tissues of ART/Q/Zn treated group.
Figure 22
Figure 22. Images for digital measurement blood pressure system (NIBP250), BIOPAC systems, inc.
Systolic and diastolic blood pressure in Acy and /or Art/Q/Zn treated group. (A) Systolic, diastolic and heart rate measurements of control group. (B) Systolic,Diastolic and heart rate measurements of Acy group. (C) Systolic, diastolic and heart rate measurements of Art/Q/Zn group. (D) Systolic, diastolic and heart rate measurements of Acy +Art/Q/Zn group. (E) Digital blood pressure measurement system (NIBP250), BIOPAC systems, Inc., and values were measured in rats via streamer.
Figure 23
Figure 23. 3D binding interaction of novel complex formula (Art/Q/Zn) with ACE2 and MPro receptors.
(A–F) 3D binding interaction of (Art/Q/Zn). (G–H) Simulation of the novel complex of (Art/Q/Zn) with ACE2 receptor. (G) 3D Simulation of Art/Q/Zn with ACE2 (H) Lipophilicity of Art/Q/Zn with ACE2 (I–J) Simulation of novel complex of (Art/Q/Zn) with MPro receptor. (I) 3D Simulation of Art/Q/Zn with MPro (J) Lipophilicity of Art/Q/Zn with MPro.
Figure 24
Figure 24. Ligand properties, heat maps for SARS-CoV-2, L-torsion and RMSD of the tested mixed ligand (Art/Q/Zn) towards SARS-CoV-2 receptors during (100 ns), RMSD of ACE2, MPro and RMSD of Cα atoms of the complex ligand.
Molecular dynamics simulation to predict the ligand binding status of the SARS-CoV-2 ligand-protein for novel complex Art/Q/Zn with 1ryreceptor ACE2 and MPro (Main protease of SARS-CoV-2) (Simulation time 100 ns). (A, B) Histograms of molecular dynamics simulation. (C, D) Heat maps of molecular dynamics simulation. (E, F) Ligand properties of molecular dynamics simulation. (G, H) root mean square deviation (RMSD) analysis of molecular dynamics simulation. (I, J) Fluctuation and torsion of molecular dynamics simulation.
Figure 25
Figure 25. Proposed mechanism of antiviral activity of Art/Q/Zn.

Similar articles

References

    1. Abo Elmaaty A, Eldehna WM, Khattab M, Kutkat O, Alnajjar R, El-Taweel AN, Al-Rashood ST, Abourehab MAS, Binjubair FA, Saleh MA. Anticoagulants as potential SARS-CoV-2 Mpro inhibitors for COVID-19 patients: in vitro, molecular docking, molecular dynamics, DFT, and SAR studies. International Journal of Molecular Sciences. 2022;23(20):12235. doi: 10.3390/ijms232012235. - DOI - PMC - PubMed
    1. Abubakar MG, Ukwuani AN, Mande UU. Antihypertensive activity of Hibiscus Sabdariffa aqueous calyx extract in Albino rats. Sky Journal of Biochemistry Research. 2015;4(3):16–20.
    1. Aebi Catalase in vitro. Methods in Enzymology. 1984;105:121–126. - PubMed
    1. Al-Salmi FA, El-Megharbel SM, Hamza RZ. Synthesis and spectroscopic study of novel mixed ligand formula Artemisinin/Zn and assessment of its inhibitory effect against SARS-CoV-2. Heliyon. 2023;9:e17177. - PMC - PubMed
    1. Al-Shemary RK, Ranjan KM, Manjeet K, Ashish K, Mohammad A, Hardeep ST, Azaj A, Pranab K, Mohapatra G, Kuldeep D. Synthesis, structural investigations, XRD, DFT, anticancer and molecular docking study of a series of thiazole-based Schiff base metal complexes. Journal of Molecular Structure. 2023;1275:134676. doi: 10.1016/j.molstruc.2022.134676. - DOI