Genome-Wide Network Analysis of Above- and Below-Ground Co-growth in Populus euphratica
- PMID: 38188223
- PMCID: PMC10769449
- DOI: 10.34133/plantphenomics.0131
Genome-Wide Network Analysis of Above- and Below-Ground Co-growth in Populus euphratica
Abstract
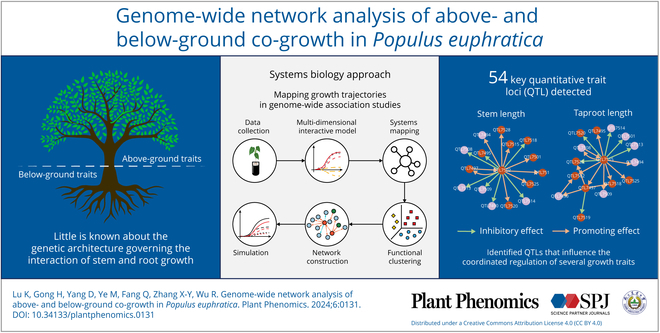
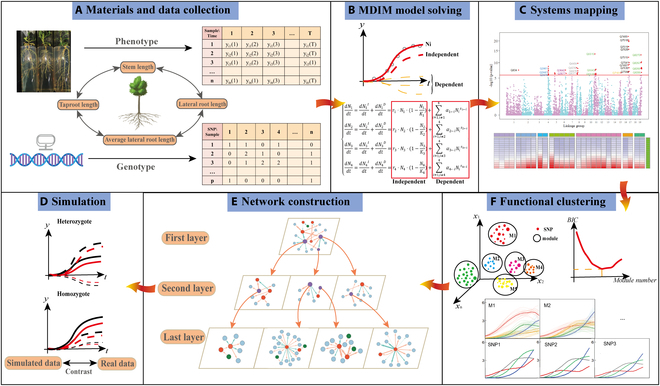
Tree growth is the consequence of developmental interactions between above- and below-ground compartments. However, a comprehensive view of the genetic architecture of growth as a cohesive whole is poorly understood. We propose a systems biology approach for mapping growth trajectories in genome-wide association studies viewing growth as a complex (phenotypic) system in which above- and below-ground components (or traits) interact with each other to mediate systems behavior. We further assume that trait-trait interactions are controlled by a genetic system composed of many different interactive genes and integrate the Lotka-Volterra predator-prey model to dissect phenotypic and genetic systems into pleiotropic and epistatic interaction components by which the detailed genetic mechanism of above- and below-ground co-growth can be charted. We apply the approach to analyze linkage mapping data of Populus euphratica, which is the only tree species that can grow in the desert, and characterize several loci that govern how above- and below-ground growth is cooperated or competed over development. We reconstruct multilayer and multiplex genetic interactome networks for the developmental trajectories of each trait and their developmental covariation. Many significant loci and epistatic effects detected can be annotated to candidate genes for growth and developmental processes. The results from our model may potentially be useful for marker-assisted selection and genetic editing in applied tree breeding programs. The model provides a general tool to characterize a complete picture of pleiotropic and epistatic genetic architecture in growth traits in forest trees and any other organisms.
Copyright © 2024 Kaiyan Lu et al.
Conflict of interest statement
Competing interests: The authors declare that there is no conflict of interest regarding the publication of this article.
Figures
Similar articles
-
Genetic architecture of growth traits in Populus revealed by integrated quantitative trait locus (QTL) analysis and association studies.New Phytol. 2016 Feb;209(3):1067-82. doi: 10.1111/nph.13695. Epub 2015 Oct 26. New Phytol. 2016. PMID: 26499329
-
The genetic architecture of shoot-root covariation during seedling emergence of a desert tree, Populus euphratica.Plant J. 2017 Jun;90(5):918-928. doi: 10.1111/tpj.13518. Epub 2017 Apr 9. Plant J. 2017. PMID: 28244225
-
Genome-wide association studies of callus differentiation for the desert tree, Populus euphratica.Tree Physiol. 2020 Dec 5;40(12):1762-1777. doi: 10.1093/treephys/tpaa098. Tree Physiol. 2020. PMID: 32761189
-
Genetic dissection of growth trajectories in forest trees: From FunMap to FunGraph.For Res (Fayettev). 2021 Nov 3;1:19. doi: 10.48130/FR-2021-0019. eCollection 2021. For Res (Fayettev). 2021. PMID: 39524511 Free PMC article. Review.
-
A pleiotropic-epistatic entangelement model of drug response.Drug Discov Today. 2023 Nov;28(11):103790. doi: 10.1016/j.drudis.2023.103790. Epub 2023 Sep 26. Drug Discov Today. 2023. PMID: 37758020 Review.
Cited by
-
Exploiting light energy utilization strategies in Populus simonii through multitrait-GWAS: insights from stochastic differential models.Theor Appl Genet. 2024 Nov 21;137(12):275. doi: 10.1007/s00122-024-04775-x. Theor Appl Genet. 2024. PMID: 39570411
-
Genome-Wide Identification and Expression Profiling of Velvet Complex Transcription Factors in Populus alba × Populus glandulosa.Int J Mol Sci. 2024 Mar 31;25(7):3926. doi: 10.3390/ijms25073926. Int J Mol Sci. 2024. PMID: 38612736 Free PMC article.
References
-
- Niklas KJ, Spatz HC. Allometric theory and the mechanical stability of large trees: Proof and conjecture. Am J Bot. 2006;93(6):824–828. - PubMed
-
- Kiaer LP, Weisbach AN, Weiner J. Root and shoot competition: A meta-analysis. J Ecol. 2013;101(5):1298–1312.
-
- Ruan Y. Sucrose metabolism: Gateway to diverse carbon use and sugar signaling. Annu Rev Plant Biol. 2014;65:33–67. - PubMed
-
- Modrzyński J, Chmura DJ, Tjoelker MG. Seedling growth and biomass allocation in relation to leaf habit and shade tolerance among 10 temperate tree species. Tree Physiol. 2015;35(8):879–893. - PubMed
-
- Shabala S, White RG, Djordjevic MA, Ruan YL, Mathesius U. Root-to-shoot signalling: Integration of diverse molecules, pathways and functions. Funct Plant Biol. 2016;43(2):87–104. - PubMed
LinkOut - more resources
Full Text Sources