. 2023 Dec 2;27(1):108627.
doi: 10.1016/j.isci.2023.108627. eCollection 2024 Jan 19.

Diverse bacteria elicit distinct neutrophil responses in a physiologically relevant model of infection

Affiliations

Diverse bacteria elicit distinct neutrophil responses in a physiologically relevant model of infection

Isaac M Richardson et al. iScience. .

Abstract

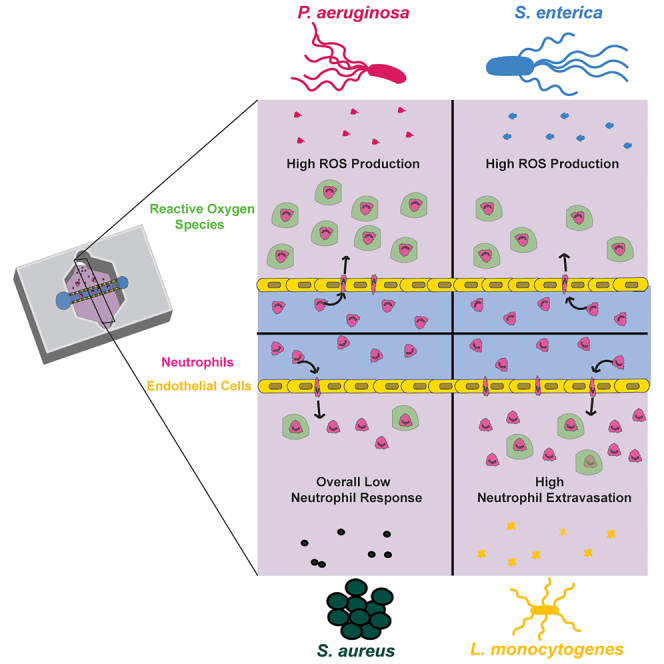
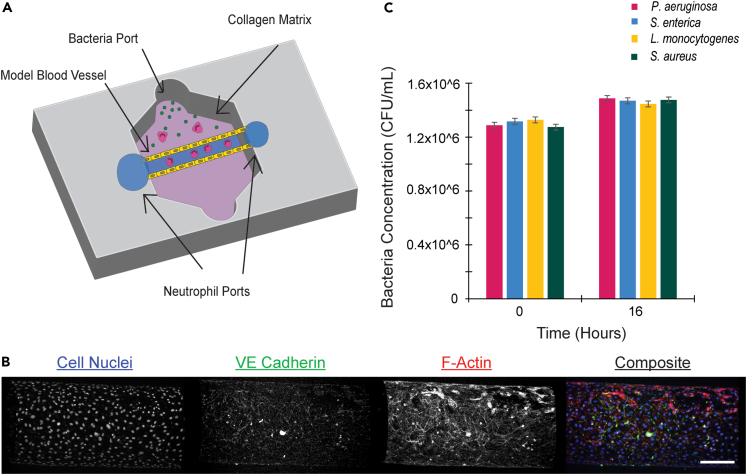
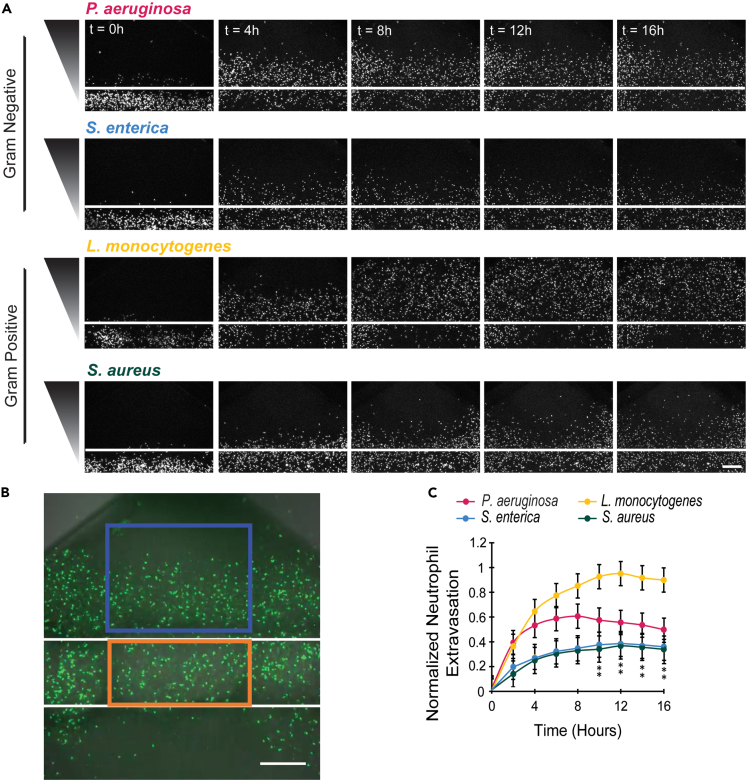
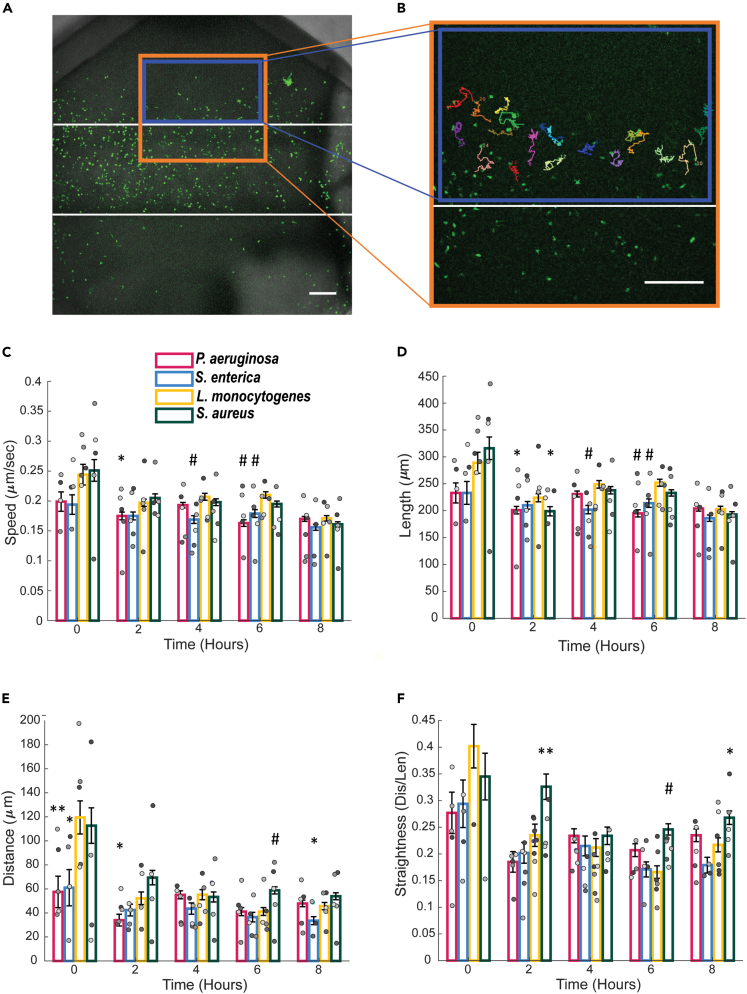
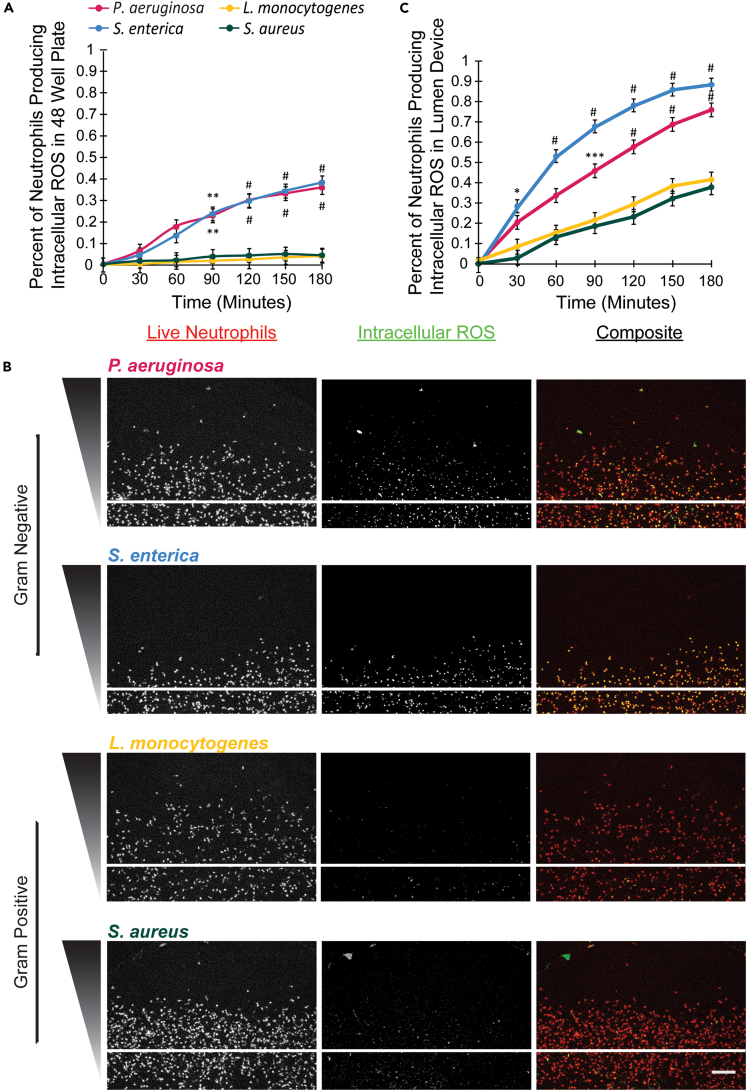
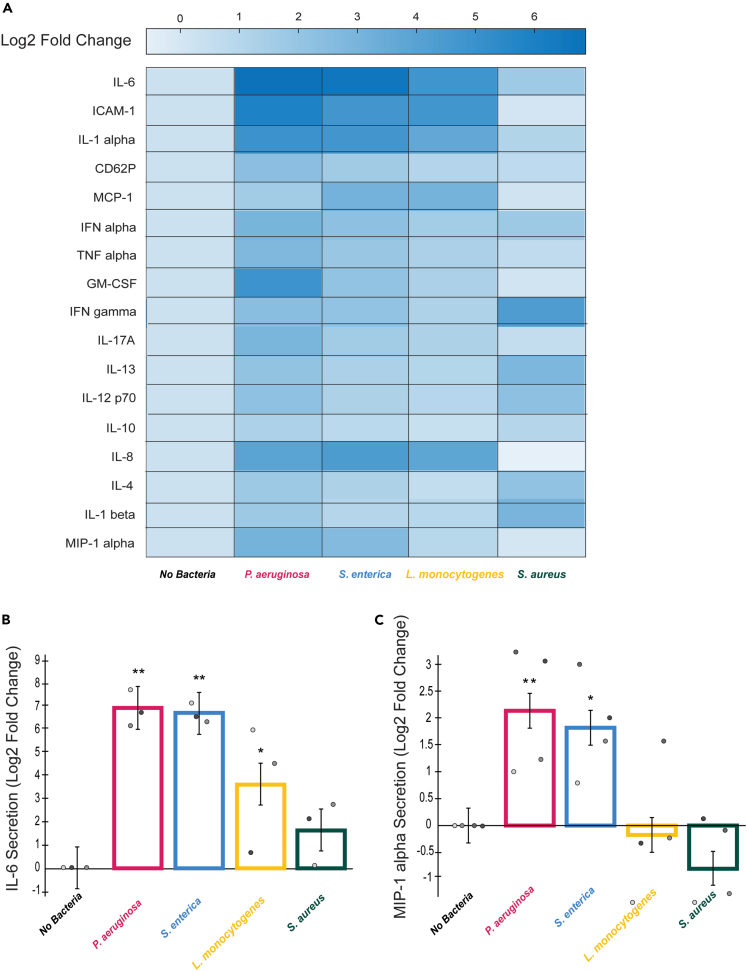
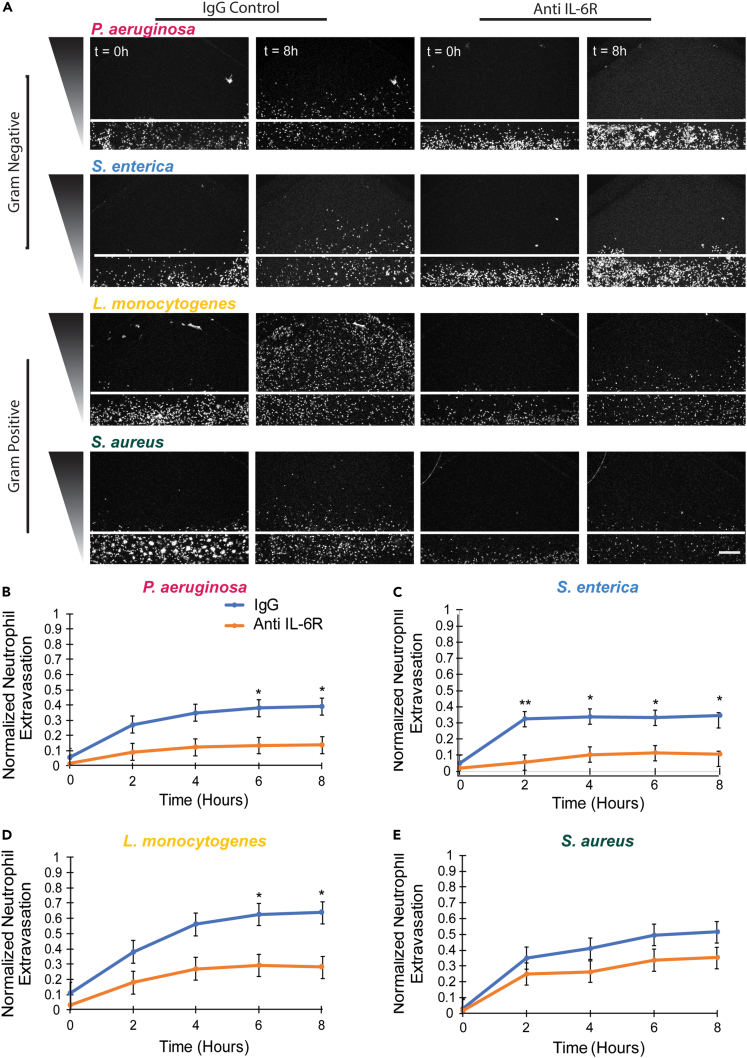
An efficient neutrophil response is critical for fighting bacterial infections, which remain a significant global health concern; therefore, modulating neutrophil function could be an effective therapeutic approach. While we have a general understanding of how neutrophils respond to bacteria, how neutrophil function differs in response to diverse bacterial infections remains unclear. Here, we use a microfluidic infection-on-a-chip device to investigate the neutrophil response to four bacterial species: Pseudomonas aeruginosa, Salmonella enterica, Listeria monocytogenes, and Staphylococcus aureus. We find enhanced neutrophil extravasation to L. monocytogenes, a limited overall response to S. aureus, and identify IL-6 as universally important for neutrophil extravasation. Furthermore, we demonstrate a higher percentage of neutrophils generate reactive oxygen species (ROS) when combating gram-negative bacteria versus gram-positive bacteria. For all bacterial species, we found the percentage of neutrophils producing ROS increased following extravasation through an endothelium, underscoring the importance of studying neutrophil function in physiologically relevant models.

Keywords: Bacteriology; Immunology.


Conflict of interest statement

None to declare.

Figures

None
Graphical abstract
Figure 1
Figure 1
Validation of infection-on-a-chip device (A) Schematic of infection-on-a-chip device showing primary human neutrophils (pink) inside of an endothelial cell lumen (yellow) migrating to a source of live bacteria (green). Collagen matrix (purple) surrounds the lumen. (B) Stained images of endothelial cell lumens. Cell nuclei are stained using Hoechst (blue), F-actin is stained with Phalloidin (red) and VE-Cadherin (green) is stained with an anti-CD144 antibody. Scale bar is 100 μm. (C) Bacterial CFUs at 0 and 16 h for P. aeruginosa, S. enterica, L. monocytogenes, and S. aureus. Data are represented as mean ± SEM.
Figure 2
Figure 2
Neutrophils have increased extravasation in response to L. monocytogenes (A) Representative images of neutrophils extravasating out of lumens in response to P. aeruginosa, S. enterica, L. monocytogenes, or S. aureus at 4-h intervals. Neutrophils stained with Calcein AM (white). White line represents the lumen boundary. Bacterial gradient direction shown on left. Scale bar is 100 μm. (B) Image showing region of interest used for quantification of neutrophil extravasation. Normalized neutrophil extravasation count is determined by dividing the number of neutrophils in the box outside of lumen (blue) by the number of neutrophils in rectangle inside of lumen (orange) at time zero as a loading control. Scale bar is 100 μm. (C) The number of neutrophils outside the lumen, normalized to the number of neutrophils initially in the lumen was quantified for P. aeruginosa, S. enterica, L. monocytogenes, or S. aureus every 4 h for 16 h. Data quantified from 14 lumens (P. aeruginosa), 13 lumens (S. enterica), 14 lumens (L. monocytogenes), or 12 lumens (S. aureus) across 5 independent experiments. Error bars represent the mean plus SEM. All bacteria were compared to each other at each time point and analyzed with ANOVA. For each condition, estimated marginal means (emmeans) and SEM were calculated and pairwise comparisons were performed with Tukey’s adjustment. Asterisks represent significance of neutrophil extravasation for each bacterial species condition compared to L. monocytogenes condition. P values are labeled as ∗p < 0.05.
Figure 3
Figure 3
Neutrophils migration characteristics in the presence of diverse pathogens (A and B) The Fiji software plugin MTrackJ was used to track neutrophils. The orange box indicates the area imaged for all migration experiments and the blue box represents the area in which the neutrophils were tracked. Representative images with tracks are shown in B. Scale bar is 100 μm for A and B. (C–F) Neutrophil migration parameters including speed (C), track length (D), total migration distance (E), and straightness (F) in response to P. aeruginosa, S. enterica, L. monocytogenes, or S. aureus from the cell tracks over 20-min intervals at 2-h time points. Data quantified from 14 lumens (P. aeruginosa), 12 lumens (S. enterica), 13 lumens (L. monocytogenes), or 14 lumens (S. aureus) across 5 independent experiments. Error bars represent the mean plus SEM. All bacteria were compared to each other at each time point and analyzed with ANOVA. For each condition, emmeans and SEM were calculated and pairwise comparisons were performed with Tukey’s adjustment. Asterisks represent significance of neutrophil migration for each bacterial species condition compared to L. monocytogenes condition at that time point. P values are labeled as ∗p < 0.05; ∗∗p <0 .001; #p < 0.0001. Individual data points are displayed with each gray scale color representing a different replicate.
Figure 4
Figure 4
An increased percentage of neutrophils produce ROS in response to gram-negative bacteria, P. aeruginosa and S. enterica (A) Neutrophils were seeded in collagen gels in a 48-well plate in the presence of P. aeruginosa, S. enterica, L. monocytogenes, or S. aureus and stained with Calcein AM to visualize all live cells and DHR123 to visualize intracellular ROS production. The percentage of neutrophils producing intracellular ROS in response to P. aeruginosa, S. enterica, L. monocytogenes, or S. aureus was quantified by dividing the number of DHR123-positive neutrophils by the total number of neutrophils (Calcein AM). Data quantified from 3-well plates for each bacterial species across 3 independent experiments. Error bars represent the mean plus SEM. All bacteria were compared to each other at each time point and analyzed with ANOVA. For each condition, emmeans and SEM were calculated and pairwise comparisons were performed with Tukey’s adjustment. Significance is shown with respect to both the L. monocytogenes and S. aureus condition. P values are labeled as ∗∗p <0 .01; #p <0 .0001. (B) Neutrophils were seeded in the infection-on-a-chip device and stained with DHR123 to visualize intracellular ROS production following extravasation in response to P. aeruginosa, S. enterica, L. monocytogenes, or S. aureus. Representative images showing intracellular ROS production (DHR123) and total neutrophils (Calcein AM) in the infection-on-a-chip device in the presence of P. aeruginosa, S. enterica, L. monocytogenes, or S. aureus. Images were taken every 4 min for 8 h. Images shown are at 3 h after introduction of bacteria. The first column shows all cells stained red with Calcein AM, the second column shows DHR123-positive green, fluorescent ROS producing cells. Scale bar is 100 μm. (C) The percentage of neutrophil expressing ROS was quantified in response to P. aeruginosa, S. enterica, L. monocytogenes, or S. aureus. Data quantified from 9 lumens for each bacterial species across 3 independent experiments. Error bars represent the mean plus SEM. All bacteria were compared to each other at each time point and analyzed with ANOVA. For each condition, emmeans and SEM were calculated and pairwise comparisons were performed with Tukey’s adjustment. Significance is shown with respect to both the L. monocytogenes and S. aureus condition. P values are labeled as ∗p < 0.05; ∗∗∗p <0 .001; #p <0 .0001.
Figure 5
Figure 5
Endothelial cells upregulate expression of IL-6 in response to diverse bacterial species A multiplexed ELISA screen was conducted for endothelial lumen-conditioned media with no bacteria, P. aeruginosa, S. enterica, L. monocytogenes, or S. aureus present. (A) Log2 fold changes of secreted signals from endothelial cells in the infection-on-a-chip device in the presence of P. aeruginosa, S. enterica, L. monocytogenes, or S. aureus compared to no bacteria condition. Scale ranges from darker blue, higher expression, to lighter blue, lower expression. Factors measured are labeled on the left side of the heatmap. (B) The levels of IL-6 expressed as a log2 fold change over the no bacteria condition for endothelial cells in the presence of P. aeruginosa, S. enterica, L. monocytogenes, or S. aureus. Data quantified from 12 lumens for each bacterial species across 4 independent experiments. Error bars represent least-squared mean plus SEM. All bacteria were compared to each other at each time point and analyzed with ANOVA. For each condition, emmeans and SEM were calculated and pairwise comparisons were performed with Tukey’s adjustment. Significance is shown with respect to the no bacteria condition. ∗p < 0.05; ∗∗p <0 .01. Individual data points are displayed with each gray scale color representing a different replicate. (C) The levels of MIP-1 alpha expressed as a log2 fold change over the no bacteria condition for endothelial cells in the presence of P. aeruginosa, S. enterica, L. monocytogenes, or S. aureus. Data quantified from 12 lumens for each bacterial species across 4 independent experiments. Error bars represent least-squared mean plus SEM. All bacteria were compared to each other at each time point and analyzed with ANOVA. For each condition, emmeans and SEM were calculated and pairwise comparisons were performed with Tukey’s adjustment. Significance is shown with respect to the no bacteria condition. ∗p < 0.05; ∗∗p <0 .01. Individual data points are displayed with each gray scale color representing a different replicate.
Figure 6
Figure 6
IL-6 is required for neutrophil extravasation in response to diverse bacterial species (A) Representative images of neutrophils migrating out of endothelial lumens at 0 and 8 h in the presence of a control IgG antibody (two left columns) or an IL-6 receptor blocking antibody (two right columns). White line represents the lumen boundary. Scale bar is 100 μm. (B–E) The number of neutrophils outside the lumen, normalized to the number of neutrophils initially in the lumen was quantified for (B) P. aeruginosa, (C) S. enterica, (D) L. monocytogenes, or (E) S. aureus every 2 h for 8 h in the presence of either an IgG control antibody or IL-6 receptor blocking antibody. Data quantified from 9 lumens for each bacterial species and each antibody condition across 3 independent experiments. Error bars represent the mean plus SEM. All bacteria were compared to each other at each time point and analyzed with ANOVA. For each condition, emmeans and SEM were calculated and pairwise comparisons were performed with Tukey’s adjustment. Asterisks represent significance between IL-6 receptor blocking antibody condition and IgG control condition. P values are labeled as ∗p < 0.05; ∗∗p <0 .01.

Similar articles

Cited by

References

    1. Richardson I.M., Calo C.J., Hind L.E. Microphysiological Systems for Studying Cellular Crosstalk During the Neutrophil Response to Infection. Front. Immunol. 2021;12:661537. - PMC - PubMed
    1. Moreland J.G., Bailey G., Nauseef W.M., Weiss J.P. Organism-Specific Neutrophil-Endothelial Cell Interactions in Response to Escherichia coli , Streptococcus pneumoniae , and Staphylococcus aureus. J. Immunol. 2004;172:426–432. - PubMed
    1. Angus D.C., van der Poll T. Severe Sepsis and Septic Shock. N. Engl. J. Med. 2013;369:840–851. - PubMed
    1. Xie J., Van Hoecke L., Vandenbroucke R.E. The Impact of Systemic Inflammation on Alzheimer’s Disease Pathology. Front. Immunol. 2021;12:796867. - PMC - PubMed
    1. Martínez-García M., Hernández-Lemus E. Periodontal Inflammation and Systemic Diseases: An Overview. Front. Physiol. 2021;12:709438. - PMC - PubMed

LinkOut - more resources