. 2023 Dec 4;27(1):108629.
doi: 10.1016/j.isci.2023.108629. eCollection 2024 Jan 19.

Intracellular Ca2+ oscillation frequency and amplitude modulation mediate epithelial apical and basolateral membranes crosstalk

Affiliations

Intracellular Ca2+ oscillation frequency and amplitude modulation mediate epithelial apical and basolateral membranes crosstalk

Noman Hassan et al. iScience. .

Abstract

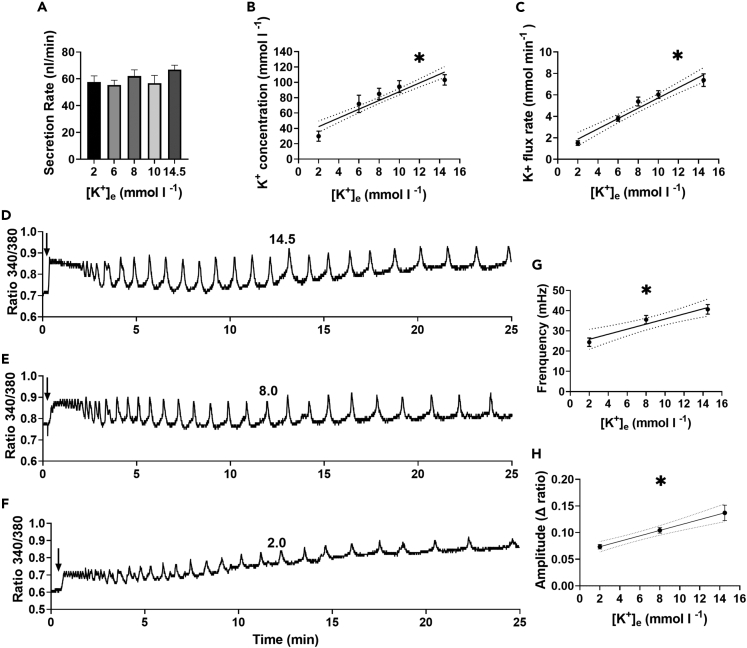
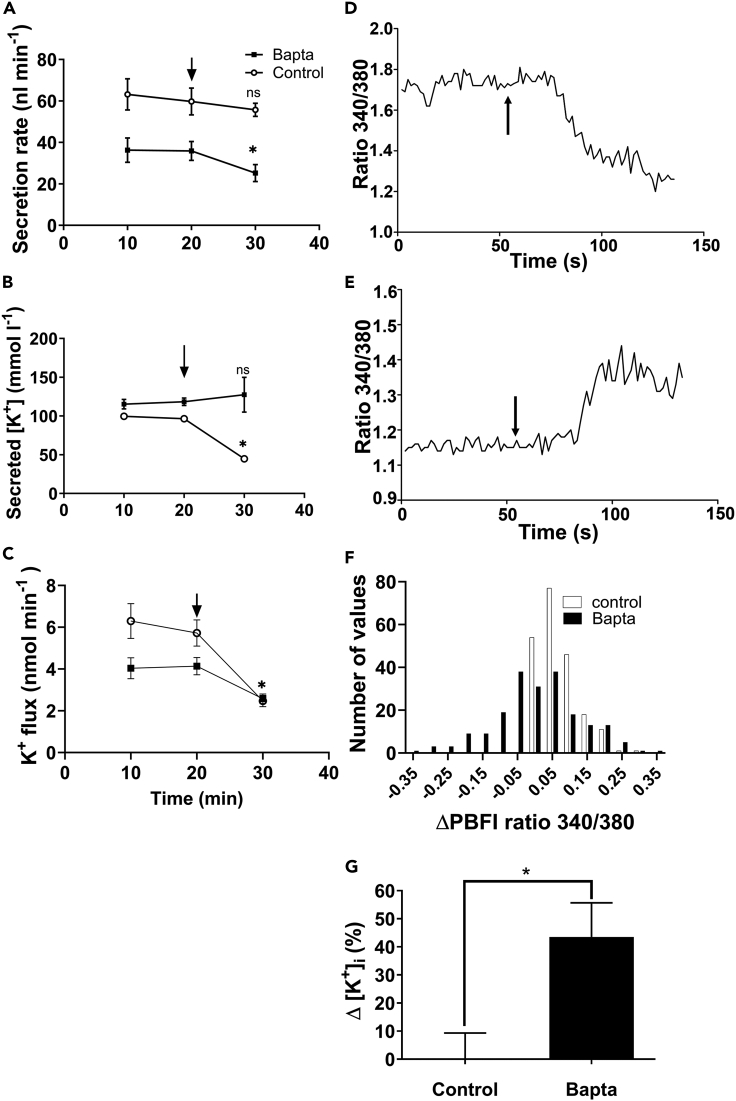
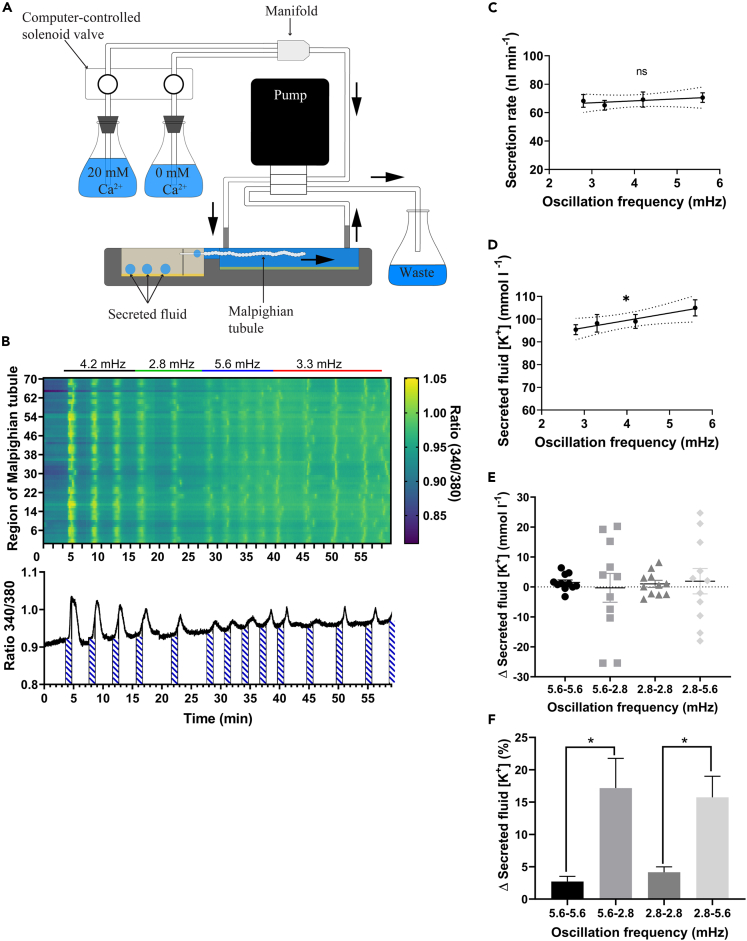
Since the early seminal studies on epithelial solute transport, it has been understood that there must be crosstalk among different members of the transport machinery to coordinate their activity and, thus, generate localized electrochemical gradients that force solute flow in the required direction that would otherwise be thermodynamically unfavorable. However, mechanisms underlying intracellular crosstalk remain unclear. We present evidence that crosstalk between apical and basolateral membrane transporters is mediated by intracellular Ca2+ signaling in insect renal epithelia. Ion flux across the basolateral membrane is encoded in the intracellular Ca2+ oscillation frequency and amplitude modulation and that information is used by the apical membrane to adjust ion flux accordingly. Moreover, imposing experimentally generated intracellular Ca2+ oscillation modulation causes cells to predictably adjust their ion transport properties. Our results suggest that intracellular Ca2+ oscillation frequency and amplitude modulation encode information on transmembrane ion flux that is required for crosstalk.

Keywords: Cell biology; Molecular physiology; Physiology.


Conflict of interest statement

The authors declare no competing interests.

Figures

None
Graphical abstract
Figure 1
Figure 1
Intracellular Ca2+ signaling in Malpighian (renal) tubule cells of the blood-feeding insect Rhodnius prolixus (A) R. prolixus ingest large blood meal volumes that can be up to 12 times the unfed (upper panel) body weight (lower panel shows a fed animal, scale bar = 1 cm). While the cellular component of the blood meal is stored in the midgut, the excess water and ions ingested are excreted through the Malpighian tubules. The post-prandial diuretic process is stimulated by the release of diuretic hormones, including serotonin. (B) Intracellular Ca2+ in Malpighian tubules was measured in selected regions of identical size as indicated with circular symbols of different colors along the length of the entire tissue sample. The measuring regions were placed in such as way to avoid including the lumen of the tubule. The numbers 1, 20 and 40 indicate the measuring region from the distal to the proximal side. (C) Heatmap of the serotonin-triggered intracellular Ca2+ oscillations measured along the length of the tubule (y axis) at the sites indicated by the multicolor circles in panel B over time (x axis). The intracellular Ca2+ oscillations are required to stimulate transcellular fluid secretion across the Malpighian tubule cells. Oscillations initiate in a cell (red asterisk) and propagate along the length of the tubule (red arrows). (D) The fluid secreted by the upper segment of Malpighian tubules of R. prolixus during diuresis consists of approximately 100 mM NaCl and 80 mM KCl (green arrow). Secretion of ions and osmotically obliged water by the tubules is driven by an apical vacuolar-type H+-ATPase that generates a H+ gradient across the apical membrane that energizes the exchange of cytoplasmic K+ and/or Na+ for luminal H+. Na+, K+ and Cl enter the cell from the serosal side through a basolateral Na+-K+-2Cl- cotransporter (NKCC1). The contribution of paracellular pathways is negligible.
Figure 2
Figure 2
Intracellular Ca2+ oscillation frequency and amplitude are proportional to K+ concentration in the bathing fluid (A) After stimulation with serotonin the Malpighian tubules secreted fluid at maximum rate when bathed in saline containing 2, 6, 8, 10, and 14.5 Mm K+ ([K+]e) while all other ions remain constant (p = 0.42, ANOVA F(4, 32) = 1.003). However, the secreted fluid (B) K+ concentration (p < 0.0001, linear regression F(1, 36) = 141.8) and (C) transepithelial K+ flux (p < 0.0001, linear regression F(1, 29) = 128.1) produced by the tubules directly correlated with K+ concentration in the bathing fluid. Serotonin-stimulated (1 μM, downward arrow) intracellular Ca2+ signaling produced by tubules exposed to (D) 14.5, (E) 8, or (F) 2 mM K+ displayed oscillation with a (G) frequency (first 5 min after serotonin stimulation, p < 0.0004, linear regression F(1, 13) = 22.51) and (H) amplitude (p < 0.0001, linear regression F(1, 101) = 38.72) that correlated with the K+ concentration in the bathing fluid. Asterisks indicate statistical significance.
Figure 3
Figure 3
Intracellular Ca2+ oscillation frequency and amplitude are proportional to bumetanide-modulated transepithelial ion flux (A) Na+:K+:2Cl- cotransporter blocker bumetanide reduces Malpighian tubule fluid secretion in a concentration-dependent manner. Sample trace of intracellular Ca2+ oscillation from serotonin-stimulated (1 μM, downward arrow) tubules exposed to (B) 10, (C) 5, and (D) 1 μM bumetanide. The intracellular Ca2+ oscillation (E) frequency and (F) amplitude.
Figure 4
Figure 4
Instantaneous reduction in bathing fluid K+ concentration ([K+]e) causes a reduction in intracellular Ca2+ oscillation frequency and amplitude (A) Sample traces of intracellular Ca2+ oscillation by Malpighian tubules initially bathed in 14.5 mM K+ and instantaneously switched to 2, 4, 6, 8, or 14.5 mM K+. (B) The intracellular Ca2+ oscillation frequency displayed by the Malpighian tubules directly correlates with magnitude of the change in [K+]e (p < 0.0001, linear regression F(1, 130) = 67.8). (C) The intracellular Ca2+ oscillation amplitude displayed by the Malpighian tubules correlates directly with magnitude of the change in [K+]e (p < 0.0001, linear regression F(1, 130) = 90.23). Asterisks indicate statistical significance.
Figure 5
Figure 5
Blocking intracellular Ca2+ oscillation with BAPTA-AM inhibits cellular K+ homeostasis (A) Secreted fluid produced by Malpighian tubules exposed to an instantaneous change in bath K+ concentration from 14.5 to 2 mM (downward arrow) in control and BAPTA-AM (300 μM) groups. BAPTA-treated tubules significantly reduced secretion rate after the reduction in bathing fluid K+ concentration (p = 0.019, repeated measures two-way ANOVA, Tukey’s multiple comparisons test, n = 9) while control preparations maintain constant secretion rate (p = 0.64, repeated measures two-way ANOVA, Tukey’s multiple comparisons test, n = 6). (B) Secreted fluid K+ concentration decreased in control preparations (p = 0.017, repeated measures two-way ANOVA, Tukey’s multiple comparisons test, n = 7) while K+ concentration in secreted fluid remained constant in BAPTA-treated preparations (p = 0.7, repeated measures two-way ANOVA, Tukey’s multiple comparisons test, n = 10). (C) K+ flux diminished in both control preparation (p = 0.024, repeated measures two-way ANOVA, Tukey’s multiple comparisons test, n = 7) and BAPTA-treated preparations (p = 0.034, repeated measures two-way ANOVA, Tukey’s multiple comparisons test, n = 10). (D and E) Sample trace of PBFI-AM-measured intracellular K+ concentration in the BAPTA-treated tubules before and after (downward arrow) switching bath K+ from 14.5 to 2 mM. Approximately 50% of tubules show a (D) decrease or (E) increase in intracellular K+. (F) Histogram displaying the frequency distribution of changes in intracellular K+ in response to the change in extracellular K+. The frequency distribution in BAPTA-treated preparations is significantly different from the control group (p < 0.0001, Chi-square test for trend, Chi-square 37.68, df 1). (G) Normalized change in intracellular K+ concentration triggered by instantaneous reduction in bath K+ concentration. There was a significant change in intracellular K+ concentration in BAPTA-treated tubules but not in control tubules (Student’s t test, p = 0.0001, n = 7). Asterisks indicate statistical significance and “ns” indicates no statistically significant difference.
Figure 6
Figure 6
Experimentally generated intracellular Ca2+ oscillation modulate transepithelial K+ flux (A) Diagram of the calcium clamping apparatus. Flow of Ringer’s solution containing 20 and 0 mM Ca2+ is controlled with computer-controlled solenoid valves and driven by a peristaltic pump. The Malpighian tubule is placed in a custom-built chamber consisting of a bathing section that allows for superfusion with Ringer’s solution (right side) and a secretion-collecting section (left side, arrows indicate direction of fluid flow). The fluid secreted by the Malpighian tubules is collected at the open end of the tubule under paraffin oil and the volume is calculated. The secreted droplets are collected to measure K+ concentration. (B) Heatmap of experimentally triggered intracellular Ca2+ oscillations measured along the length of the tubule (x axis) over time (y axis) with the frequency indicated in mHz at the top. The lower panel shows that the increase in intracellular Ca2+ coincides with the timing of superfusion with Ringer’s solution containing 20 mM K+ (dashed bars). (C) Calcium-clamped Malpighian tubules (stimulated serotonin 1 μM) secrete fluid at high rates that are similar to control preparations. The rate of transport is independent of the experimentally generated intracellular Ca2+ oscillation frequency (p = 0.67, linear regression F(1, 39) = 0.1827). (D) The K+ concentration, and thus K+ flux, is directly proportional to the experimentally generated intracellular Ca2+ oscillation frequency (p = 0.036, linear regression F(1, 42) = 4.679). (E) Effects on the K+ concentration in the secreted fluid of switching the frequency of the experimentally generated intracellular Ca2+ oscillation from 5.6 to 2.8 mHz or from 2.8 to 5.6 mHz (n = 11). (F) Percentage absolute change of K+ concentration in the secreted fluid triggered by switching the frequency of the experimentally generated intracellular Ca2+ oscillation from 5.6 to 2.8 mHz (p = 0.0017, ANOVA, Sidak’s multiple comparisons test, n = 11) or from 2.8 to 5.6 mHz (p = 0.012, ANOVA, Sidak’s multiple comparisons test, n = 11). Asterisks indicate statistical significance and “ns” indicates no statistically significant difference.

Similar articles

References

    1. Schultz S.G. Homocellular regulatory mechanisms in sodium-transporting epithelia: avoidance of extinction by “flush-through.”. Am. J. Physiol. 1981;241:F579–F590. - PubMed
    1. Diamond J.M. Transcellular cross-talk between epithelial cell membranes. Nature. 1982;300:683–685. - PubMed
    1. Schultz S.G., Lapointe J.-Y. In: The Kidney: Physiology and Pathophysiology. Third Edition. Seldin D., Giebisch G., editors. Lippincott-Raven; 1999. Membrane cross-talk in sodium-absorbing epithelial cells.
    1. Krogh A. The active absorption of ions in some freshwater animals. Z Vergl. Physiol. 1938;25:335–350.
    1. Foskett J.K., Bern H.A., Machen T.E., Conner M. Chloride cells and the hormonal control of teleost fish osmoregulation. J. Exp. Biol. 1983;106:255–281. - PubMed

LinkOut - more resources