

Altered Outer Retinal Structure, Electrophysiology and Visual Perception in Parkinson's Disease
- PMID: 38189711
- PMCID: PMC10836541
- DOI: 10.3233/JPD-230293
Altered Outer Retinal Structure, Electrophysiology and Visual Perception in Parkinson's Disease
Abstract
Background: Visual biomarkers of Parkinson's disease (PD) are attractive as the retina is an outpouching of the brain. Although inner retinal neurodegeneration in PD is well-established this has overlap with other neurodegenerative diseases and thus outer retinal (photoreceptor) measures warrant further investigation.
Objective: To examine in a cross-sectional study whether clinically implementable measures targeting outer retinal function and structure can differentiate PD from healthy ageing and whether these are sensitive to intraday levodopa (L-DOPA) dosing.
Methods: Centre-surround perceptual contrast suppression, macular visual field sensitivity, colour discrimination, light-adapted electroretinography and optical coherence tomography (OCT) were tested in PD participants (n = 16) and controls (n = 21). Electroretinography and OCT were conducted before and after midday L-DOPA in PD participants, or repeated after ∼2 hours in controls.
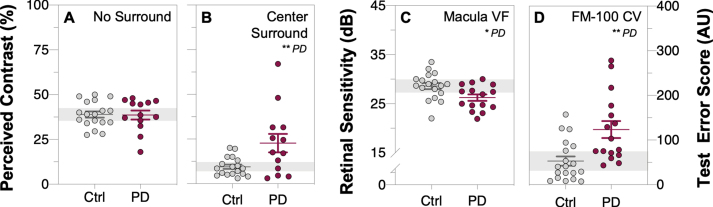
Results: PD participants had decreased center-surround contrast suppression (p < 0.01), reduced macular visual field sensitivity (p < 0.05), color vision impairment (p < 0.01) photoreceptor dysfunction (a-wave, p < 0.01) and photoreceptor neurodegeneration (outer nuclear layer thinning, p < 0.05), relative to controls. Effect size comparison between inner and outer retinal parameters showed that photoreceptor metrics were similarly robust in differentiating the PD group from age-matched controls as inner retinal changes. Electroretinography and OCT were unaffected by L-DOPA treatment or time.
Conclusions: We show that outer retinal outcomes of photoreceptoral dysfunction (decreased cone function and impaired color vision) and degeneration (i.e., outer nuclear layer thinning) were equivalent to inner retinal metrics at differentiating PD from healthy age-matched adults. These findings suggest outer retinal metrics may serve as useful biomarkers for PD.
Keywords: Color vision; center-surround suppression; electroretinography; optical coherence tomography; retina.
Conflict of interest statement
CN and BB are joint investigators on an Australian Research Council Linkage grant LP160100126 with AstraZeneca Neuroscience and Biogen Inc. AM has received research funding support from Heidelberg Engineering (GmBH) who manufacture the Spectralis OCT. No conflicts of interest, financial or otherwise, are declared by the other authors.
Figures


Similar articles
-
Keeping an eye on Parkinson's disease: color vision and outer retinal thickness as simple and non-invasive biomarkers.J Neurol. 2025 Apr 21;272(5):351. doi: 10.1007/s00415-025-13080-6. J Neurol. 2025. PMID: 40257599 Free PMC article. Review.
-
Correlations among multifocal electroretinography and optical coherence tomography findings in patients with Parkinson's disease.Neurol Sci. 2018 Mar;39(3):533-541. doi: 10.1007/s10072-018-3244-2. Epub 2018 Jan 18. Neurol Sci. 2018. PMID: 29349656
-
Photoreceptor layer thinning in idiopathic Parkinson's disease.Mov Disord. 2014 Aug;29(9):1163-70. doi: 10.1002/mds.25896. Epub 2014 Apr 30. Mov Disord. 2014. PMID: 24789530
-
Electroretinography reveals retinal dysfunction in Parkinson's disease despite normal high-resolution optical coherence tomography findings.Parkinsonism Relat Disord. 2022 Aug;101:90-95. doi: 10.1016/j.parkreldis.2022.06.018. Epub 2022 Jun 28. Parkinsonism Relat Disord. 2022. PMID: 35810523
-
Optical coherence tomography in Parkinson's disease: is the retina a biomarker?J Parkinsons Dis. 2014;4(2):197-204. doi: 10.3233/JPD-130306. J Parkinsons Dis. 2014. PMID: 24518436 Review.
Cited by
-
Keeping an eye on Parkinson's disease: color vision and outer retinal thickness as simple and non-invasive biomarkers.J Neurol. 2025 Apr 21;272(5):351. doi: 10.1007/s00415-025-13080-6. J Neurol. 2025. PMID: 40257599 Free PMC article. Review.
-
Generating Synthetic Light-Adapted Electroretinogram Waveforms Using Artificial Intelligence to Improve Classification of Retinal Conditions in Under-Represented Populations.J Ophthalmol. 2024 Jul 16;2024:1990419. doi: 10.1155/2024/1990419. eCollection 2024. J Ophthalmol. 2024. PMID: 39045382 Free PMC article.
-
Optical coherence tomography in patients with major depressive disorder.BMC Psychiatry. 2025 Apr 9;25(1):356. doi: 10.1186/s12888-025-06775-7. BMC Psychiatry. 2025. PMID: 40205425 Free PMC article.
-
Effects of medications on the human electroretinogram: A comprehensive review.Surv Ophthalmol. 2025 Apr 12:S0039-6257(25)00067-0. doi: 10.1016/j.survophthal.2025.04.003. Online ahead of print. Surv Ophthalmol. 2025. PMID: 40228746 Review.
References
Publication types
MeSH terms
Substances
LinkOut - more resources
Full Text Sources
Medical
