. 2024 Feb 5;221(2):e20230449.
doi: 10.1084/jem.20230449. Epub 2024 Jan 8.

Eomes-dependent mitochondrial regulation promotes survival of pathogenic CD4+ T cells during inflammation

Affiliations

Eomes-dependent mitochondrial regulation promotes survival of pathogenic CD4+ T cells during inflammation

Emeline Joulia et al. J Exp Med. .

Abstract

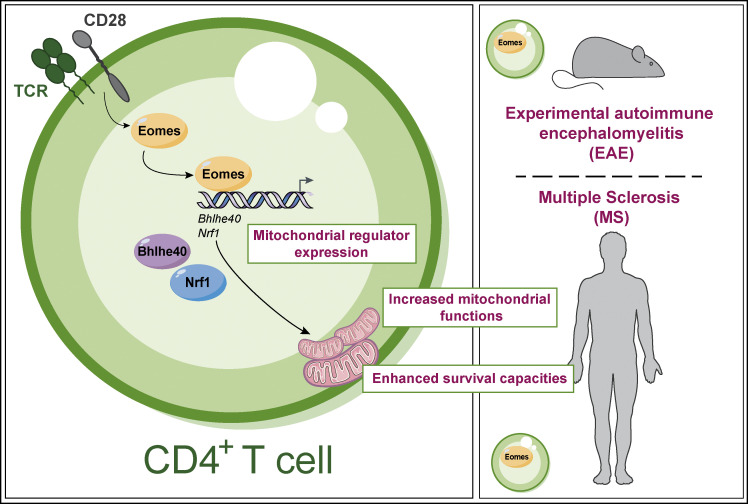
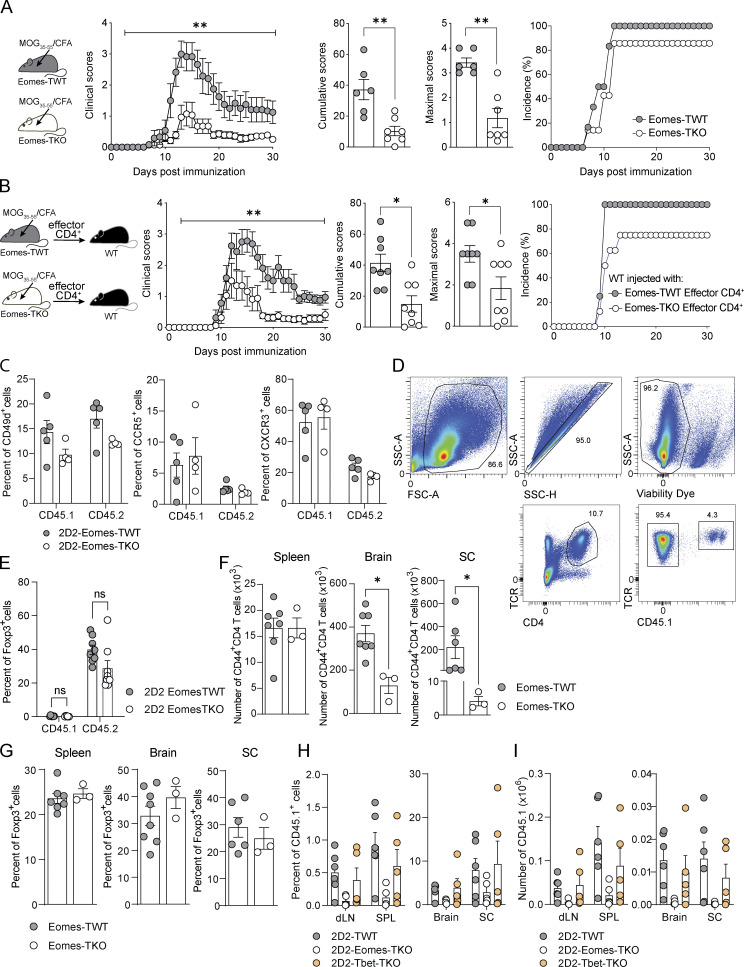
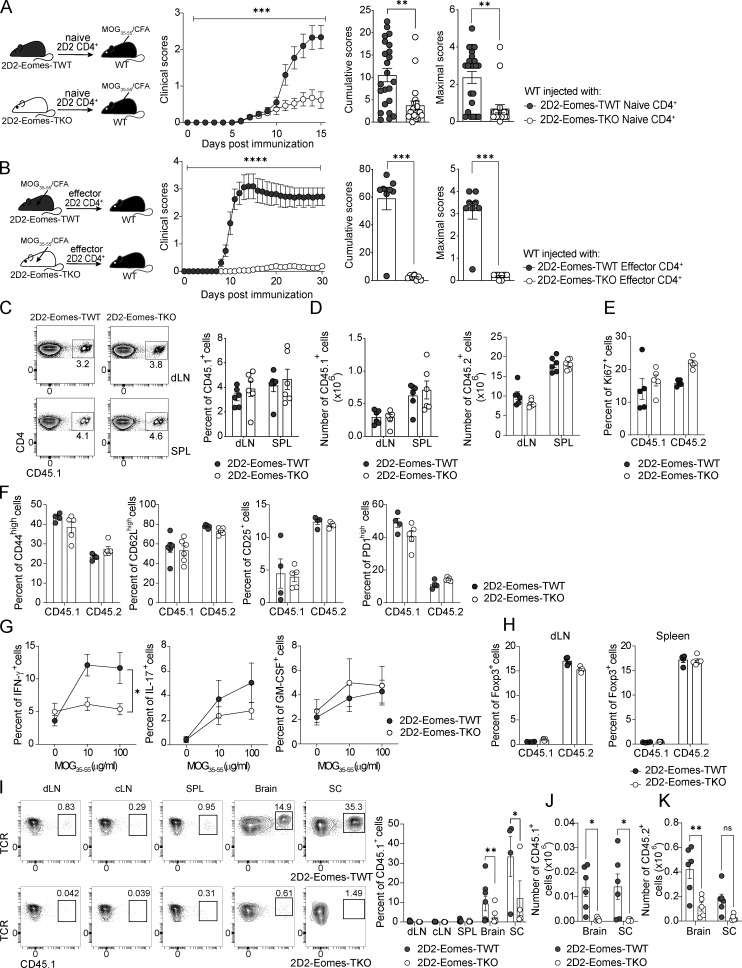
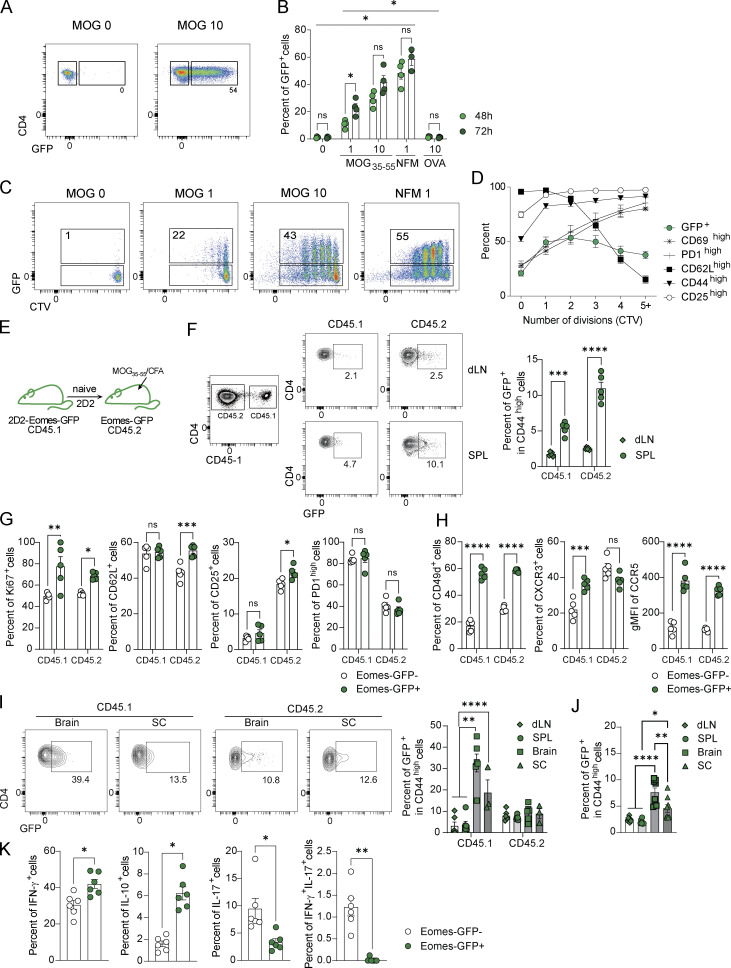
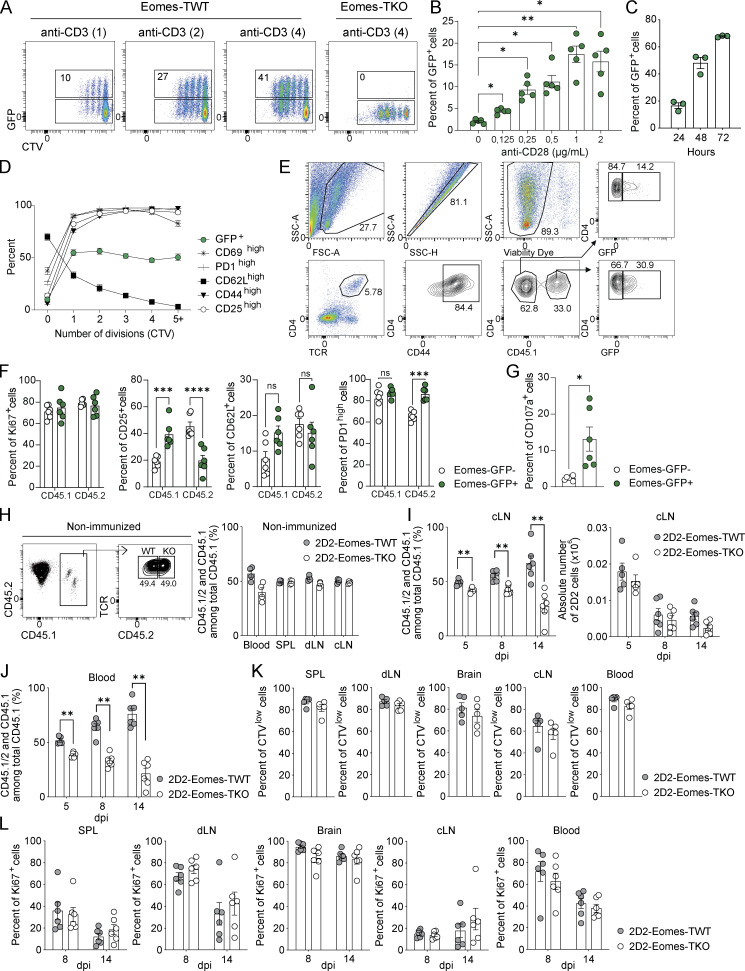
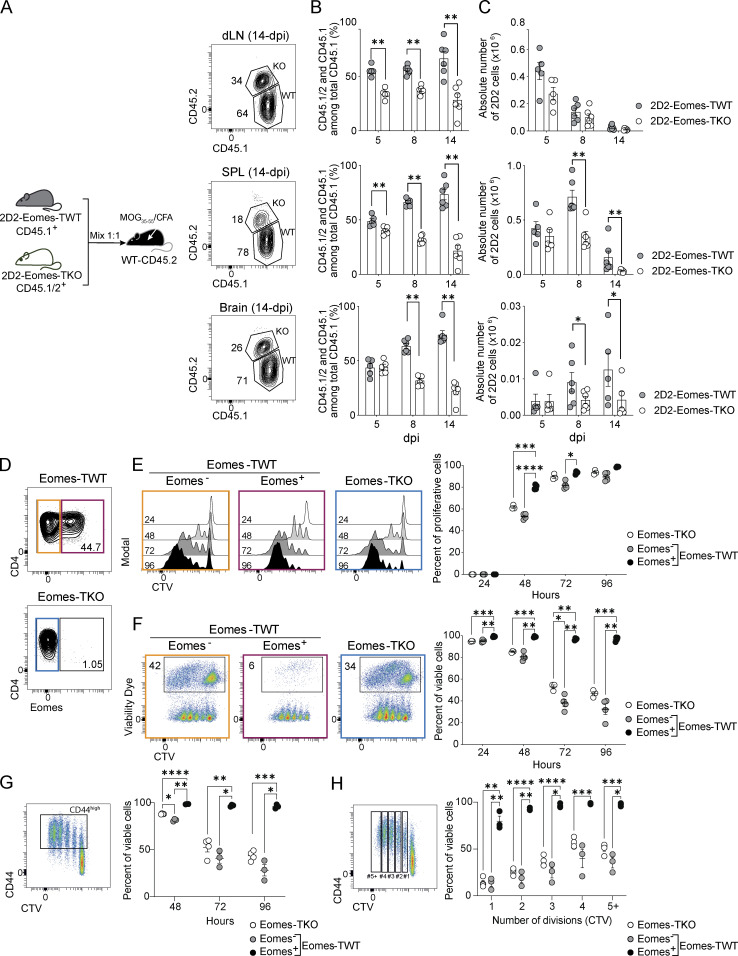
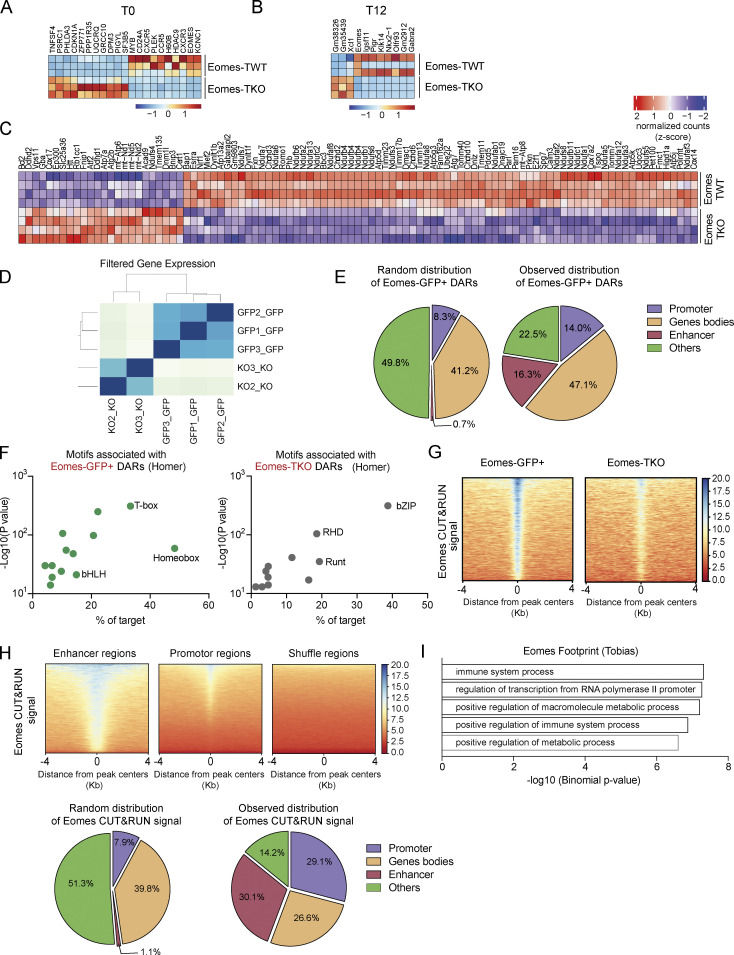
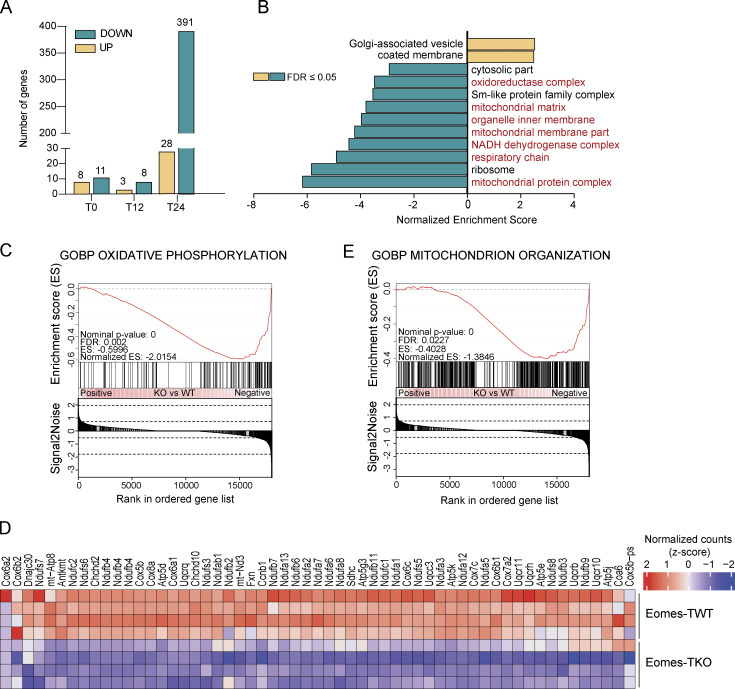
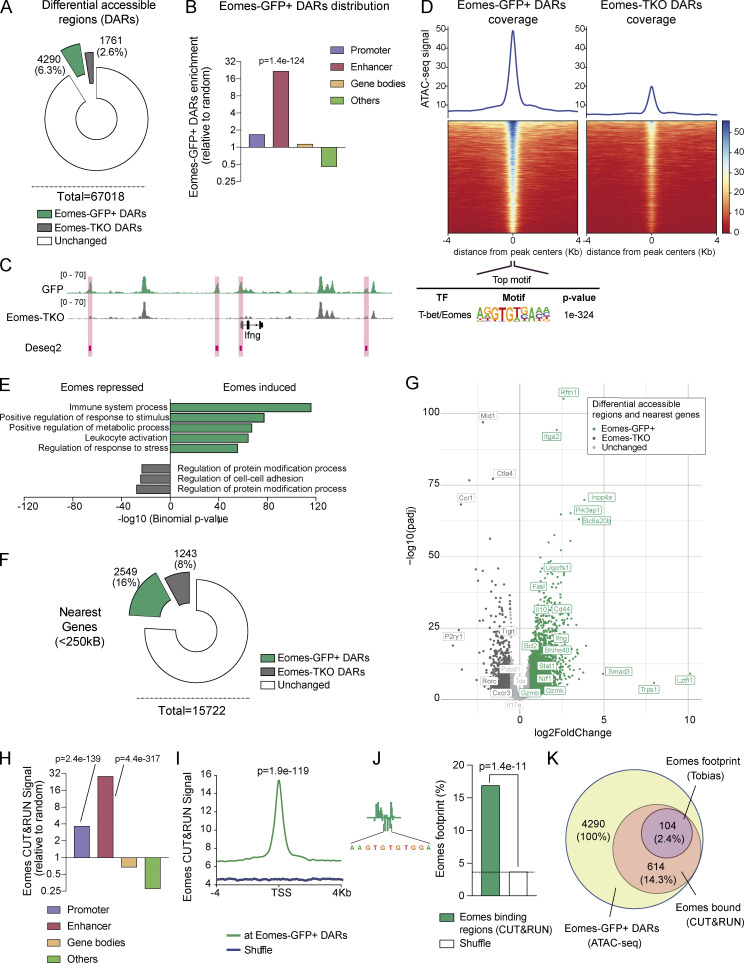
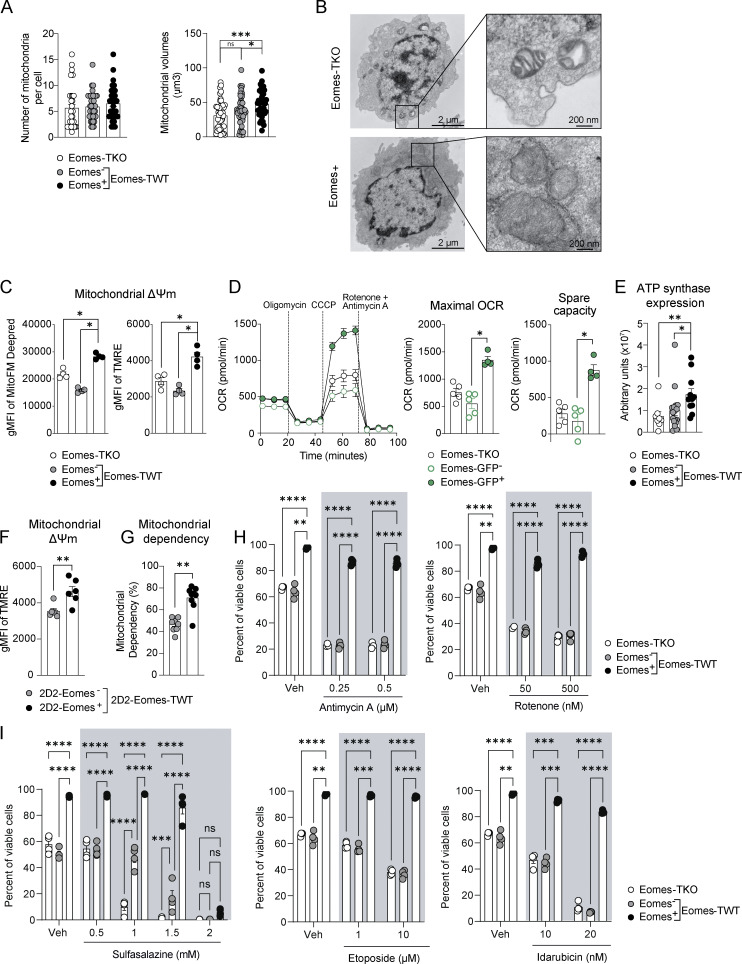
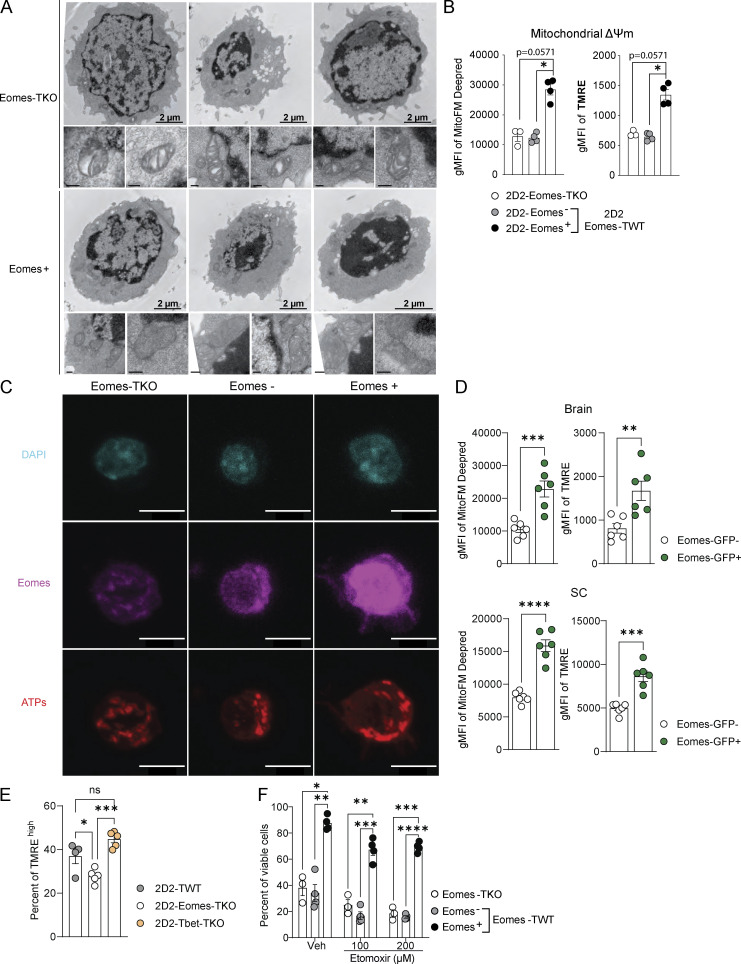
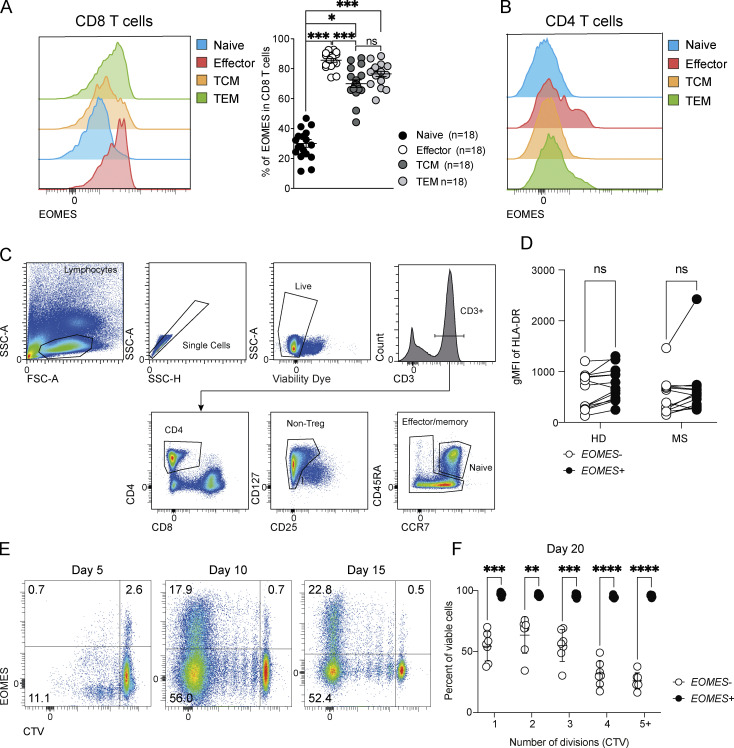
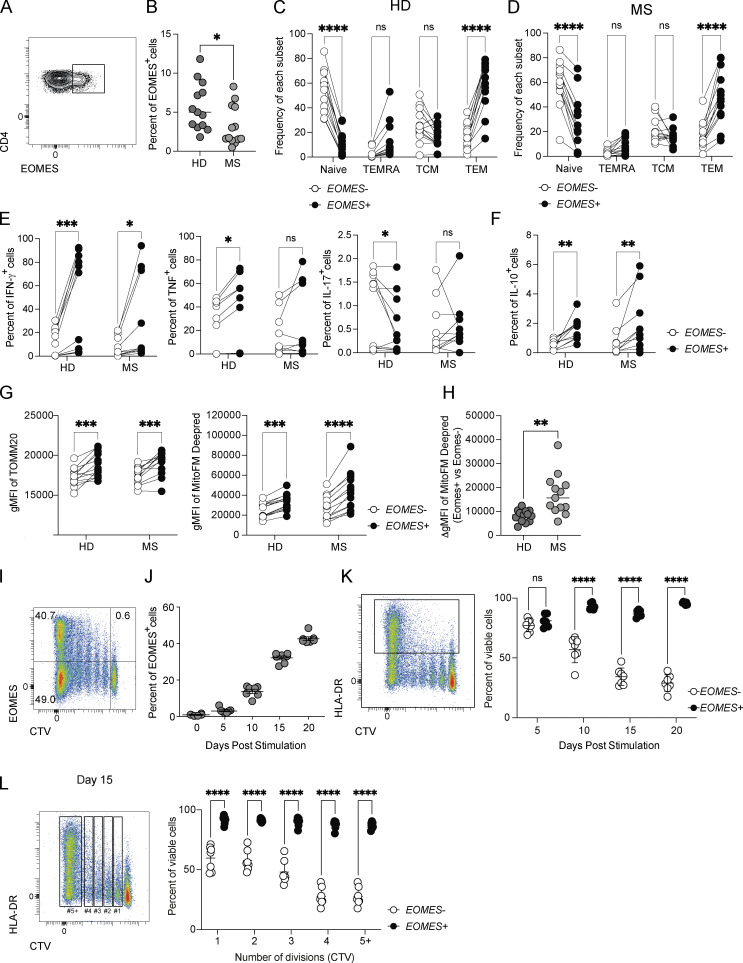
The mechanisms whereby Eomes controls tissue accumulation of T cells and strengthens inflammation remain ill-defined. Here, we show that Eomes deletion in antigen-specific CD4+ T cells is sufficient to protect against central nervous system (CNS) inflammation. While Eomes is dispensable for the initial priming of CD4+ T cells, it is required for long-term maintenance of CNS-infiltrating CD4+ T cells. We reveal that the impact of Eomes on effector CD4+ T cell longevity is associated with sustained expression of multiple genes involved in mitochondrial organization and functions. Accordingly, epigenetic studies demonstrate that Eomes supports mitochondrial function by direct binding to either metabolism-associated genes or mitochondrial transcriptional modulators. Besides, the significance of these findings was confirmed in CD4+ T cells from healthy donors and multiple sclerosis patients. Together, our data reveal a new mechanism by which Eomes promotes severity and chronicity of inflammation via the enhancement of CD4+ T cell mitochondrial functions and resistance to stress-induced cell death.


Conflict of interest statement

Disclosures: The authors declare no competing interests exist.

Figures

None
Graphical abstract
Figure S1.
Figure S1.
Eomes deletion reduces EAE severity without impacting migratory capacities or Treg compartment. (A) Eomes-TWT (n = 6) and Eomes-TKO mice (n = 7) were immunized with MOG35–55 peptide emulsified in CFA and injected i.v. with pertussis toxin. Clinical scores were evaluated daily and cumulative and maximal scores were calculated. Incidence is shown. (B) Eomes-TWT (n = 8) and Eomes-TKO (n = 8) mice were immunized with MOG35–55 peptide emulsified in CFA. At 10 dpi, cells from dLN and spleen were collected and stimulated with MOG35–55 in the presence of anti-IFN-γ mAb and IL-23. CD4+ T cells were then purified and injected i.v. into WT C57BL/6J recipients (n = 8 mice per group) and clinical scores were evaluated and cumulative and maximal scores were calculated. Incidence is shown. (C) Expression of migratory markers was analyzed in CD45.1+ and CD45.2+ compartments from mice injected with either 2D2-Eomes-TWT or 2D2-Eomes-TKO cells at 8 dpi in the spleen (n = 5 and 4 mice/group). (D) Representative gating strategy showing CD45.1+ and CD45.2+ CD4+ T cell compartment analysis in the brain of WT C57BL/6J recipients transferred with 2D2-Eomes-TWT cells. (E) Proportion of Foxp3+ regulatory T cells in both CD45.1+ and CD45.2+ CD4+ T cell compartments was assessed at 14 dpi in the brain of mice transferred with 2D2-Eomes-TWT and 2D2-Eomes-TKO (n = 8 mice/group). (F and G) (F) Absolute number of CD44high CD4+ T cells and (G) percentage of Foxp3+ CD4+ T cells in spleen, brain, and SC at 14 dpi upon active immunization of Eomes-TWT and Eomes-TKO mice (n = 7 and 3 mice/group). (H and I) (H) Percentage and (I) absolute number of 2D2-TWT, 2D2-Eomes-TKO, and 2D2-Tbet-TKO cells were analyzed at 14 dpi in dLN, spleen, brain, and SC (n = 6, 5, and 5 mice, respectively). Data are a pool of two experiments (E) or representative of at least two independent experiments. Error bars = SEM; P values (Mann–Whitney U test) or P values (two-way ANOVA with Bonferroni correction for clinical scores)—**P < 0.01, *P < 0.05.
Figure 1.
Figure 1.
Eomes is required for pathogenic CD4+ T cells functions during neuroinflammation. (A) 200,000 naïve CD4+ T cells from 2D2-Eomes-TWT or 2D2-Eomes-TKO mice were injected into WT C57BL/6J recipient mice prior to immunization (n = 23 and 20 mice per group, respectively) and clinical scores were evaluated and cumulative and maximal scores were determined. (B) 2D2-Eomes-TWT and 2D2-Eomes-TKO mice were immunized with MOG35–55 peptide emulsified in CFA. At 7 dpi, cells from dLN and spleen were collected and stimulated with MOG35–55 in the presence of anti-IFN-γ mAb and IL-23. CD4+ T cells were then purified, and 800,000 cells were injected i.v. into C57BL/6J recipients (n = 8 mice per group). Clinical scores were then evaluated, and cumulative and maximal scores were determined. (C) Naïve CD45.1+ cells purified from 2D2-Eomes-TWT or 2D2-Eomes-TKO mice were injected into WT C57BL/6J CD45.2 recipient mice (n = 4–6 mice per group) prior to immunization with MOG35–55 peptide and percentage of CD45.1+ cells among CD4+ T cells was assessed in both dLN and spleen (SPL) at 8 dpi. (D) Absolute numbers of 2D2 cells (CD45.1) and endogenous CD4+ T cells (CD45.2) were assessed in both dLN and spleen at 8 dpi (n = 6 mice/group). (E and F) (E) Ki67 and (F) activation marker expression were analyzed in both CD45.1+ and CD45.2+ CD4+ T cells from mice injected with either 2D2-Eomes-TWT and 2D2-Eomes-TKO cells at 8 dpi (n = 4 or 5 and 5 mice, respectively). (G) Intracellular staining of IFN-γ, IL-17, and GM-CSF expression by 2D2-Eomes-TWT and 2D2-Eomes-TKO CD45.1+ T cells from the dLN was assessed at 8 dpi after 48 h of ex vivo restimulation with MOG35–55 peptide (n = 10 and 9 mice/group). (H) Percentage of Foxp3+ CD4+ T cells was assessed in both CD45.1+ and CD45.2+ compartments in dLN and spleen at 8 dpi (n = 4 and 5 mice). (I) Naïve CD4+ T cells from 2D2-Eomes-TWT and 2D2-Eomes-TKO mice were injected into C57BL/6 mice prior to immunization (n = 6 mice/group), and percentages of CD45.1+ 2D2-Eomes-TWT or 2D2-Eomes-TKO cells were analyzed at 14 dpi in dLN, cervical lymph nodes (cLN), spleen, brain, and spinal cord. (J and K) (J) Absolute number of CD45.1+ 2D2-Eomes-TWT or 2D2-Eomes-TKO cells or (K) endogenous CD45.2+ CD4+ T cells was assessed at 14 dpi in the brain and SC of mice treated as in I. Data are representative of at least two independent experiments and a pool of two (G) and three independent experiments (A). Error bars = SEM; P values for cumulative and maximal scores (Mann–Whitney U test), P values for clinical scores, cytokine production, and absolute numbers (two-way ANOVA with Bonferroni correction)—****P < 0.0001, ***P < 0.001, **P < 0.01, and *P < 0.05. See also Fig. S1.
Figure 2.
Figure 2.
Eomes expression delineates a population of highly activated CD4+ T cells that accumulate in the CNS during neuroinflammation. (A) Representative dot plots of CD4 versus GFP expression of naïve 2D2-Eomes-GFP cells unstimulated (left) or stimulated for 72 h in vitro with APCs loaded with 10 μg/ml of MOG35–55 peptide (right). (B) Percentages of GFP-expressing cells of naïve 2D2-Eomes-GFP cells stimulated in vitro with APCs loaded with MOG35–55 (1 or 10 μg/ml), NFM (1 μg/ml), or OVA (10 μg/ml) and was measured after 48 and 72 h of stimulation (n = 4 mice). (C) Representative dot plots of CTV staining according to GFP expression in 2D2 CD4+ T cells stimulated in vitro for 72 h with MOG35–55- or NFM-loaded APCs. (D) GFP expression compared with activation marker expression against the number of cell divisions in 2D2 CD4+ T cells (n = 4 mice). (E) Naïve 2D2-Eomes-GFP CD45.1+ cells were injected into Eomes-GFP CD45.2 recipient mice prior to immunization with MOG35–55 peptide in CFA. (F) Representative dot plots of CD4 versus GFP (left) and percentages of GFP-expressing cells (right) gated on CD44high CD45.1+ and CD44hi CD45.2+ CD4+ T cells, in dLN and spleen (SPL) of immunized mice at 8 dpi (n = 5 mice). (G and H) Expression of (G) Ki67, activation markers, and (H) migratory markers in CD44high CD45.1+ and CD44hi CD45.2+ CD4+ T cells in the spleen at 8 dpi (n = 5 mice). (I) Percentages of GFP+ cells were analyzed in CD44hi CD45.1+ and CD44hi CD45.2+ CD4+ T cells at 14 dpi in dLN, spleen, brain, and spinal cord (n = 6 mice per group, and for SC, cells were pooled to have three independent samples). (J) Percentage of GFP+ cells was analyzed in CD44high CD4+ T cells in a model of active EAE at 14 dpi in dLN, spleen, brain, and SC (n = 8 mice). (K) Intracellular expression of IFN-γ, IL-10, IL-17, and IFN-γ/IL-17 was assessed in Eomes-GFP and Eomes-GFP+ cells from the brain after an overnight restimulation with 10 µg/ml of MOG35–55 peptide (n = 6 mice). Data are representative of at least two independent experiments. Error bars = SEM; P values for B and F–J (two-way ANOVA with Bonferroni correction), P values in K (Mann–Whitney U test)—****P < 0.0001, ***P < 0.001, **P < 0.01, and *P < 0.05. See also Fig. S2.
Figure S2.
Figure S2.
Eomes expression is induced in a TCR/CD28-dependent manner proportionally to signal strength and duration and Eomes+ CD4+ T cells accumulate in the CNS over the course of inflammation. (A) GFP expression in CTV-labeled Eomes-GFP CD4+ T cells stimulated for 48 h with 1 µg/ml of anti-CD28 and increasing doses of anti-CD3 mAb. (B) Same as A but with 0.5 µg/ml of anti-CD3 and increasing doses of anti-CD28 mAb (n = 5 mice). (C) GFP expression in Eomes-GFP CD4+ T cells stimulated for 24, 48, and 72 h with 2 µg/ml of anti-CD3 and 1 µg/ml of anti-CD28 mAbs (n = 3 mice). (D) GFP expression compared to activation marker expression against number of cell divisions in CD4+ T cells was assessed in Eomes-GFP CD4+ T cells stimulated in vitro for 48 h (n = 5 mice). (E) Representative gating strategy showing GFP expression in CD45.1+ and CD45.2+ compartment in the brain of WT C57BL/6J recipients transferred with 2D2-Eomes-TWT cells. (F) Ki67 and activation marker expressions were analyzed in GFP and GFP+ CD45.1+ or CD45.2+ CD44high CD4+ T cell compartments in the brain at 14 dpi (n = 6 mice). (G) CD107a expression was assessed in Eomes-GFP and Eomes-GFP+ CD44high CD4+ T cells from the brain at 14 dpi upon active immunization of Eomes-GFP mice and restimulation ex vivo overnight with 10 µg/ml of MOG35–55 peptide (n = 6 mice). (H) Percentage of injected cells in NI mice in blood, spleen, dLN, and cLN 8 dpi (n = 4 mice). (I and J) Percentage and absolute number of 2D2 injected cells were analyzed at 5, 8, and 14 dpi (n = 5, 6, and 6 mice, respectively) in (I) cLN and (J) blood. (K and L) Proliferation rates were assessed at (K) 5 dpi or (L) 8 and 14 dpi in spleen (SPL), dLN, brain, cLN, and blood of immunized mice. Data are representative of two independent experiments. Error bars = SEM; P values in G (Mann–Whitney U test) and other P values (two-way ANOVA with Bonferroni correction)—****P < 0.0001, ***P < 0.001, **P < 0.01, *P < 0.05.
Figure 3.
Figure 3.
Eomes drives the survival of effector CD4+ T cells both in vitro and in vivo during neuroinflammation. (A) Naïve CTV-labeled 2D2-Eomes-TWT CD45.1+ and 2D2-Eomes-TKO CD45.1/2+ cells were coinjected at a 1:1 ratio into C57BL/6J mice subsequently immunized with MOG35–55 peptide in CFA. Representative gating strategy is shown. (B and C) (B) Percentage and (C) absolute number of 2D2-Eomes-TWT CD45.1+ and 2D2-Eomes-TKO CD45.1/2+ among total injected cells in dLN, spleen, and brain at 5, 8, and 14 dpi (n = 5, 6, and 6 mice per timing, respectively). (D) Eomes expression in Eomes-TWT and Eomes-TKO CD4+ T cells stimulated in vitro with anti-CD3 and anti-CD28 mAbs. (E and F) (E) Proliferation and (F) survival of naïve Eomes-TWT or Eomes-TKO CD4+ T cells stimulated in vitro with anti-CD3 and anti-CD28 mAbs for 24, 48, 72, and 96 h (n = 3 and 4 mice/group). (G) Frequency of viable CD44high Eomes-TWT or Eomes-TKO CD4+ T cells stimulated in vitro as in F (n = 4 and 3 mice/group). (H) Frequency of viable Eomes-TWT or Eomes-TKO CD4+ T cells according to cell division upon in vitro stimulation as in F (n = 4 and 3 mice/group). Data are representative of at least two independent experiments. Error bars = SEM; P values (two-way ANOVA with Bonferroni correction)—****P < 0.0001, ***P < 0.001, **P < 0.01, *P < 0.05. See also Fig. S2.
Figure S3.
Figure S3.
Multi-omics data analysis uncovers a direct role for Eomes in the regulation of metabolism-associated genes and mitochondrial transcriptional modulators. (A and B) Heatmap of differentially expressed genes between Eomes-TKO and Eomes-TWT CD4+ T cells (A) before (T0) or (B) after stimulation in vitro for 12 h (T12) (n = 3 mice/group). (C) Heatmap of genes involved in mitochondrion organization in Eomes-TKO and Eomes-TWT CD4+ T cells stimulated with anti-CD3 and anti-CD28 mAbs for 24 h. (D) Correlation matrix of Eomes-GFP+ (n = 3) and Eomes-TKO (n = 2) ATAC-seq data. (E) Random and observed genomic distribution of Eomes-GFP+ DARs at the indicated genomic regions. (F) Motif enrichment analyses of Eomes-GFP+ (left) and Eomes-TKO (right) DARs using Homer. (G) Peak density heatmap of Eomes CUT&RUN signal from Eomes-GFP+ (left) and Eomes-TKO CD4+ T cells (right) in the region of 4 kb surrounding Eomes-GFP+ DARs centers determined by ATAC-seq. (H) Peak density heatmap of Eomes CUT&RUN signal from Eomes-GFP+ CD4+ T cells at enhancer, promoter, or shuffle regions (top). Random and observed genomic distribution of Eomes signals as determined by CUT&RUN (bottom). (I) Pathway enrichment analyses of the 88 genes nearest to regions of Eomes footprint (TOBIAS) overlapping regions of Eomes fixation (CUT&RUN) and Eomes-GFP+ DARs (ATAC-seq).
Figure 4.
Figure 4.
Eomes transcriptional program mainly impacts genes related to mitochondrial structure and functions. RNA-seq was performed on Eomes-TKO and Eomes-TWT CD4+ T cells stimulated in vitro at 0 (T0), 12 h (T12) or 24 h (T24) (n = 3, 4, and 4 mice/group, respectively). (A) Number of differentially expressed genes between Eomes-TKO and Eomes-TWT CD4+ T cells at T0, T12, and T24. (B) Representation of differentially expressed pathways at T24 (normalized enrichment score [NES] > 2 or NES less than −2) with pathways in red related to mitochondria metabolism. (C and D) (C) GSEA and (D) heatmap of genes involved in OXPHOS showing the (clustered) genes in the leading-edge subsets. (E) GSEA related to genes involved in mitochondria organization in Eomes-TKO and Eomes-TWT CD4+ T cells stimulated with anti-CD3 and anti-CD28 mAbs for 24 h. See also Fig. S3.
Figure 5.
Figure 5.
Eomes favors chromatin accessibility and directly binds to enhancer regions of genes involved in metabolic regulation. (A) Number and percentage of DARs using genome-wide analysis of chromatin accessibility of Eomes-GFP+ (green) and Eomes-TKO CD4+ T cells (gray) as determined by DESeq2 algorithm (FC > 1.5 and Padj < 0.01; n = 3/genotype). (B) Relative enrichment of Eomes-GFP+ DARs at the indicated genomic regions compared with random distribution. (C) Example of track view of the Ifng locus showing ATAC-seq results for Eomes-GFP+ (green track) and Eomes-TKO CD4+ T cells (gray track), with regions of differential accessibility (DESeq2) depicted in pink. (D) Peak density heatmap of ATAC-seq signal obtained from Eomes-GFP+ (Eomes-GFP+ DARs) or Eomes-TKO CD4+ T cells (Eomes-TKO DARs) in regions of 4 kb surrounding peak centers. Motif enrichment analyses associated with Eomes-GFP+ DARs are shown as determined using the Homer algorithm (bottom). (E) Pathway enrichment analysis of genes nearest to Eomes-GFP+ DARs identified by ATAC-seq (GREAT). (F) Number and percentage of genes nearest to Eomes-GFP+ DARs (green) and Eomes-TKO DARs (gray) identified by ATAC-seq within a 250 kb distance from transcription start site (GREAT). (G) Volcano plot of DARs and nearest genes, with Eomes-GFP+ DARs (green dots), Eomes-TKO DARs (dark gray dots), and unchanged (light gray dots) as determined by DESeq2 algorithm. (H) Relative enrichment of Eomes CUT&RUN signal at the indicated genomic elements compare to random distribution. (I) Average plot of Eomes CUT&RUN profiles comparing Eomes binding at Eomes-GFP+ DARs to random regions. (J) Example of aggregated footprint profile of Eomes motif identified by TOBIAS (left) and enrichment plot of Eomes footprint as detected in region of Eomes binding (CUT&RUN) overlapping Eomes-GFP+ DARs or shuffle regions. (K) Venn diagram showing the overlap between regions of Eomes footprint detection (TOBIAS) within regions of Eomes fixation (CUT&RUN) among regions of open chromatin in Eomes-GFP+ CD4+ T cells (ATAC-seq). P values (Pearson’s chi-square test). Also refer to Fig. S3.
Figure 6.
Figure 6.
Eomes confers increased mitochondrial respiratory capacities of CD4+ T cells and enhanced their survival abilities under stress conditions. (A) Number and volume of mitochondria were determined in Eomes-TKO, Eomes and Eomes+ CD4+ T cells by TOMM20 staining and confocal fluorescence microcopy after anti-CD3 and anti-CD28 mAbs stimulation during 48 h. (B) Mitochondrial cristae architecture was imaged using transmission electron microscopy (TEM) in Eomes-TKO and Eomes+ CD4+ T cells. Scale bars represent 2 µm (left) and 200 nm (right). (C) Mitochondrial membrane potential (ΔΨm) of Eomes-TKO, Eomes, and Eomes+ CD4+ T cells stimulated in vitro for 48 h using MitoFM DeepRed and TMRE stainings (n = 4 mice/group). (D) OCR was assessed in Eomes-TKO, Eomes, and Eomes+ cells stimulated in vitro for 48 h (left). Maximal OCR and SRC were also determined (right) (each point represents an experiment replicate from a pool of three or six mice/group for Eomes-TKO and Eomes-GFP, respectively). (E) ATP synthase expression was determined using confocal fluorescence microcopy. (F and G) (F) ΔΨm and (G) mitochondrial dependency were assessed in 2D2-Eomes and 2D2-Eomes+ CD4+ T cells purified from the brain of immunized mice (n = 6 and 8 mice for F and G, respectively). (H and I) Eomes-TKO and Eomes-TWT CD4+ T cells were stimulated during 48 h with anti-CD3 and anti-CD28 mAbs in presence of either (H) antimycin A and rotenone or (I) sulfasalazine, etoposide, and idarubicin (n = 4 mice/group). Data are a pool of two (E), three (A), or representative of at least two independent experiments. Error bars = SEM; P values in F and G (Mann–Whitney U test), other P values (two-way ANOVA with Bonferroni correction)—****P < 0.0001, ***P < 0.001, **P < 0.01, *P < 0.05. See also Fig. S4.
Figure S4.
Figure S4.
Eomes deletion is associated with disorganization of mitochondrial cristae structure, decreased ATP synthase expression, and enhanced sensitivity to stress-induced cell death. (A) Mitochondrial cristae architecture was imaged and analyzed by TEM in Eomes-TKO and Eomes+ CD4+ T cells. Scale bars represent 2 µm (cell scale) and 200 nm (mitochondria scale). (B) Mitochondrial membrane potential (ΔΨm) was assessed in 2D2-Eomes-TKO, Eomes, and Eomes+ CD4+ T cells stimulated in vitro with 1 µg/ml MOG35–55 loaded-APCs for 48 h using MitoFM DeepRed and TMRE staining (n = 3 and 4 mice/group). (C) Representative images of DAPI (blue), Eomes (pink), and ATP synthase (red) stainings in Eomes-TKO, Eomes, and Eomes+ CD4+ T cells using confocal microscopy after 48 h of in vitro stimulation with anti-CD3 and anti-CD28 mAbs. Scale bars represent 7 µm. (D) MitoFM Deepred and TMRE stainings were analyzed in CD44high CD4+ T cells infiltrating the brain and SC upon active EAE immunization of Eomes-GFP reporter mice (n = 6 mice). (E) Mitochondrial membrane potential (ΔΨm) of 2D2-TWT, 2D2 Eomes-TKO, and 2D2-Tbet-TKO was assessed at 8 dpi in dLN using TMRE (n = 4, 5, and 5 mice, respectively). (F) Eomes-TKO and Eomes-TWT CD4+ T cells were stimulated during 48 h with anti-CD3 and anti-CD28 mAbs followed by 48 h of stimulation in the presence of high doses of etomoxir, and viable cells were identified using viability dye incorporation (n = 3 and 4 mice/group). Data are representative of two independent experiments. Error bars = SEM; P values (Mann–Whitney U test) and P values (two-way ANOVA with Bonferroni correction)—****P < 0.0001, ***P < 0.001, **P < 0.01, *P < 0.05.
Figure S5.
Figure S5.
EOMES expression enhances survival capacity in human CD4+ T cells. (A) Representative histogram plots and frequencies of EOMES expression in naïve (CCR7+CD45RA+), effector (CCR7CD45RA+), central memory (TCM; CCR7+CD45RA), or effector memory (TEM; CCR7CD45RA) CD8+ T cells from PBMC of HD (n = 18). (B) Representative histogram plot of EOMES expression in naïve (CCR7+CD45RA+), effector (CCR7CD45RA+), central memory (CCR7+CD45RA), or effector memory (CCR7CD45RA) CD4+ T cells from PBMC of HD. (C) Representative dot plot of the gating strategy used to select effector/memory CD4+ T cells from PBMC of HD. (D) Geometric mean fluorescence intensity (gMFI) of HLA-DR expression in EOMES+ and EOMES effector/memory CD4+ T cells from PBMC of HD (n = 13) and MS (n = 13) patients. (E) Representative dot plot of EOMES expression according to CTV dilution of naïve CD4+ T cells purified from PBMC of HD and stimulated for 5, 10, and 15 days with coated anti-CD3 and soluble anti-CD28 mAbs (n = 7). (F) Frequency of viable cells according to cell division of CD4+ T cells from HD (n = 7) stimulated as in E for 20 days by viability dye incorporation. Data are representative of at least two independent experiments. Error bars = SEM; P values (two-way ANOVA with Bonferroni correction)—****P < 0.0001, ***P < 0.001, **P < 0.01, *P < 0.05.
Figure 7.
Figure 7.
EOMES expression is linked with enhanced mitochondrial function and improves survival capacity of human CD4+ T cells from both HD and MS patients. (A) Representative dot plot of EOMES expression in total CD4+ T cells from PBMC of HD. (B) Frequencies of EOMES expression in total CD4+ T cells from HD (n = 13) and MS (n = 13) patients. (C and D) Frequencies of naïve (CCR7+CD45RA+), effector (TEMRA; CCR7CD45RA+), central memory (TCM; CCR7+CD45RA), or effector memory (TEM; CCR7CD45RA) within EOMES and EOMES+ CD4+ T cells from (C) HD (n = 13) or (D) MS (n = 13) patients. (E and F) (E) Intracellular IFN-γ, TNF, IL-17, and (F) IL-10 expression was assessed in EOMES and EOMES+ effector/memory CD4+ T cells from HD (n = 11) and MS (n = 10) donors after PMA/ionomycin stimulation. (G and H) (G) Mitochondrial mass (TOMM20) and mitochondrial membrane potential (MitoFM Deepred) were assessed in EOMES and EOMES+ effector/memory CD4+ T cells from HD (n = 13) and MS (n = 13) patients and (H) the ΔgMFI of MitoFM Deepred staining in EOMES+ versus EOMES was calculated for HD (n = 13) and MS (n = 13) patients. (I and J) (I) Dot plot of EOMES expression according to CTV dilution by CD4+ T cells purified from PBMC of HD (n = 7) and stimulated for 20 days with coated anti-CD3 and soluble anti-CD28 mAbs and (J) frequency of EOMES expression by naïve CD4+ T cells purified from PBMC of HD (n = 7) and stimulated for 5, 10, 15, or 20 days with coated anti-CD3 and soluble anti-CD28 mAbs. (K) Frequency of viable cells in HLA-DR+ CD4+ T cells from HD (n = 7) stimulated as in J for the indicated period by viability dye incorporation. (L) Frequency of viable cells according to cell division in CD4+ T cells from HD (n = 7) stimulated as in J for 15 days by viability dye incorporation. Data are representative of at least two independent experiments. Error bars = SEM; P values (two-way ANOVA with Bonferroni correction)—****P < 0.0001, ***P < 0.001, **P < 0.01, *P < 0.05. See also Fig. S5.

References

    1. Ackermann, A.M., Wang Z., Schug J., Naji A., and Kaestner K.H.. 2016. Integration of ATAC-seq and RNA-seq identifies human alpha cell and beta cell signature genes. Mol. Metab. 5:233–244. 10.1016/j.molmet.2016.01.002 - DOI - PMC - PubMed
    1. Adoue, V., Binet B., Malbec A., Fourquet J., Romagnoli P., van Meerwijk J.P.M., Amigorena S., and Joffre O.P.. 2019. The histone methyltransferase SETDB1 controls T Helper cell lineage integrity by repressing endogenous retroviruses. Immunity. 50:629–644.e8. 10.1016/j.immuni.2019.01.003 - DOI - PubMed
    1. Argüello, R.J., Combes A.J., Char R., Gigan J.P., Baaziz A.I., Bousiquot E., Camosseto V., Samad B., Tsui J., Yan P., et al. . 2020. SCENITH: A flow cytometry-based method to functionally profile energy metabolism with single-cell resolution. Cell Metab. 32:1063–1075.e7. 10.1016/j.cmet.2020.11.007 - DOI - PMC - PubMed
    1. Banerjee, A., Gordon S.M., Intlekofer A.M., Paley M.A., Mooney E.C., Lindsten T., Wherry E.J., and Reiner S.L.. 2010. Cutting edge: The transcription factor eomesodermin enables CD8+ T cells to compete for the memory cell niche. J. Immunol. 185:4988–4992. 10.4049/jimmunol.1002042 - DOI - PMC - PubMed
    1. Bentsen, M., Goymann P., Schultheis H., Klee K., Petrova A., Wiegandt R., Fust A., Preussner J., Kuenne C., Braun T., et al. . 2020. ATAC-seq footprinting unravels kinetics of transcription factor binding during zygotic genome activation. Nat. Commun. 11:4267. 10.1038/s41467-020-18035-1 - DOI - PMC - PubMed

LinkOut - more resources