. 2024 Jan 8;20(1):e1011925.
doi: 10.1371/journal.ppat.1011925. eCollection 2024 Jan.

Modulations in the host cell proteome by the hantavirus nucleocapsid protein

Affiliations

Modulations in the host cell proteome by the hantavirus nucleocapsid protein

Austin Royster et al. PLoS Pathog. .

Abstract

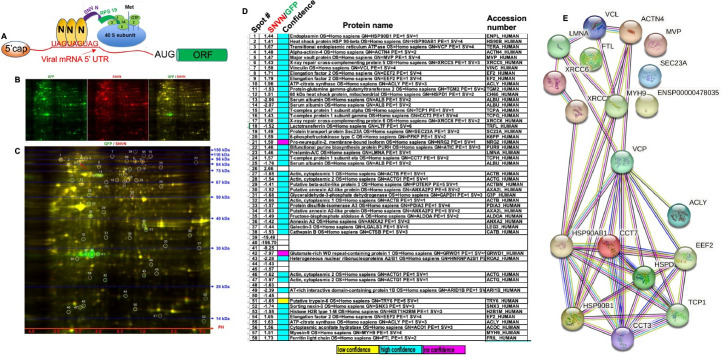
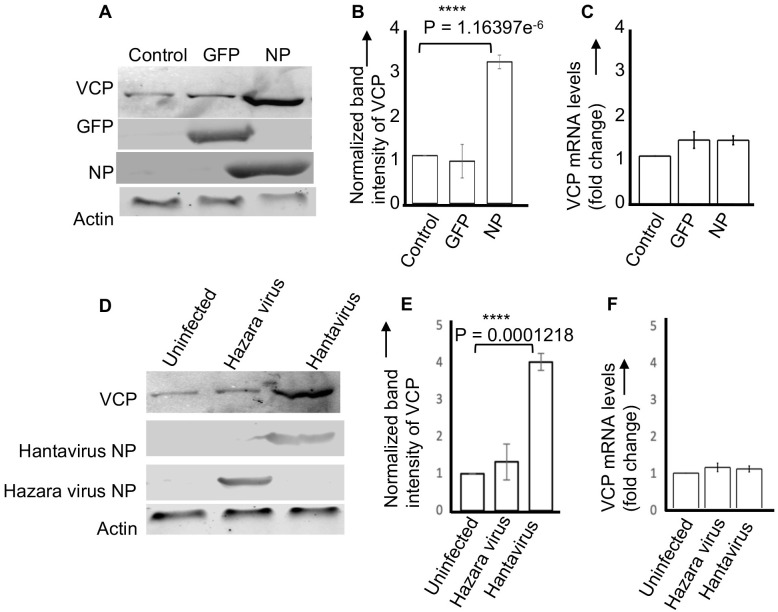
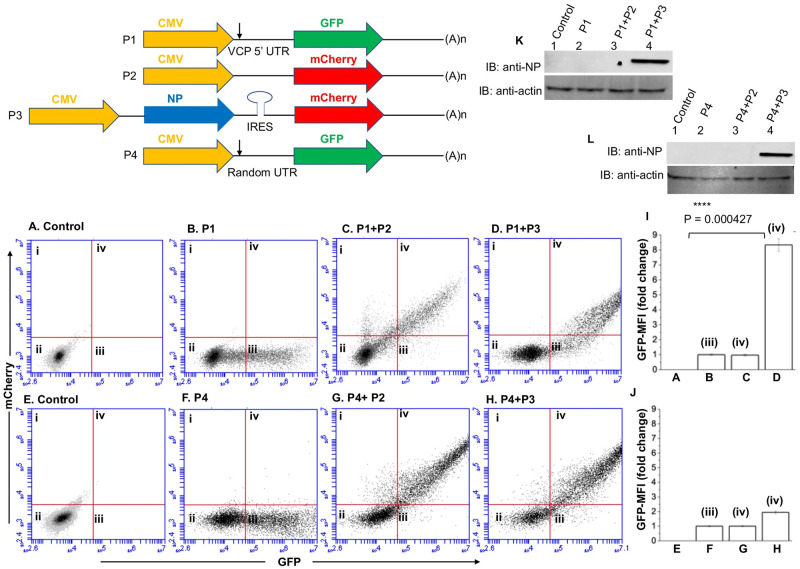
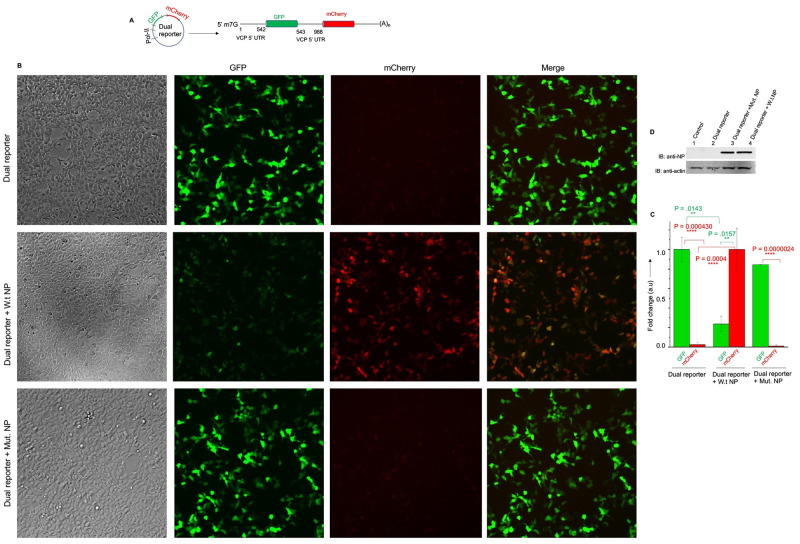
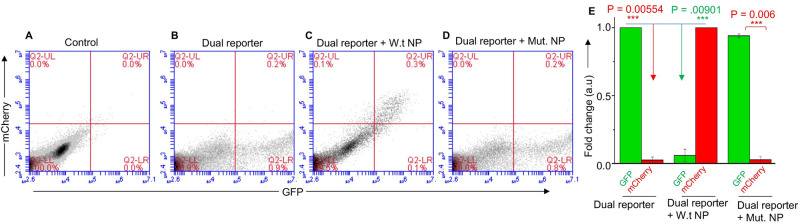
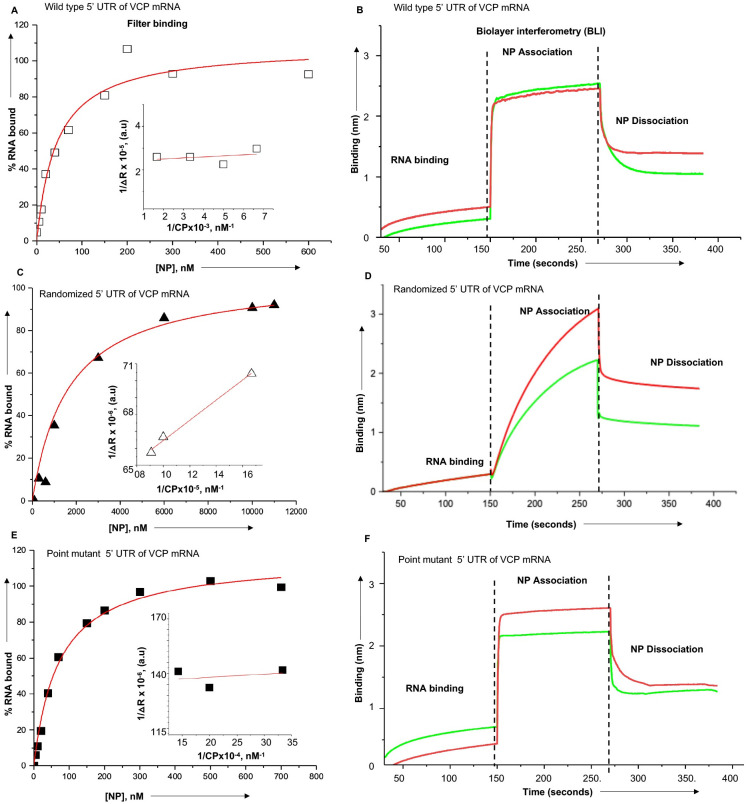
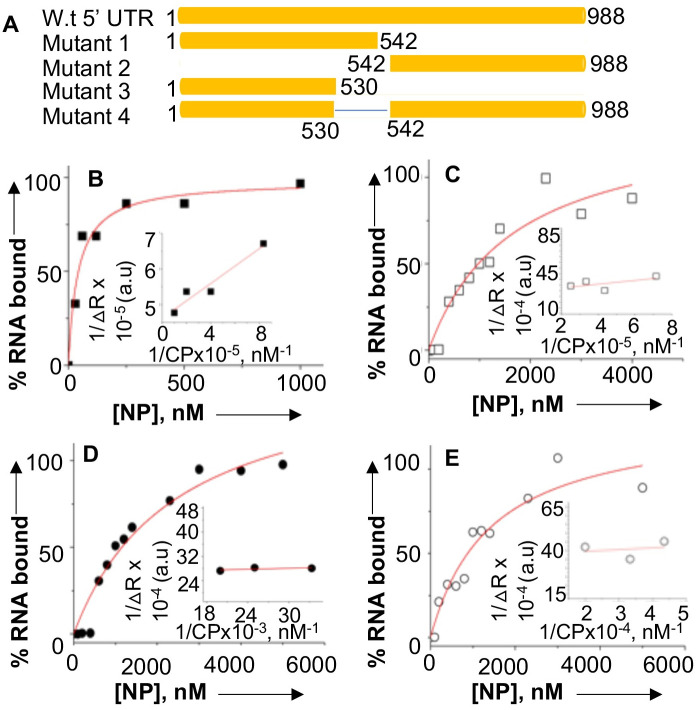
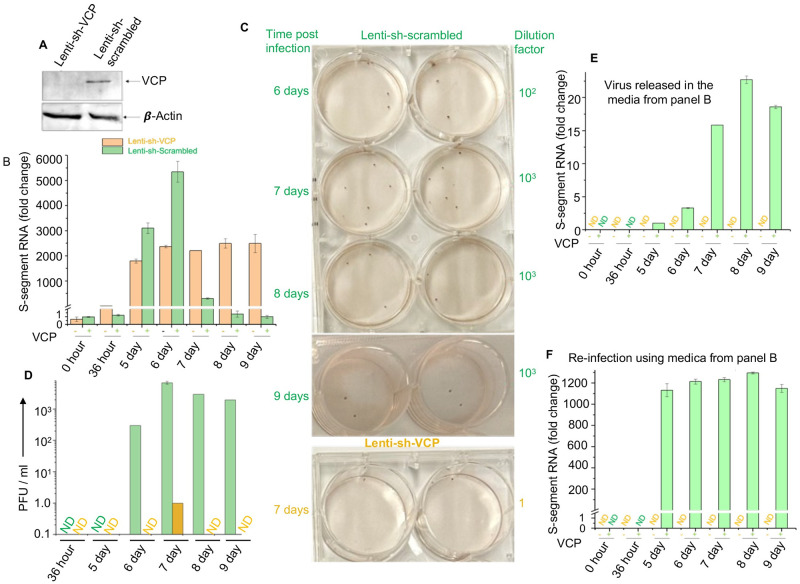
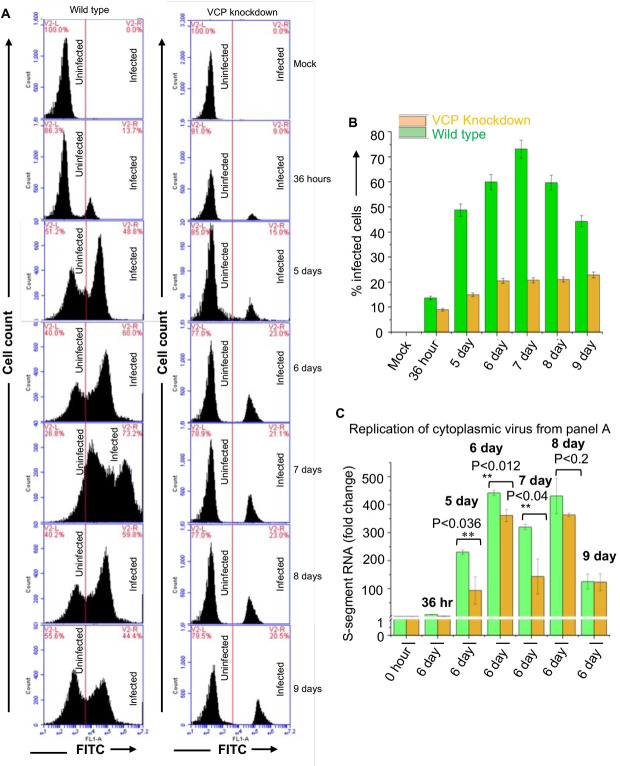
Hantaviruses have evolved a unique translation strategy to boost the translation of viral mRNA in infected cells. Hantavirus nucleocapsid protein (NP) binds to the viral mRNA 5' UTR and the 40S ribosomal subunit via the ribosomal protein S19. NP associated ribosomes are selectively loaded on viral transcripts to boost their translation. Here we demonstrate that NP expression upregulated the steady-state levels of a subset of host cell factors primarily involved in protein processing in the endoplasmic reticulum. Detailed investigation of Valosin-containing protein (VCP/p97), one of the upregulated host factors, in both transfected and virus infected cells revealed that NP with the assistance of VCP mRNA 5' UTR facilitates the translation of downstream VCP ORF. The VCP mRNA contains a 5' UTR of 987 nucleotides harboring six unusual start codons upstream of the correct start codon for VCP which is located at 988th position from the 5' cap. In vitro translation of a GFP reporter transcript harboring the VCP mRNA 5' UTR generated both GFP and a short polypeptide of ~14 KDa by translation initiation from start codon located in the 5' UTR at 542nd position from the 5' cap. The translation initiation from 542nd AUG in the UTR sequence was confirmed in cells using a dual reporter construct expressing mCherry and GFP. The synthesis of 14KDa polypeptide dramatically inhibited the translation of the ORF from the downstream correct start codon at 988th position from the 5' cap. We report that purified NP binds to the VCP mRNA 5' UTR with high affinity and NP binding site is located close to the 542ndAUG. NP binding shuts down the translation of 14KDa polypeptide which then facilitates the translation initiation at the correct AUG codon. Knockdown of VCP generated lower levels of poorly infectious hantavirus particle in the cellular cytoplasm whose egress was dramatically inhibited in human umbilical vein endothelial cells. We demonstrated that VCP binds to the hantavirus glycoprotein Gn before its incorporation into assembled virions and facilitates viral spread to neighboring cells during infection. Our results suggest that ribosome engagement at the 542nd AUG codon in the 5' UTR likely regulates the endogenous steady state levels of VCP in cells. Hantaviruses interrupt this regulatory mechanism to enhance the steady state levels of VCP in virus infected cells. This augmentation facilitates virus replication, supports the transmission of the virus to adjacent cells, and promotes the release of infectious virus particles from the host cell.


Conflict of interest statement

The authors have declared that no competing interests exist.

Figures

Fig 1
Fig 1. Alterations in the host proteome by the co-expression of hantavirus NP.
(A). Model showing the NP-mediated translation initiation mechanism. The nucleocapsid protein is shown by letter “N”. (B). 2D-DIGE analysis of HUVEC lysates expressing either GFP or Sin Nombre virus nucleocapsid protein (SNVN). The cell lysates from GFP and NP expressing cells were labelled with cy3 (green) and cy5(red), respectively. The overlay of cy3 (green) and cy5 (red) images is shown on the right (GFP/SNVN). (C). Zoomed view of the overlay image showing 54 well resolved encircled protein spots. The protein ladder and PH scale are shown. (D). The cy5 (red) and cy3 (green) signals of each protein spot in panel C was calculated and the ratio of the signals was reported in panel D. The spots were excised from the gel and protein identification was carried out by mass spectrometry (see Materials and methods for details). (E). The string analysis of the host factors whose intrinsic protein levels were higher in NP expressing cells. Nodes represent the proteins, and edges represent the protein-protein associations. The associations are meant to be meaningful, indicating that proteins could jointly contribute to a shared function without necessarily meaning that they are physically binding to each other. The known interaction from curated databases (—) and experimentally verified data sets () are shown. The predicted interaction from gene neighborhood (), gene fusions (), and gene co-occurrences () are shown. Other interactions based on textmining (), co-expression () and protein homology () are shown.
Fig 2
Fig 2. NP facilitates the translation of VCP mRNA.
(A) HUVECs in six well plates were infected with lentiviruses expressing either GFP or SNV NP or were uninfected (control). Cell lysates were examined by western blot analysis using appropriate antibodies. (B) The band intensities of VCP in panel A were quantified and normalized related to control. The normalized intensity values from three independent experiments were averaged and plotted in panel B. (C) Quantification of VCP mRNA levels by real time PCR, relative fold changes compared to control are shown. (D) A western blot showing the VCP protein levels in HUVEC lysates, generated from either uninfected cells or cells infected with hazara virus or hantavirus (PHV). (E) The VCP band intensities in panel D were quantified, normalized related to control, and plotted in panel E, as mentioned in panel B. (F) A real time PCR analysis showing the relative VCP mRNA levels in cell lysates from panel D, relative fold changes compared to control are shown. Note: The “P” values were calculated by students t-test.
Fig 3
Fig 3. An examination by flow cytometry to further confirm the NP-mediated translation of reporter mRNA.
The plasmids (P1, P2, P3 and P4) used in this study are shown at the top. For the construction of these palsmids please see Materials and methods. HUVECs in twenty four well plates were transfected with either Plasmid P1 (panel B) or cotransfected with plasmid P1 and P2 (panel C) or Plasmid P1 and P3 (panel D). Panel A shows the mock transfected cells. Cells were examined by flow cytometry 24 hours post-transfection. Mean GFP signal from GFP positive cells in quadrant III (panel B) and both GFP and RFP postive cells from quadrant iv (panels C and D) was calculated. The mean GFP fluorescence value from panels A,B,C and D was normalized relative to panel B and plotted in pannel I. Cells in panels E, F, G and H were transfected and examined similar to panels A,B,C and D, except the plasmid P1 was replaced by the plasmid P4. The quantified GFP signal was analyzed and plotted in panel J as mentioned in panel I. Panles K and L show the western blot analysis of samples from panels A-H, using anti-NP antibody.
Fig 4
Fig 4. NP shuts down the translation initiation from an upstream start codon in the VCP mRNA 5’ UTR.
(A) Pictorial representation of the GFP mRNA—(VCP 5’UTR), generated by fusing the VCP mRNA 5’ UTR to the GFP OFR upstream of the start codon. Shown is the location of start codons in the 5’ UTR of VCP mRNA. The three transcripts: GFP mRNA-(VCP5’UTR) (panel B), GFP mRNA-(random 5’ UTR) (panel C), GFP mRNA-(VCP point mut. 5’ UTR) (panel D) were translated in rabbit reticulocyte lysates and radiolabeled translation products were separated in SDS-PAGE gel. The intensity of bands corresponding to GFP and P14 in lanes 1,2 and 3 (panel B) were quantified and normalized related to the GFP band intensity in lane 1. The normalized intensity values were plotted in (panel B’) on right. Similarly, the intensity of bands corresponding to GFP and P14 in lanes 4, 5 and 6 (panel C) were quantified and normalized related to the GFP band intensity in lane 4. The normalized intensity values were plotted in (panel C’) on right. Same strategy was followed to quantify the band intensities in lanes 7, 8 & 9. The intensities were normalized related to the GFP band intensity in lane 7 and plotted in (panel D’)
Fig 5
Fig 5. Translation of bi-cistronic mRNA in cells analyzed by fluorescence microscopy.
(A) The dual reporter construct expressing the bi-cistronic mRNA from the pol-II promoter. (B). Fluorescence microscopy of cells transfected with dual reporter construct along with another construct expressing either wild type NP or NP mutant lacking the RNA binding domain. (C) The GFP and mCherry signal in cells from panel B was quantified. The quantified GFP signal was normalized related to control transfected with dual reporter construct alone. The mCherry Signal was normalized related the cells co-transfected with dual reporter construct and wild type NP expression construct. (D). Western blot analysis of cell lysates from panel (B) using anti-NP antibody. Control (lane 1) represents the untransfected cells. Note: NP mutant is 5KDa smaller in size compared to W.t NP, this small difference in Molecular weight is not noticeable in the 10% acrylamide gel.
Fig 6
Fig 6. Translation of bi-cistronic mRNA in cells analyzed by flowcytometry.
Flow cytometric analysis showing GFP and mCherry expression in HUVECs transfected with dual reporter construct (B) along another plasmid expressing either wild type NP (C) or mutant NP (D). The mean GFP and mCherry fluorescence signal in panels B, C and D was recorded and normalized as mentioned in Fig 5C. The normalized signal was plotted in panel (E). The control is shown in panel (A).
Fig 7
Fig 7. Binding of NP with wild type and mutant sequences of VCP mRNA 5’ UTR using filter binding analysis and biolayer interferometry.
Representative binding profiles for the interaction of NP with the wild type sequence of VCP mRNA 5’ UTR (panels A & B), randomized sequence of VCP mRNA 5’ UTR (panels C&D) and point mutant of VCP mRNA 5’ UTR (E&F). Binding profiles generated by filter binding analysis and biolayer interferometry are shown on the left side and right side, respectively. The binding profiles were generated as discussed in materials and methods. The red and blue lines in binding profiles generated by biolayer interferometry (B, D & F) represent the binding analysis carried out at two different concentrations of NP.
Fig 8
Fig 8. Binding profiles for the interaction of NP with the mutant sequences of VCP mRNA 5’ UTR using filter binding approach.
(A) Pictorial representation of the VCP mRNA 5’ UTR and its mutants. Shown are the representative binding profiles for the interaction of NP with the mutant 1 (B), mutant 2 (C), mutant 3 (D) and mutant 4 (E) in the RNA binding buffer at 80 mM NaCl. The binding profiles were generated using filter binding analysis, as mentioned in materials and methods.
Fig 9
Fig 9. VCP regulates the egress of hantavirus particles from HUVECs.
(A) Western blot showing the knockdown of VCP in HUVECs transduced with lentivirus expressing either scrambled shRNA or shRNA specific to VCP. (B) HUVECs transduced with lentivirus expressing either scrambled shRNA (brown) or VCP specific shRNA (green) were infected with PHV 24 hours post-transduction. Both cells and media were harvested at increasing time points post-PHV infection and viral S-segment RNA was quantified in harvested cells by real time PCR. (C) Viral titers in the harvested media were determined by the chemiluminescence plaque assay, as described in materials and methods. Media from each day post-infection was analyzed in duplicates as shown. (D) The foci from panel C were used to calculate PFU/ml, which was then plotted verses the corresponding day post-infection. (E) Quantification of viral S-segment RNA in the harvested media from panel B. The virus released in the media was concentrated by sucrose cushion before real time PCR was performed (see methods for details). (F) Using the data from panel E equal amount of virus released in the harvested media was added to fresh HUVECs, and cells were harvested 6 days post infection. Viral load was determined by real time PCR as mentioned above.
Fig 10
Fig 10. FACS analysis of PHV infected wild type and VCP knockdown HUVECs.
(A) Wild type and VCP knockdown HUVECs were infected with PHV at an MOI of 0.1, Cells were harvested at increasing time points post infection and examined by FACS analysis using monoclonal ant-NP antibody and a secondary antibody conjugated with FITC, as described in materials and methods. (B) Number of percent infected cells from panel A were plotted verses the corresponding time point post post-infection. (C) Wild type and VCP knockdown HUVECs were infected with PHV as mentioned above. Infected cells were harvested at increasing time points post infection. The cytoplasmic virus obtained from wildtype (green bars) and VCP knockdown (Brown bars) harvested cells was used to re-infect fresh wild type HUVECs, followed by the examination of virus replication by real time PCR 6 days post-infection, as described in materials and methods.
Fig 11
Fig 11. Chemical inhibition of VCP inhibits PHV replication in cells.
Cytotoxicity of DBeQ (A), CB5083 (B) and NMS-873 (C) in HUVECs. The CC50 values are shown. (D) PHV infected HUVECs were incubated with either DBeQ (300 nM), or CB5083 (100 nM) or NMS-873 (100 nM) or with vehicle (DMSO) for 6 days post infection. Media from treated cells was harvested and examined by chemiluminescence plaque assay. Shown are the plaques developed in cells 6 days post-infection by the harvested media, using chemiluminescence plaque assay. (E) The foci in panel D were used to calculate the viral titers (PFU/ml) and plotted verses the corresponding treatment. (F) HUVECs either mock infected or infected with PHV were lysed and the resulting lysates were immunoprecipitated (IP) with either anti-VCP antibody or with IgG as control. The immunoprecipitated material was examined by western blot (IB) analysis using appropriate antibody, as shown. (G) The lysate from panel F was immunoprecipitated using anti-Gn antibody and the immunoprecipitated material was examined by western blot (IB) analysis using either anti-Gn or anti-VCP antibody, as shown.

Similar articles

Cited by

References

    1. Vaheri A, Strandin T, Hepojoki J, Sironen T, Henttonen H, Makela S, Mustonen J. Uncovering the mysteries of hantavirus infections. Nat Rev Microbiol. 2013. 11:539–50. doi: 10.1038/nrmicro3066 - DOI - PubMed
    1. Khaiboullina SF, Morzunov SP, St Jeor SC. Hantaviruses: molecular biology, evolution and pathogenesis. Curr Mol Med. 2005. 5:773–90. doi: 10.2174/156652405774962317 - DOI - PubMed
    1. Martinez VP, Bellomo C, San Juan J, Pinna D, Forlenza R, Elder M, Padula PJ. Person-to-person transmission of Andes virus. Emerg Infect Dis. 2005. 11:1848–53. doi: 10.3201/eid1112.050501 - DOI - PMC - PubMed
    1. Bi Z, Formenty PB, Roth CE. Hantavirus infection: a review and global update. J Infect Dev Ctries. 2008. 2:3–23. doi: 10.3855/jidc.317 - DOI - PubMed
    1. Lv L, Zhang L. Host proviral and antiviral factors for SARS-CoV-2. Virus Genes. 2021. 57:475–488. doi: 10.1007/s11262-021-01869-2 - DOI - PMC - PubMed