. 2024 Jan 23;121(4):e2309881120.
doi: 10.1073/pnas.2309881120. Epub 2024 Jan 8.

Extreme drought impacts have been underestimated in grasslands and shrublands globally

Melinda D Smith #  1   2 Kate D Wilkins #  3 Martin C Holdrege  4 Peter Wilfahrt  5 Scott L Collins  6 Alan K Knapp  1   2 Osvaldo E Sala  7 Jeffrey S Dukes  8 Richard P Phillips  9 Laura Yahdjian  10 Laureano A Gherardi  11 Timothy Ohlert  1 Claus Beier  12 Lauchlan H Fraser  13 Anke Jentsch  14 Michael E Loik  15 Fernando T Maestre  16   17 Sally A Power  18 Qiang Yu  19 Andrew J Felton  20 Seth M Munson  21 Yiqi Luo  22 Hamed Abdoli  23 Mehdi Abedi  23 Concepción L Alados  24 Juan Alberti  25 Moshe Alon  26 Hui An  27 Brian Anacker  28 Maggie Anderson  5 Harald Auge  29   30 Seton Bachle  31   32 Khadijeh Bahalkeh  23 Michael Bahn  33 Amgaa Batbaatar  34   35 Taryn Bauerle  22 Karen H Beard  4 Kai Behn  36 Ilka Beil  37 Lucio Biancari  10 Irmgard Blindow  38 Viviana Florencia Bondaruk  10 Elizabeth T Borer  5 Edward W Bork  35 Carlos Martin Bruschetti  25 Kerry M Byrne  39 James F Cahill Jr  34 Dianela A Calvo  40 Michele Carbognani  41 Augusto Cardoni  25 Cameron N Carlyle  35 Miguel Castillo-Garcia  24 Scott X Chang  42 Jeff Chieppa  18 Marcus V Cianciaruso  43 Ofer Cohen  26 Amanda L Cordeiro  44 Daniela F Cusack  44 Sven Dahlke  38 Pedro Daleo  25 Carla M D'Antonio  45 Lee H Dietterich  44   46 Tim S Doherty  47 Maren Dubbert  48 Anne Ebeling  49 Nico Eisenhauer  30   50 Felícia M Fischer  50   51 T'ai G W Forte  41 Tobias Gebauer  52 Beatriz Gozalo  17 Aaron C Greenville  47 Karlo G Guidoni-Martins  43 Heather J Hannusch  53 Siri Vatsø Haugum  54 Yann Hautier  55 Mariet Hefting  55 Hugh A L Henry  56 Daniela Hoss  30   50   57 Johannes Ingrisch  33 Oscar Iribarne  25 Forest Isbell  5 Yari Johnson  58 Samuel Jordan  7 Eugene F Kelly  59 Kaitlin Kimmel  60 Juergen Kreyling  37 György Kröel-Dulay  61 Alicia Kröpfl  62 Angelika Kübert  63 Andrew Kulmatiski  4 Eric G Lamb  64 Klaus Steenberg Larsen  12 Julie Larson  65 Jason Lawson  66 Cintia V Leder  40 Anja Linstädter  67 Jielin Liu  68 Shirong Liu  69 Alexandra G Lodge  53 Grisel Longo  70 Alejandro Loydi  71 Junwei Luan  72 Frederick Curtis Lubbe  73 Craig Macfarlane  74 Kathleen Mackie-Haas  75 Andrey V Malyshev  37 Adrián Maturano-Ruiz  17 Thomas Merchant  76 Daniel B Metcalfe  77 Akira S Mori  78   79 Edwin Mudongo  80 Gregory S Newman  81 Uffe N Nielsen  18 Dale Nimmo  82 Yujie Niu  14 Paola Nobre  43 Rory C O'Connor  65 Romà Ogaya  83   84 Gastón R Oñatibia  10 Ildikó Orbán  61   67 Brooke Osborne  85 Rafael Otfinowski  86 Meelis Pärtel  87 Josep Penuelas  83   84 Pablo L Peri  88 Guadalupe Peter  40 Alessandro Petraglia  41 Catherine Picon-Cochard  89 Valério D Pillar  57 Juan Manuel Piñeiro-Guerra  10   90 Laura W Ploughe  91 Robert M Plowes  66 Cristy Portales-Reyes  92 Suzanne M Prober  74 Yolanda Pueyo  24 Sasha C Reed  93 Euan G Ritchie  94 Dana Aylén Rodríguez  71 William E Rogers  53 Christiane Roscher  30   95 Ana M Sánchez  96 Bráulio A Santos  97 María Cecilia Scarfó  71 Eric W Seabloom  5 Baoku Shi  98 Lara Souza  81   99 Andreas Stampfli  75   100   101 Rachel J Standish  100   102 Marcelo Sternberg  26 Wei Sun  98 Marie Sünnemann  30   50 Michelle Tedder  103 Pål Thorvaldsen  104 Dashuan Tian  105 Katja Tielbörger  106 Alejandro Valdecantos  16   17 Liesbeth van den Brink  106 Vigdis Vandvik  54 Mathew R Vankoughnett  107 Liv Guri Velle  108 Changhui Wang  109 Yi Wang  72 Glenda M Wardle  47 Christiane Werner  63 Cunzheng Wei  110 Georg Wiehl  74 Jennifer L Williams  111 Amelia A Wolf  112 Michaela Zeiter  75   100   101 Fawei Zhang  113 Juntao Zhu  105 Ning Zong  105 Xiaoan Zuo  114
Affiliations

Extreme drought impacts have been underestimated in grasslands and shrublands globally

Melinda D Smith et al. Proc Natl Acad Sci U S A. .

Abstract

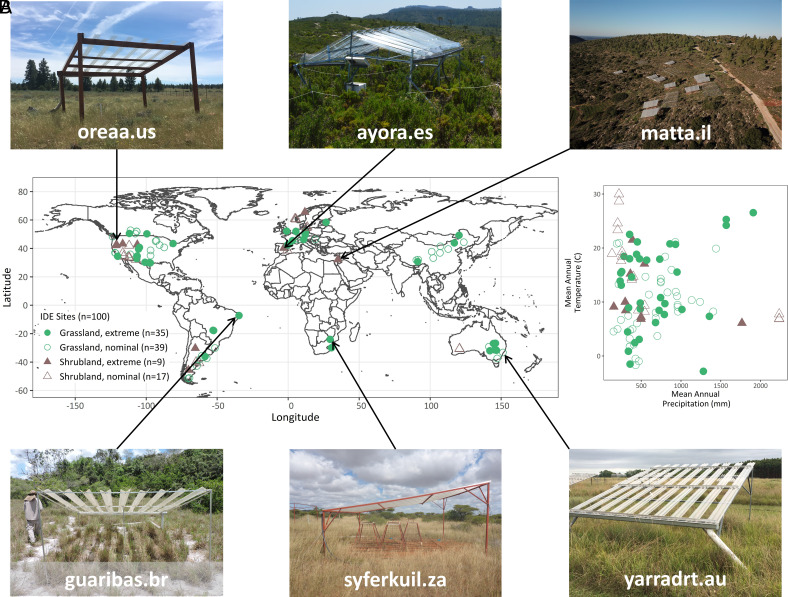
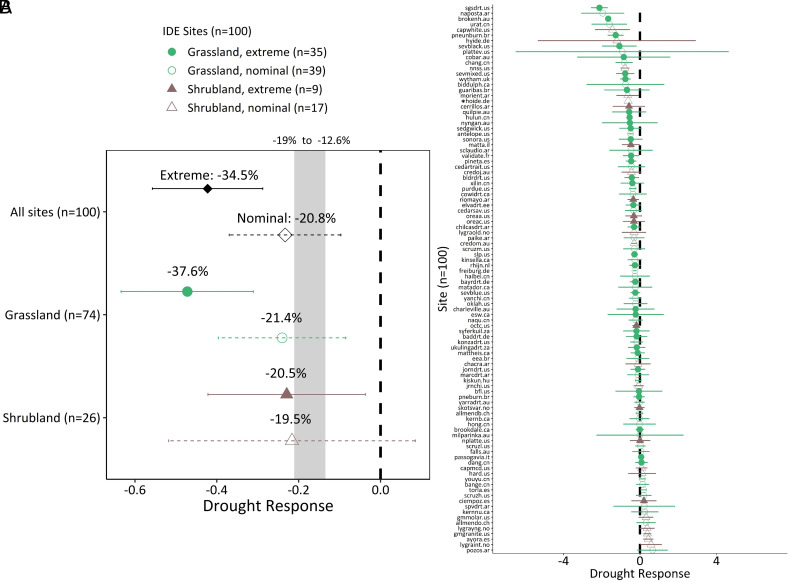
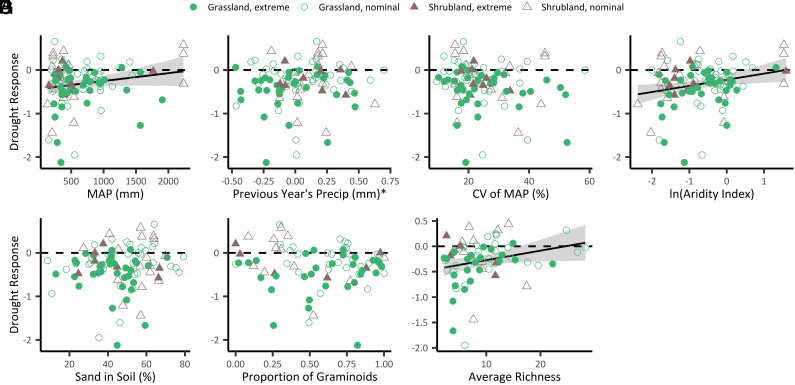
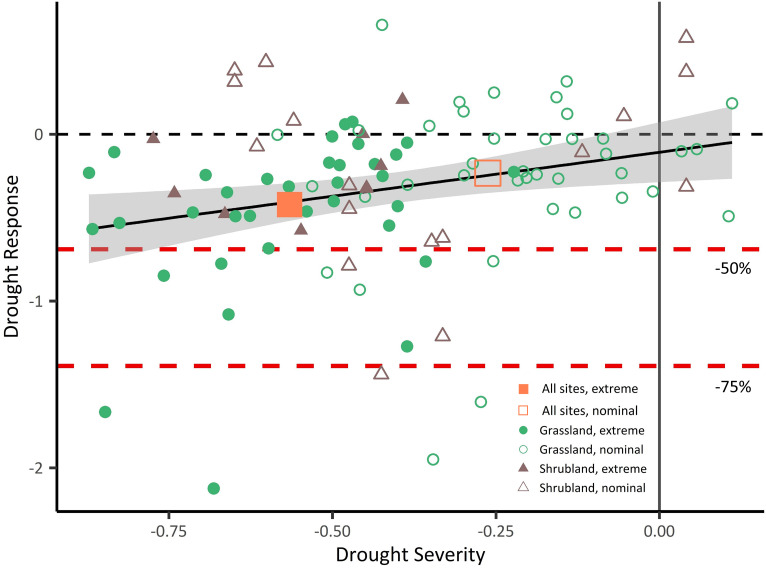
Climate change is increasing the frequency and severity of short-term (~1 y) drought events-the most common duration of drought-globally. Yet the impact of this intensification of drought on ecosystem functioning remains poorly resolved. This is due in part to the widely disparate approaches ecologists have employed to study drought, variation in the severity and duration of drought studied, and differences among ecosystems in vegetation, edaphic and climatic attributes that can mediate drought impacts. To overcome these problems and better identify the factors that modulate drought responses, we used a coordinated distributed experiment to quantify the impact of short-term drought on grassland and shrubland ecosystems. With a standardized approach, we imposed ~a single year of drought at 100 sites on six continents. Here we show that loss of a foundational ecosystem function-aboveground net primary production (ANPP)-was 60% greater at sites that experienced statistically extreme drought (1-in-100-y event) vs. those sites where drought was nominal (historically more common) in magnitude (35% vs. 21%, respectively). This reduction in a key carbon cycle process with a single year of extreme drought greatly exceeds previously reported losses for grasslands and shrublands. Our global experiment also revealed high variability in drought response but that relative reductions in ANPP were greater in drier ecosystems and those with fewer plant species. Overall, our results demonstrate with unprecedented rigor that the global impacts of projected increases in drought severity have been significantly underestimated and that drier and less diverse sites are likely to be most vulnerable to extreme drought.

Keywords: Drought-Net; International Drought Experiment; climate extreme; productivity.


Conflict of interest statement

Competing interests statement:The authors declare no competing interest.

Figures

Fig. 1.
Fig. 1.
Geographic extent and climate space encompassed by the IDE. The 100 grasslands (green circles) and shrublands (brown triangles) included in the analysis spanned six continents (A) and broad gradients of mean annual temperature and MAP (B). Closed symbols denote sites (n = 44) that experienced statistically extreme 1-in-100-y drought (i.e., below average annual precipitation during the experiment year). Open symbols denote IDE sites (n = 56) that experienced nominal (not statistically extreme) drought (i.e., average or above-average annual precipitation during the experiment year). Photos: Shown are drought shelters at representative sites on each continent. Drought shelters were designed to exclude a fixed proportion of each rainfall event from the plots below. The proportion excluded was selected to impose a 1-in-100-y drought for each site during years with average annual precipitation (based on long-term precipitation records, see Materials and Methods for details; see SI Appendix, Table S2 for site codes).
Fig. 2.
Fig. 2.
Response of ANPP to a standardized 1-y drought for 100 IDE sites. (A) Mean drought response for sites that experienced extreme drought or nominal conditions for: all sites, grasslands, and shrublands (SI Appendix, Tables S3 and S4). The gray bar indicates the range of ANPP loss from −19 to −12.6% found in Song et al. and Wang et al. (20, 21), respectively. Drought response is calculated as: ln(average ANPPDROUGHT/average ANPPCONTROL); 0 (black dashed line) represents no effect of drought, and negative numbers indicate less ANPP in drought vs. control plots. (B) Mean drought response for each site ordered from negative (Top) to positive (Bottom). Site codes and corresponding site information are listed in SI Appendix, Table S2. Shown are 95% CIs for mean site-level drought responses. *Indicates site with CI that was omitted for clarity because it exceeds the x axis scale.
Fig. 3.
Fig. 3.
Effect of abiotic and biotic factor on drought response. Relationships between 1-y drought responses across IDE sites and (A) MAP, (B) previous year’s precipitation (relativized by MAP), (C) interannual percent coefficient of variation (CV) of MAP, (D) natural log of the AI, (E) percent sand, (F) average proportion of graminoids, and (G) average richness of plant species. Information on abiotic and biotic characteristics for each site can be found in SI Appendix, Table S5. Model results are summarized in SI Appendix, Table S6. Drought response is calculated as: ln(average ANPPDROUGHT/average ANPPCONTROL); 0 (black dashed line) represents no effect of drought, and negative numbers indicate less ANPP in drought vs. control plots. Lines are shown only for significant relationships. Shaded area represents the 95% CI. *Previous year’s precipitation included the precipitation in the 365 to 730 d preceding the biomass collection date and was relativized by MAP.
Fig. 4.
Fig. 4.
Relationship between drought severity and drought response. A linear mixed effects model found strong evidence for a negative effect of increasing drought severity (becoming more negative) on drought response for 1 y of drought across all sites (intercept = −0.11; slope = 0.53; P = 0.009; adjusted R2 = 0.06). Model results for the effects of drought severity on drought response for extreme and nominal sites are summarized in the Main Text. Shaded area represents the 95% CI. Drought response is calculated as: ln(average ANPPDROUGHT/average ANPPCONTROL). For drought responses, 0 represents no effect of drought, negative numbers indicate less ANPP in drought vs. control plots. Drought severity is calculated as: (PrecipDROUGHT-MAP)/MAP; MAP = mean annual precipitation. Because ambient precipitation during the experiment year determines the severity of the imposed drought, positive drought severity can occur during anomalously wet years when plots beneath drought shelters also experience above average precipitation. The open symbols denote those IDE sites (n = 56) where ambient precipitation was above average, and thus the imposed drought was not statistically extreme (1-in-100 y). Closed symbols denote those sites (n = 44) with average or below average annual precipitation during the experiment year. All of these IDE sites experienced statistically extreme drought. The filled orange square denotes the mean drought response for sites experiencing extreme drought whereas the open orange square is the mean for sites that experienced less severe drought. Note that there was no relationship between drought severity and drought response when only those sites that experienced extreme drought are considered. The red dashed lines provide visual guides for 50% and 75% reductions in ANPP.

References

    1. Slette I. J., et al. , How ecologists define drought, and why we should do better. Global Change Biol. 25, 3193–3200 (2019). - PubMed
    1. Knapp A. K., et al. , Resolving the Dust Bowl paradox of grassland responses to extreme drought. Proc. Natl. Acad. Sci. U.S.A. 117, 22249–22255 (2020). - PMC - PubMed
    1. Breshears D. D., et al. , Rangeland responses to predicted increases in drought extremity. Rangelands 38, 191–196 (2016).
    1. Ullrich P. A., et al. , California’s drought of the future: A midcentury recreation of the exceptional conditions of 2012–2017. Earth’s Future 6, 1568–1587 (2018). - PMC - PubMed
    1. van Dijk A. I. J. M., et al. , The Millennium Drought in southeast Australia (2001–2009): Natural and human causes and implications for water resources, ecosystems, economy, and society. Water Resour. Res. 49, 1040–1057 (2013).

Substances