. 2024 Mar 6;14(3):jkae003.
doi: 10.1093/g3journal/jkae003.

A chromosome-scale assembly for 'd'Anjou' pear

Affiliations

A chromosome-scale assembly for 'd'Anjou' pear

Alan Yocca et al. G3 (Bethesda). .

Abstract

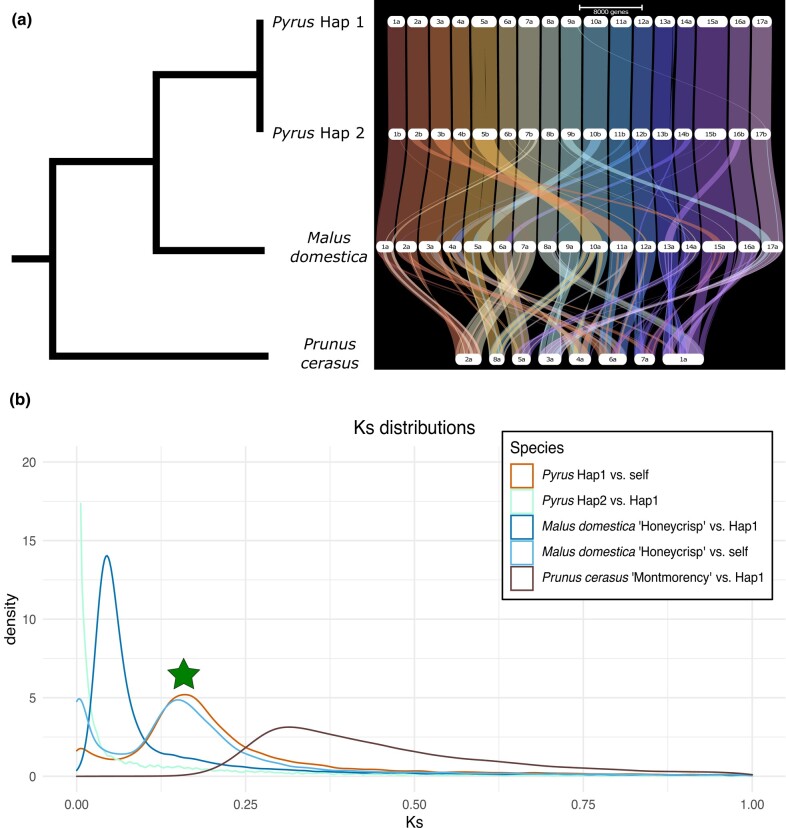
Cultivated pear consists of several Pyrus species with Pyrus communis (European pear) representing a large fraction of worldwide production. As a relatively recently domesticated crop and perennial tree, pear can benefit from genome-assisted breeding. Additionally, comparative genomics within Rosaceae promises greater understanding of evolution within this economically important family. Here, we generate a fully phased chromosome-scale genome assembly of P. communis 'd'Anjou.' Using PacBio HiFi and Dovetail Omni-C reads, the genome is resolved into the expected 17 chromosomes, with each haplotype totaling nearly 540 Megabases and a contig N50 of nearly 14 Mb. Both haplotypes are highly syntenic to each other and to the Malus domestica 'Honeycrisp' apple genome. Nearly 45,000 genes were annotated in each haplotype, over 90% of which have direct RNA-seq expression evidence. We detect signatures of the known whole-genome duplication shared between apple and pear, and we estimate 57% of d'Anjou genes are retained in duplicate derived from this event. This genome highlights the value of generating phased diploid assemblies for recovering the full allelic complement in highly heterozygous crop species.

Keywords: PacBio HiFi; comparative genomics; genome assembly; haplotype phased; whole-genome duplication.


Conflict of interest statement

Conflicts of interest The authors declare no conflict of interest.

Figures

Fig. 1.
Fig. 1.
Pear fruit photographs. Photographs of green Anjou fruit (a) and Red Anjou fruit (b). Photos were provided by USA Pears.
Fig. 2.
Fig. 2.
Chloroplast assemblies and phylogeny. Chloroplast genomes of assorted pear cultivars—assemblies and annotations. Plastid assemblies were carried out using NOVOPlasty v4.4.1 and annotated using GeSeq v2.0.3. Phylogenetic relationships were estimated using maximum likelihood under the generalized time reversible model.
Fig. 3.
Fig. 3.
Distributions of genomic elements. Density of genomic elements across our assembly. Feature densities are calculated in 1 Mb windows with a 100 kb step size. Features on haplotype 1 are listed in a), and those on haplotype 2 are listed in b). Feature distributions are stacked in the order: Genes (bottom distribution), Ty3 TEs (second lowest distribution), Copia TEs (second highest distribution), and other repeat elements annotated by EDTA (highest distribution). Numbers along the x-axis correspond to position along the chromosome (Mb).
Fig. 4.
Fig. 4.
Ribbon plot and Ks distributions. a) A phylogenetic tree with known relationships between 4 assemblies. To the right is a ribbon plot based on gene synteny created with GENESPACE (Lovell et al. 2022). b) A density plot showing the distribution of synonymous substitution rates (Ks) between genome-wide gene pairs. The shared WGD event is denoted by a green star. All comparisons are to P. communis ‘d’Anjou’ haplotype 1 except for the “M. domestica self” comparison. Abbreviations are as follows: Pyrus Hap1, P. communis ‘d’Anjou’ haplotype 1; Pyrus Hap2, P. communis ‘d’Anjou’ haplotype 2.
Fig. 5.
Fig. 5.
Gene expression characterization. Heatmaps and UpSet plot of gene expression. Cladograms represent the relationships between libraries through hierarchical clustering. A total of 1000 genes are displayed that show expression in each tissue and have the highest expression variance. a) Haplotype 1. b) Haplotype 2. c) UpSet plot of expression across tissues for haplotype 1. Genes were considered expressed if they had a TPM value above 1. Note the break in the y-axis.

References

    1. Andrews S, Krueger F, Segonds-Pichon A, Biggins L, Krueger C, Wingett S. FastQC: a quality control tool for high throughput sequence data. http://www.bioinformatics.babraham.ac.uk/projects/fastqc2010.
    1. Bell RL, Itai A. 2011. Pyrus. In: Kole C, editor. Wild Crop Relatives: Genomic and Breeding Resources. Berlin (Germany): Springer-Verlag. p. 147–177.
    1. Bray NL, Pimentel H, Melsted P, Pachter L. 2016. Near-optimal probabilistic RNA-seq quantification. Nat Biotechnol. 34(5):525–527. doi:10.1038/nbt.3519. - DOI - PubMed
    1. Chagné D, Crowhurst RN, Pindo M, Thrimawithana A, Deng C, Ireland H, Fiers M, Dzierzon H, Cestaro A, Fontana P, et al. . 2014. The draft genome sequence of European pear (Pyrus communis L. ‘Bartlett’). PLoS One. 9(4):e92644. doi:10.1371/journal.pone.0092644. - DOI - PMC - PubMed
    1. Cheng H, Concepcion GT, Feng X, Zhang H, Li H. 2021. Haplotype-resolved de novo assembly using phased assembly graphs with hifiasm. Nat Methods. 18(2):170–175. doi:10.1038/s41592-020-01056-5. - DOI - PMC - PubMed

Publication types

LinkOut - more resources