. 2024 Feb 16;30(3):281-297.
doi: 10.1261/rna.079931.123.

CPSF3 inhibition blocks pancreatic cancer cell proliferation through disruption of core histone mRNA processing

Affiliations

CPSF3 inhibition blocks pancreatic cancer cell proliferation through disruption of core histone mRNA processing

Abdulrahman A Alahmari et al. RNA. .

Abstract

Pancreatic ductal adenocarcinoma (PDAC) is a lethal disease with limited effective treatment options, potentiating the importance of uncovering novel drug targets. Here, we target cleavage and polyadenylation specificity factor 3 (CPSF3), the 3' endonuclease that catalyzes mRNA cleavage during polyadenylation and histone mRNA processing. We find that CPSF3 is highly expressed in PDAC and is associated with poor prognosis. CPSF3 knockdown blocks PDAC cell proliferation and colony formation in vitro and tumor growth in vivo. Chemical inhibition of CPSF3 by the small molecule JTE-607 also attenuates PDAC cell proliferation and colony formation, while it has no effect on cell proliferation of nontransformed immortalized control pancreatic cells. Mechanistically, JTE-607 induces transcriptional readthrough in replication-dependent histones, reduces core histone expression, destabilizes chromatin structure, and arrests cells in the S-phase of the cell cycle. Therefore, CPSF3 represents a potential therapeutic target for the treatment of PDAC.

Keywords: CPSF3; JTE-607; alternative polyadenylation; chromatin stability; histone processing.


Figures

FIGURE 1.
FIGURE 1.
CPSF3 is highly expressed in PDAC and is required for PDAC cell proliferation. (A) CPSF3 mRNA expression from CPTAC PDAC patient data. Whiskers indicate minimum and maximum data points. (***) P < 0.0001, ordinary one-way ANOVA with Tukey multiple comparisons test. (B) CPSF3 mRNA expression from PDAC patient data (TCGA) as compared to normal pancreas (GTEx). Whiskers indicate minimum and maximum data points. (***) P < 0.0001, unpaired t-test with Welch's correction. (C) Immunoblot of CPSF3 in immortalized control pancreatic epithelial cells (black) and PDAC cells (red). (D) Kaplan–Meier survival curves of PDAC patients with high (red) and low (blue) CPSF3 mRNA levels. Data were obtained from the CPTAC database. (E) Immunoblot of CPSF3 in shNTC, sh1, and sh2 CPSF3 knockdown cells. (F) Proliferation rates at days 0, 2, 4, and 6 of shNTC (blue), sh1 (orange), and sh2 (green) CPSF3 knockdown cells. (**) P < 0.01, (***) P < 0.001; two-way ANOVA with Dunnett's multiple comparisons test. (G) Mean tumor volume (mm3) of CPSF3 knockdown (orange) and control (blue) MiaPaCa2 tumors. (***) P < 0.001, two-way ANOVA.
FIGURE 2.
FIGURE 2.
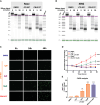
PDAC cell lines are sensitive to CPSF3 inhibition by JTE-607. (A) IC50 of JTE-607 on immortalized control (HPNE and HPDE) and PDAC (MiaPaCa2, Panc1, Suit2, BxPC3) cell lines after 72 h of treatment. (B) IC50 of JTE-607 on human fibroblast C7 and PancPat CAFs after 72 h of treatment. (C) Association between doubling time and IC50 of JTE-607 in pancreatic cell lines. Red denotes PDAC cells while black denotes immortalized control cell lines. R2 = 0.4995. (D, E) Proliferation rates at days 0, 2, 4, and 6 of immortalized control and PDAC cell lines after treatment with escalating concentrations of JTE-607. (*) P < 0.05; two-way ANOVA with Dunnett's multiple comparisons test. Data are shown as mean ± SEM. (F) Clonogenic growth assay of PDAC cell lines after treatment with increasing concentration of JTE-607.
FIGURE 3.
FIGURE 3.
JTE-607 decreases gene expression of RD histones. (A) Heatmap of top differentially expressed genes after 24 h of 10 µM JTE-607 treatment. RD histones are colored in blue. Expression is plotted as transformed expression value. (B) DSeq2 normalized counts of H3F3A and H2AZ1 histone variants (RI) in Panc1 cells treated with 10 µM JTE-607 for 24 h. (**) P < 0.001. (C) mRNA expression of H2B (HIST1H2BC) and H3 (HIST1H3B) in MiaPaCa2 cells treated with JTE-607. (*) P < 0.05, (**) P < 0.01, (***) P < 0.001, ordinary one-way ANOVA with Dunnett's multiple comparisons test. (D, E) Survival analyses of low (blue) and high (red) expression of the RD histone signature (50 genes) in the TCGA-PAAD data set. Signature genes were uploaded to GEPIA2 to assess disease-free (D) and overall survival (E) based on median.
FIGURE 4.
FIGURE 4.
JTE-607 induces RD histone transcriptional readthrough. (A, B) Quantification of RD histone readthrough in Panc1 and HPNE cells after 24 h (A) and 2 h (B) of 10 µM JTE-607 treatment by RT-qPCR. Data were normalized to DMSO controls (dashed horizontal line). (*) P < 0.05, (**) P < 0.01, (***) P < 0.001; two-way ANOVA with Sidak's multiple comparisons test. (C, D) Quantification of RI histone readthrough in Panc1 and HPNE cells after 24 h (C) and 2 h (D) of 10 µM JTE-607 treatment by RT-qPCR. Data were normalized to DMSO controls (dashed horizontal line). (*) P < 0.05, (**) P < 0.01, (***) P < 0.001; two-way ANOVA with Sidak's multiple comparisons test.
FIGURE 5.
FIGURE 5.
JTE-607 induces chromatin instability selectively in PDAC cells. (A) MNase assay of Panc1 cells treated with 10 µM JTE-607 or 1 µM CBL0137. (B) MNase assay of immortalized HPNE control cells treated with the CPSF3 inhibitor JTE-607 (10 µM) or CBL0137 (1 µM). (C) GFP + HeLa-TI cells following 10 µM JTE-607 or 1 µM CBL0137 treatment. (D) Fold change of GFP + HeLa-TI from C. (***) P < 0.0001; two-way ANOVA with Tukey's multiple comparisons test. (E) Flow cytometry analysis of GFP + HeLa-TI cells following 10 µM JTE-607 or 1 µM CBL0137 treatment. Fold change is shown as mean ± SEM of two independent experiments. (**) P < 0.01, (***) P < 0.0001, ordinary one-way ANOVA with Tukey's multiple comparisons test.
FIGURE 6.
FIGURE 6.
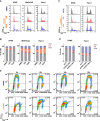
JTE-607 impairs cell cycle progression by inducing S-phase arrest. (A, B) Cell cycle distribution and quantification of HPNE, MiaPaCa2, and Panc1 cell lines treated with 1–10 µM JTE-607. (*) P < 0.05, (**) P < 0.001, (***) P < 0.0001, two-way ANOVA with Dunnett's multiple comparisons test. (C, D) Cell cycle distribution and quantification of HPNE and Panc1 cell lines upon transient CPSF3 knockdown by siRNA after 24 h of transfection. (siCTL) Nontargeting control siRNA. (*) P < 0.01, (**) P < 0.001, two-way ANOVA with Dunnett's multiple comparisons test. Quantification in B and D is the number of cells in the S-phase. (E) BrdU incorporation assay showing cell cycle population upon JTE-607 treatment. The lower left quadrant represents the G1 population. The lower right quadrant represents the G2 population. The top two quadrants represent S-phase populations; early S-phase (left) and late S-phase (right).
Abdulrahman A. Alahmari

References

    1. Abel EV, Goto M, Magnuson B, Abraham S, Ramanathan N, Hotaling E, Alaniz AA, Kumar-Sinha C, Dziubinski ML, Urs S, et al. 2018. HNF1A is a novel oncogene that regulates human pancreatic cancer stem cell properties. Elife 7: 1–35. 10.7554/eLife.33947 - DOI - PMC - PubMed
    1. Armstrong C, Spencer SL. 2021. Replication-dependent histone biosynthesis is coupled to cell-cycle commitment. Proc Natl Acad Sci 118: 1–8. 10.1073/pnas.2100178118 - DOI - PMC - PubMed
    1. Arnadottir GA, Oddsson A, Jensson BO, Gisladottir S, Simon MT, Arnthorsson AO, Katrinardottir H, Fridriksdottir R, Ivarsdottir EV, Jonasdottir A, et al. 2022. Population-level deficit of homozygosity unveils CPSF3 as an intellectual disability syndrome gene. Nat Commun 13: 705. 10.1038/s41467-022-28330-8 - DOI - PMC - PubMed
    1. Asaga T, Ueki M, Chujo K, Taie S. 2008. JTE-607, an inflammatory cytokine synthesis inhibitor, attenuates ischemia/reperfusion-induced renal injury by reducing neutrophil activation in rats. J Biosci Bioeng 106: 22–26. 10.1263/jbb.106.22 - DOI - PubMed
    1. Bailey TL, Johnson J, Grant CE, Noble WS. 2015. The MEME suite. Nucleic Acids Res 43: W39–W49. 10.1093/nar/gkv416 - DOI - PMC - PubMed