. 2024 Jan 8;21(1):13.
doi: 10.1186/s12974-023-03009-z.

The microRNA-211-5p/P2RX7/ERK/GPX4 axis regulates epilepsy-associated neuronal ferroptosis and oxidative stress

Affiliations

The microRNA-211-5p/P2RX7/ERK/GPX4 axis regulates epilepsy-associated neuronal ferroptosis and oxidative stress

Xueying Li et al. J Neuroinflammation. .

Abstract

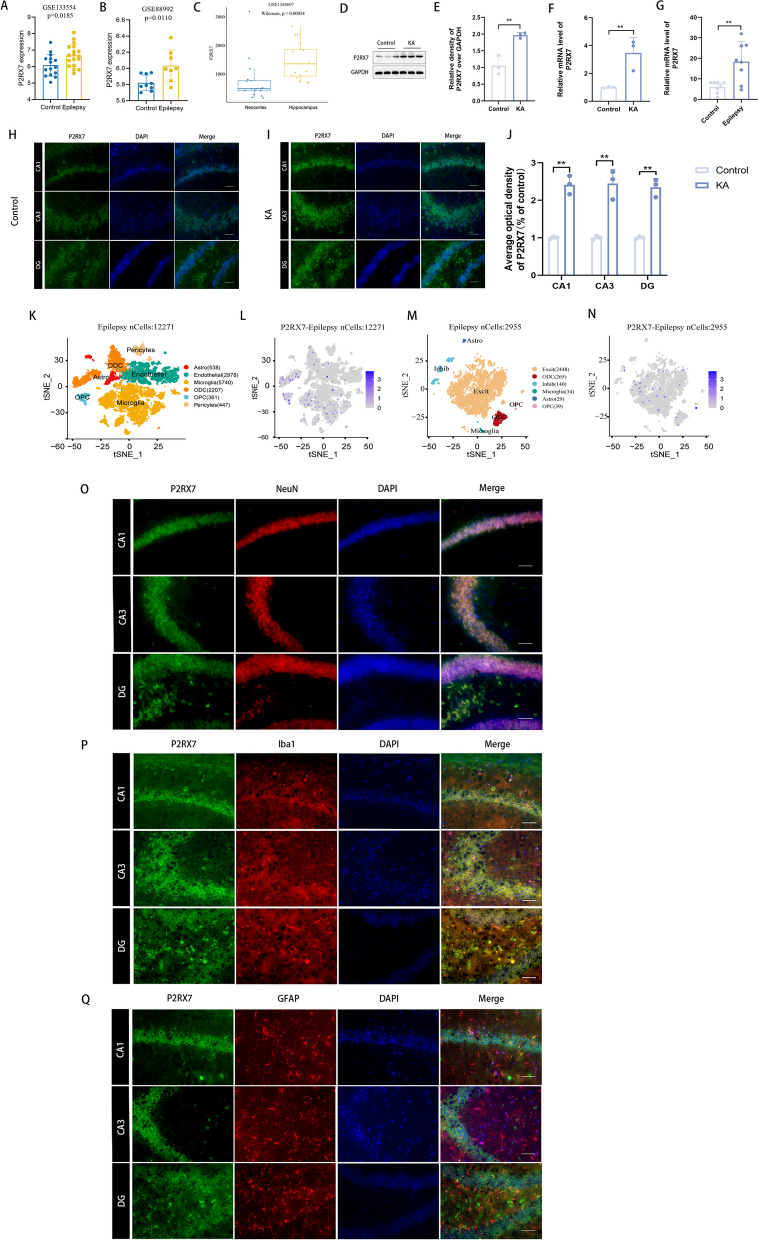
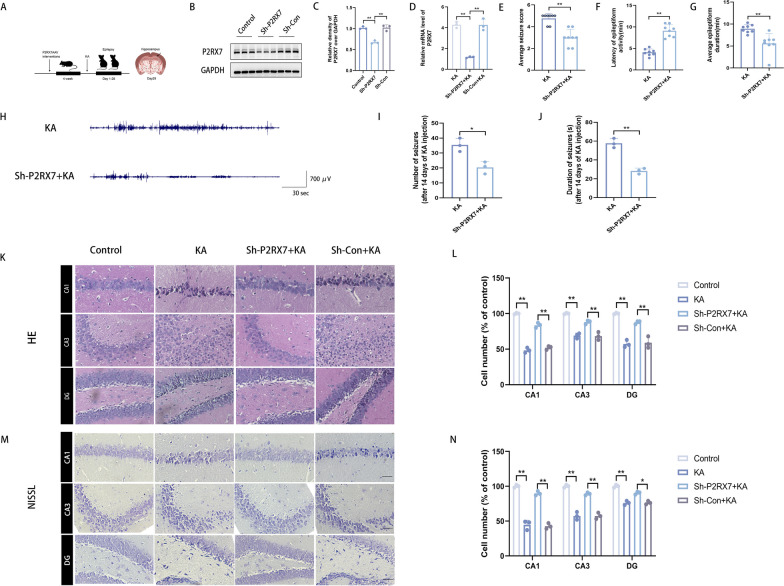
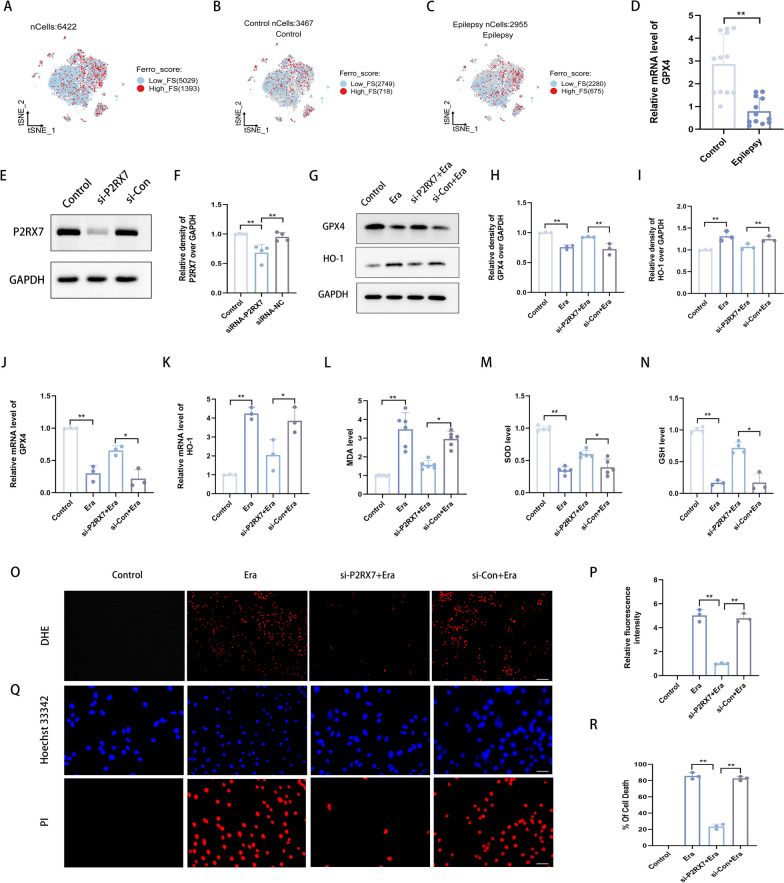
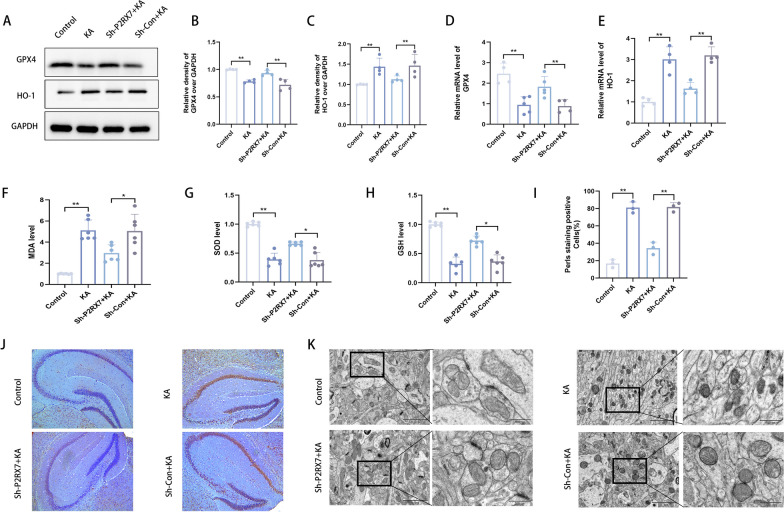
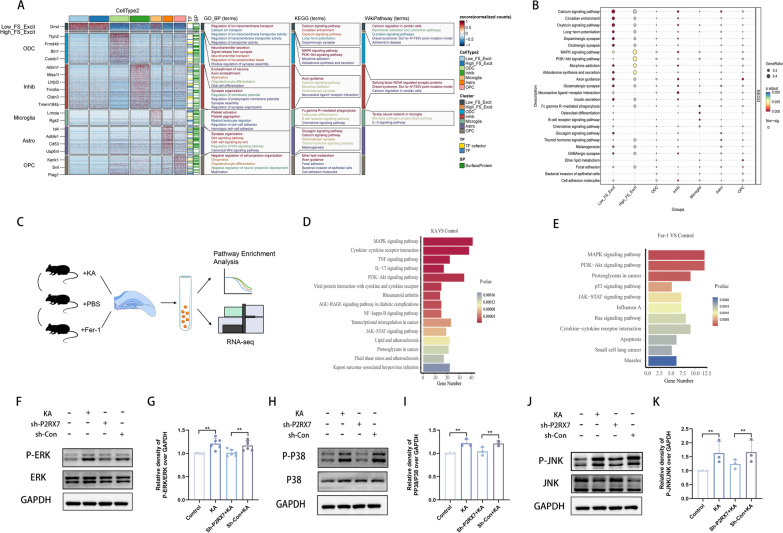
Ferroptosis is an iron-dependent cell death mechanism involving the accumulation of lipid peroxides. As a critical regulator, glutathione peroxidase 4 (GPX4) has been demonstrated to be downregulated in epilepsy. However, the mechanism of ferroptosis in epilepsy remains unclear. In this study, bioinformatics analysis, analysis of epilepsy patient blood samples and cell and mouse experiments revealed strong associations among epilepsy, ferroptosis, microRNA-211-5p and purinergic receptor P2X 7 (P2RX7). P2RX7 is a nonselective ligand-gated homotrimeric cation channel, and its activation mainly increases neuronal activity during epileptic seizures. In our study, the upregulation of P2RX7 in epilepsy was attributed to the downregulation of microRNA (miR)-211-5p. Furthermore, P2RX7 has been found to regulate GPX4/HO-1 by alleviating lipid peroxidation induced by suppression of the MAPK/ERK signaling pathway in murine models. The dynamic decrease in miR-211-5p expression induces hypersynchronization and both nonconvulsive and convulsive seizures, and forebrain miR-211-5p suppression exacerbates long-lasting pentylenetetrazole-induced seizures. Additionally, in this study, induction of miR-211-5p expression or genetic-silencing of P2RX7 significantly reduced the seizure score and duration in murine models through the abovementioned pathways. These results suggest that the miR-211-5p/P2RX7 axis is a novel target for suppressing both ferroptosis and epilepsy.

Keywords: Bioinformatics technology; Epilepsy; Ferroptosis; MAPK signaling pathways; P2RX7; microRNA-211-5p.


Conflict of interest statement

The authors declare no competing interests.

Figures

Fig. 1
Fig. 1
MiR-211-5p is downregulated in the blood of epilepsy patients and in the hippocampal tissue of epileptic mice, and it targets P2RX7. A The transcriptome data of GSE99455 abstracted from hippocampal miRNA profiling of intractable epilepsy and healthy controls. Differential expression analysis in epilepsy vs. control revealed 70 upregulated genes and 74 downregulated genes (miR-211-5p was significantly downregulated, LogFC = − 1.384, p = 0.0013). B miR-211-5p was downregulated in venous blood samples of 60 epileptic patients. C miR-211-5p was downregulated in the hippocampus of KA-induced epileptic mice. D The Venn diagram overlapped 14,576 DEGs in the miRWalk database, 15,405 DEGs in the RNA22 database, 4350 DEGs in the RNAInter database and 5341 DEGs in the TargetScan database, and 2000 potential miRNA-211-5p target genes were predicted. To further narrow down the number of target genes. E The Venn diagram overlapping 2000 predicted miR-targeted genes, 1447 DEGs in epilepsy related genes in the Genecards database, 3884 DEGs in the GSE134697 database and 520 DEGs in the Metal Ion Gene database, and highlights the five most promising genes regulated by miRNA-211-5p, including (F) upregulated P2RX7 and TMTC2, and downregulated CACNA1C, JPH3 and GRM1. G The relative mRNA levels of P2RX7 and TMTC2 in KA-induced epileptic mice compared with control mice were measured by qRT-PCR. H A construction diagram of target double-luciferase reporter genes (with mutant sequences labelled in red). I Relative luciferase activities were detected in cells after co-transfection with empty vector, P2RX7-WT or P2RX7-Mut, and miR-211-5p mimics or NC. J, M SH-SY5Y cells were transfected with mir-211-5p mimic (50 nM) vs. inhibitor (100 nM) for 48 h. Western blots and quantification of changes in relative protein levels of P2RX7 in mimic-miR-211-5p vs. inhibit-miR-211-5p SH-SY5Y cells. P2RX7 was decreased in the mimic-miR-211-5p group but increased in the inhibit-miR-211-5p group. KL Images and quantification of immunofluorescence staining revealed the level of P2RX7 in mimic-miR-211-5p vs. inhibit-miR-211-5p SH-SY5Y cells. (Scale bar, 100 μM). N The relative mRNA expression of P2RX7 in mimic-miR-211-5p vs. inhibit-miR-211-5p SH-SY5Y cells compared with control cells. All data are expressed as the mean ± SD. *p < 0.05, **p < 0.01, ns, no significance
Fig. 2
Fig. 2
P2RX7 expression is upregulated in the hippocampal tissue and excitatory neurons of an epilepsy mouse model. AC Elevated P2RX7 expression in epileptic mice compared with controls (A, B) as well as in the hippocampus compared to the neocortex in epilepsy (C). The GSE133554 dataset (A, p = 0.0185) included 6 hippocampal samples from epileptic mice and 5 samples from control mice, each with three replicates. The GSE88992 dataset (B, p = 0.0110) comprised 9 control hippocampus samples and 8 TLE samples derived from mice. The GSE1344697 dataset (C, p = 0.00054) included 17 hippocampal and 17 neocortex samples from patients with drug-resistant TLE, and 2 neocortex samples from healthy subjects. D, E Western blots and quantification of the protein levels of P2RX7 in KA-induced epileptic mice and control mice. P2RX7 was upregulated in the KA group compared to the control group. E The relative mRNA expression levels of P2RX7 in hippocampal tissues were evaluated by qRT-PCR in KA-induced epileptic mice, compared to control group mice. F Relative mRNA expression levels of P2RX7 in blood samples were evaluated by qRT-PCR in epilepsy patients compared to non-diseased controls. GJ Representative images from IF staining presenting P2RX7 expression in murine hippocampal sections in the KA group and control group. Data are presented as the mean ± SD of three independent experiments. Scale bars = 100 μm. K The GSE140393 database was performed on 12,271 single cells after quality control, and 25 cellular clusters were identified and divided into 6 major cell types in the epilepsy groups. L P2RX7 expression at the single-cell level in GSE140393. M The GSE143560 database was used to analyze 6422 single nuclei after quality control, and 17 cellular clusters were identified and divided into 6 major cell types in the epilepsy groups. P2RX7 was mainly expressed in excitatory neurons. N P2RX7 expression at the single-cell level in GSE143560. OQ Representative images from multiple immunofluorescences staining highlight P2RX7 in neurons (NeuN, O), microglia (Iba-1, P) and astrocytes (GFAP, Q). Scale bars = 100 μm. All data are expressed as the mean ± SD. *p < 0.05, **p < 0.01
Fig. 3
Fig. 3
P2RX7 knockdown exerts anticonvulsant effects and attenuates hippocampal neuronal loss in a mouse model. A A schematic diagram of murine models. B, C Western blots and quantification for comparing the protein levels of P2RX7 in control mice, sh-P2RX7 mice and sh-Con mice. P2RX7 was downregulated in the sh-P2RX7 group compared to the control and sh-Con groups. D The relative mRNA levels of P2RX7 in the sh-P2RX7 group compared to the control and the sh-Con groups. EG The average seizure-stage score reached 4.75 ± 0.46 in the KA group vs. 3.00 ± 0.76 in the sh-P2RX7 + KA group (E). F The latency of epileptiform activity (F, 9.13 ± 1.42 in the sh-P2RX7 + KA group vs. 4.09 ± 0.80 in the KA group) and an average epileptiform duration of the first seizure (G, 5.59 ± 2.24 in sh-P2RX7 + KA group vs. 8.92 ± 0.95 in KA group). H Representative 5-min EEG recordings from the hippocampus (after 14 days of KA injection) showed spontaneous electrographic seizures in the KA and sh-P2RX7 + KA group. I The number of SRS recorded after 14 days of KA injection, demonstrating that the sh-P2RX7 + KA group had a lesser number of seizures than those of the KA group. J The mean SRSs duration of sh-P2RX7 + KA group was significantly shorter than that of the KA group. KM Representative images of H&E and Nissl staining in the CA1, CA3 and DG areas. L, N Semiquantitative analysis of cell number (% of control). Scale bars = 100 μm. All data are expressed as the mean ± SD. *p < 0.05, **p < 0.01
Fig. 4
Fig. 4
P2RX7 knockdown can reduce ferroptosis and oxidative stress in vitro. A Based on the GSE143560 database (6422 single nuclei after quality control), a tSNE plot of each cell based on the ferroptosis activity score as calculated by AUCell in the control and epilepsy groups. Cells with high-ferroptosis-scoring are highlighted in red. The 6422 single nuclei were divided into Low-Ferro score (Low-FS) (5029 cells) and High-Ferro score (High-FS) (1393 cells) expression groups. Meanwhile, the 6422 single nuclei were divided into control group (3467 cells) (B) and an epilepsy group (2955 cells) (C). Among 1393 cells, the proportion of cells with high ferroptosis activity in the epilepsy group (675/2955, 22.84%) (C) was greater than that in the control group (718/3467, 20.71%) (B). D Representative quantification of relative mRNA levels of GPX4 in blood samples from epilepsy patients and non-diseased controls. GPX4 was downregulated in epilepsy group compared to control group. E, F SH-SY5Y cells were transfected with P2RX7 (100 nM) for 48 h. Representative quantification of relative protein levels of P2RX7 in control, si-P2RX7 and si-Con groups. P2RX7 was decreased in the si-P2RX7 group compared to the control and si-Con groups. GI Western blots and quantification of the protein levels of GPX4 and HO-1 in the control, Erastin, si-P2RX7 + Erastin and si-Con + Erastin groups. J, K Representative quantification of the relative protein and mRNA levels of GPX4 and HO-1 in the control, Erastin, si-P2RX7 + Erastin and si-Con + Erastin groups. LN MDA, SOD and GSH assays to detect lipid peroxidation levels in the control, Erastin, si-P2RX7 + Erastin and si-Con + Erastin groups. O, P Representative images of SH-SY5Y cells by DHE (O) and semiquantitative analysis of relative fluorescence intensity (P). Q, R Representative images of SH-SY5Y cells by HO/PI staining (Q) and semiquantitative analysis of the percentage of cell death (R). All data are expressed as the mean ± SD. *p < 0.05, **p < 0.01
Fig. 5
Fig. 5
P2RX7 knockdown can reduce ferroptosis and oxidative stress in vivo. AC Western blots and quantification of the protein levels of GPX4 and HO-1 in the control, KA, sh-P2RX7 + KA and sh-Con + KA groups. D, E Representative quantification of relative mRNA levels of GPX4 (D) and HO-1 (E) in the control, KA, sh-P2RX7 + KA and sh-Con + KA groups. FH MDA, SOD and GSH assays to detect lipid peroxidation levels in hippocampal tissues from the control, KA, sh-P2RX7 + KA and sh-Con + KA groups. I, J Representative images of hippocampal areas by Perl’s staining in randomly selected hippocampal sections and semiquantitative analysis of Perl’s staining positive cells (%). Scale bar = 200 μm. K Representative TEM images of hippocampal areas for mitochondrial changes in randomly selected tissues. Scale bar = 200 μm or 100 μm. All data are expressed as the mean ± SD. *p < 0.05, **p < 0.01
Fig. 6
Fig. 6
Inhibition of P2RX7 involves the MAPK Signaling Pathway. A Enrichment analysis was performed utilizing differentially expressed transcription factors and surface proteins derived from the DEGs extracted from seven distinct cellular subgroups (Excitatory neurons were split into Low-Ferro (Low-FS-Excit) and High-Ferro (High-FS-Excit) categories based on the Ferroptosis scores) in GSE143560. The bar chart shows the significantly enriched GO, KEGG, and WikiPathway terms. B Enrichment analysis was performed utilizing the DEGs extracted from seven distinct cellular subgroups. Notably, the MAPK signaling pathway emerged as the most significant pathway in the High-FS-Excit group (both in panels A and B). C A schematic diagram of transcriptome sequencing (these originate data from our murine model hippocampus tissues). D, E KEGG pathway enrichment analysis for DEGs in the KA (D) and Fer-1 (E) groups. The MAPK signaling pathway was the most significantly enriched in the KA (D) and Fer-1 (E) groups. F, G Western blots and quantification of the protein levels of P-ERK and ERK in the control, KA, sh-P2RX7 + KA and sh-Con + KA groups. H, I Western blots and quantification of the protein levels of P-P38 and P38 in the control, KA, sh-P2RX7 + KA and sh-Con + KA groups. J, K Western blots and quantification for comparing the protein levels of P-JNK and JNK in control, KA, sh-P2RX7 + KA and sh-Con + KA groups. The ratios of P-ERK/ERK, P-P38/P38 and P-JNK/JNK were increased in the KA group compared to control group, but decreased in the sh-P2RX7 + KA group compared to the sh-Con + KA group
Fig. 7
Fig. 7
P2RX7 facilitates ferroptosis resistance by regulating the MAPK/ERK Signaling Pathway. AD Western blots and quantification of the protein levels of P-ERK/ERK (B), GPX4 (C) and HO-1 (D) in the control, KA-induced epileptic, sh-P2RX7 + KA, sh-Con + KA, PD98059 + sh-P2RX7 + KA and DMSO + sh-Con + KA groups. EH Western blots and quantification of the protein levels of P-P38/P38 (F), GPX4 (G) and HO-1 (H) in the control, KA-induced epileptic, sh-P2RX7 + KA, sh-Con + KA, SB203580 + sh-P2RX7 + KA and DMSO + sh-Con + KA groups. IL Western blots and quantification for comparing the protein levels of P-JNK/JNK (J), GPX4 (K) and HO-1 (L) in control, KA-induced epileptic, sh-P2RX7 + KA, sh-Con + KA, SP600125 + sh-P2RX7 + KA and DMSO + sh-Con + KA groups. Representative quantification of relative protein levels of GPX4 and HO-1 were significantly changed after administration of ERK inhibitor (PD98059) compared to the KA group (A). There was no significant change in GPX4 and HO-1 after administration of a P38 inhibitor (SB203580) (E) or JNK inhibitor (SP600125) (I)
Fig. 8
Fig. 8
Activation of miR-211-5p ameliorated ferroptosis and oxidative stress in hippocampal neurons of mice with KA-induced epilepsy. A Relative miR-211-5p expression in the KA, miR-211-5p agomir + KA, NC agomir + KA, miR-211-5p antagomir + KA and NC antagomir + KA groups compared with the control group. BD The average seizure-stage score was 4.83 ± 0.41 in the KA group vs. 2.83 ± 0.75 in the miR-211-5p agomir + KA group vs. 4.67 ± 0.52 in the NC agomir + KA group vs. 4.83 ± 0.41 in the miR-211-5p antagomir + KA group vs. 4.67 ± 0.52 in the NC antagomir + KA group (B). The number of seizures within 120 min (C, average of 6 in the non-miR-211-5p agomir + KA group vs. 3 in the miR-211-5p agomir + KA group) and the average epileptiform duration of the first seizure (D, 7.08 ± 0.67 in the KA group vs. 3.87 ± 0.42 in the miR-211-5p agomir + KA group vs. 7.35 ± 0.51 in the NC agomir + KA group vs. 7.50 ± 0.61 in the miR-211-5p antagomir + KA group vs. 7.23 ± 0.49 in the NC antagomir + KA group). E Representative 5-min EEG recordings from the hippocampus (after 14 days of KA injection) showed spontaneous electrographic seizures in the KA, the miR-211-5p agomir + KA and the miR-211-5p antagomir + KA group. F The number of SRS recorded after 14 days of KA injection, demonstrating that the miR-211-5p agomir + KA group had a lesser number of seizures than those of the KA and the miR-211-5p antagomir + KA group. G The mean SRSs duration of the miR-211-5p agomir + KA group was significantly shorter than that of the KA and the miR-211-5p antagomir + KA group. HL Western blot analysis and quantification of the protein levels of P2RX7 (I), GPX4 (J), HO-1 (K) and P-ERK/ERK (L) in the control, KA-induced epilepsy, miR-211-5p agomir + KA, NC agomir + KA, miR-211-5p antagomir + KA and NC antagomir + KA groups. MO Representative quantification of the relative mRNA levels of P2RX7 (M), GPX4 (N) and HO-1 (O) in the control, KA, miR-211-5p agomir + KA, NC agomir + KA, miR-211-5p antagomir + KA and NC antagomir + KA groups. PR Measurement of MDA, SOD and GSH levels to evaluate lipid peroxidation in hippocampal tissues from the abovementioned six groups. S Representative TEM images of hippocampal areas for evaluation of mitochondrial changes in randomly selected tissues. Scale bar = 200 μm or 100 μm. T Hypothesized mechanisms by which the miR-211-5p/P2RX7/ERK/GPX4 axis regulates epilepsy-associated neuronal ferroptosis and oxidative stress. All data are expressed as the mean ± SD. *p < 0.05, **p < 0.01

References

    1. Devinsky O, Vezzani A, O'Brien TJ, Jette N, Scheffer IE, de Curtis M, Perucca P. Epilepsy. Nat Rev Dis Prim. 2018;4:18024. doi: 10.1038/nrdp.2018.24. - DOI - PubMed
    1. Loscher W, Klitgaard H, Twyman RE, Schmidt D. New avenues for anti-epileptic drug discovery and development. Nat Rev Drug Discov. 2013;12:757–776. doi: 10.1038/nrd4126. - DOI - PubMed
    1. Kwan P, Arzimanoglou A, Berg AT, Brodie MJ, Allen Hauser W, Mathern G, Moshe SL, Perucca E, Wiebe S, French J. Definition of drug resistant epilepsy: consensus proposal by the ad hoc Task Force of the ILAE Commission on Therapeutic Strategies. Epilepsia. 2010;51:1069–1077. doi: 10.1111/j.1528-1167.2009.02397.x. - DOI - PubMed
    1. Perucca P, Bahlo M, Berkovic SF. The genetics of epilepsy. Annu Rev Genom Hum Genet. 2020;21:205–230. doi: 10.1146/annurev-genom-120219-074937. - DOI - PubMed
    1. Varvel NH, Jiang J, Dingledine R. Candidate drug targets for prevention or modification of epilepsy. Annu Rev Pharmacol Toxicol. 2015;55:229–247. doi: 10.1146/annurev-pharmtox-010814-124607. - DOI - PMC - PubMed