. 2024 Jan 8;13(1):3.
doi: 10.1186/s40035-023-00394-6.

Increased cysteinyl-tRNA synthetase drives neuroinflammation in Alzheimer's disease

Affiliations

Increased cysteinyl-tRNA synthetase drives neuroinflammation in Alzheimer's disease

Xiu-Hong Qi et al. Transl Neurodegener. .

Abstract

Background: Microglia-mediated neuroinflammation in Alzheimer's disease (AD) is not only a response to pathophysiological events, but also plays a causative role in neurodegeneration. Cytoplasmic cysteinyl-tRNA synthetase (CARS) is considered to be a stimulant for immune responses to diseases; however, it remains unknown whether CARS is involved in the pathogenesis of AD.

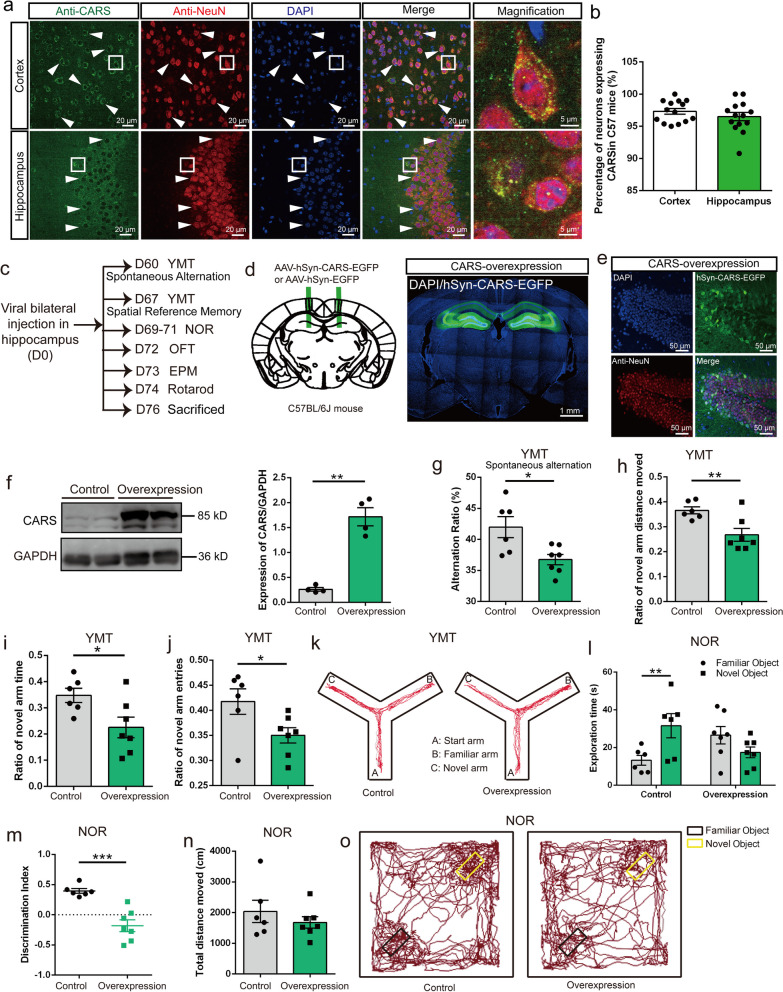
Methods: Postmortem human temporal cortical tissues at different Braak stages and AD patient-derived serum samples were used to investigate the changes of CARS levels in AD by immunocytochemical staining, real-time PCR, western blotting and ELISA. After that, C57BL/6J and APP/PS1 transgenic mice and BV-2 cell line were used to explore the role of CARS protein in memory and neuroinflammation, as well as the underlying mechanisms. Finally, the associations of morphological features among CARS protein, microglia and dense-core plaques were examined by immunocytochemical staining.

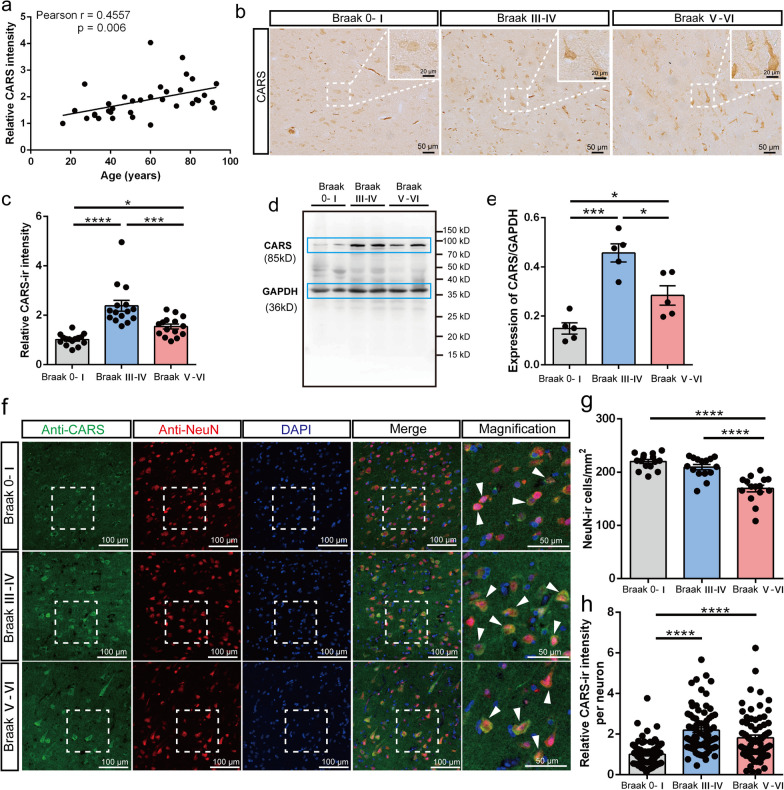
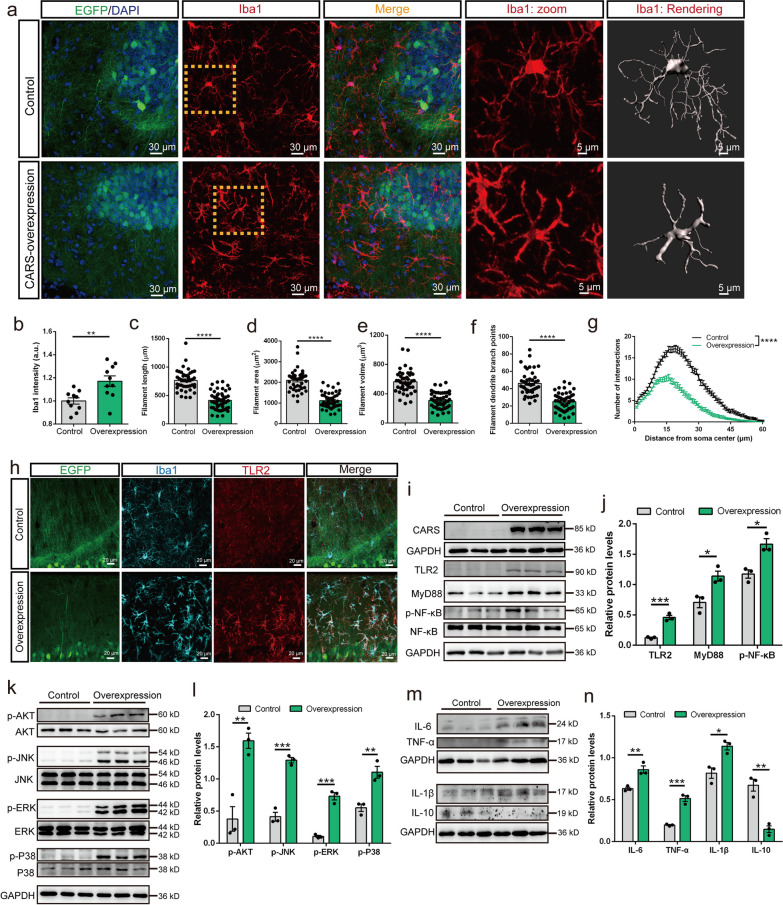
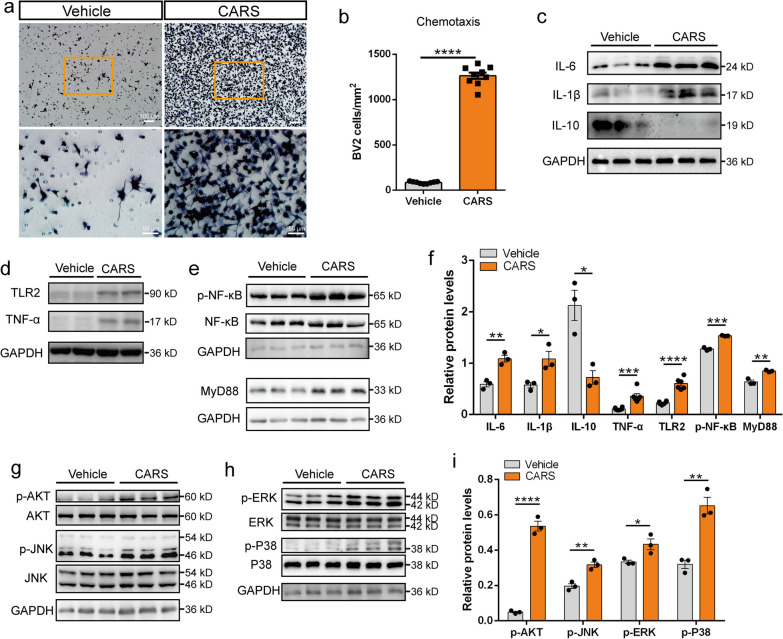
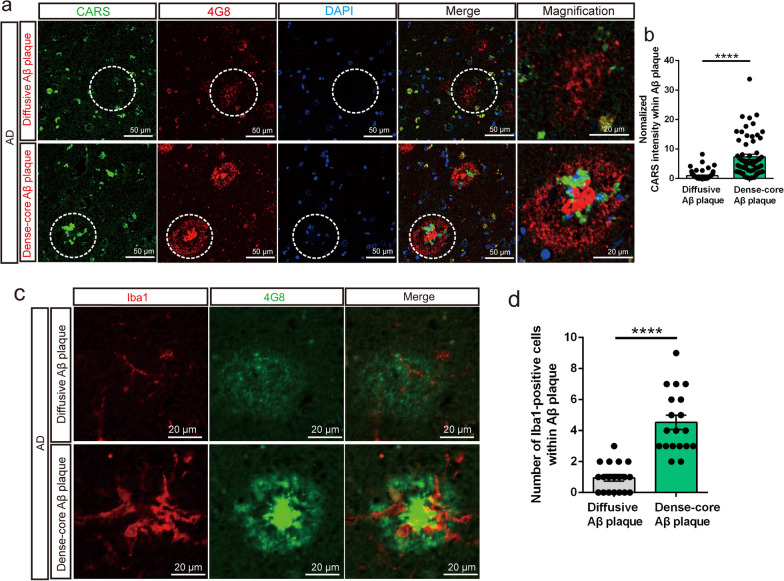
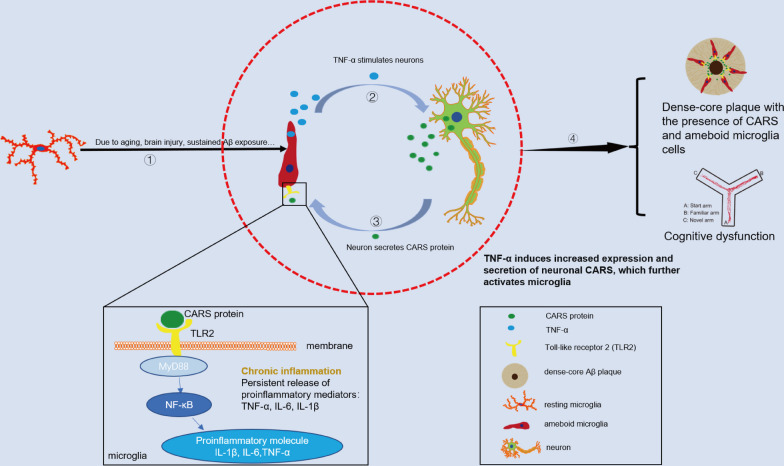
Results: A positive correlation was found between aging and the intensity of CARS immunoreactivity in the temporal cortex. Both protein and mRNA levels of CARS were increased in the temporal cortex of AD patients. Immunocytochemical staining revealed increased CARS immunoreactivity in neurons of the temporal cortex in AD patients. Moreover, overexpression of CARS in hippocampal neurons induced and aggravated cognitive dysfunction in C57BL/6J and APP/PS1 mice, respectively, accompanied by activation of microglia and the TLR2/MyD88 signaling pathway as well as upregulation of proinflammatory cytokines. In vitro experiments showed that CARS treatment facilitated the production of proinflammatory cytokines and the activation of the TLR2/MyD88 signaling pathway of BV-2 cells. The accumulation of CARS protein occurred within dense-core Aβ plaques accompanied by recruitment of ameboid microglia. Significant upregulation of TLR2/MyD88 proteins was also observed in the temporal cortex of AD.

Conclusions: The findings suggest that the neuronal CARS drives neuroinflammation and induces memory deficits, which might be involved in the pathogenesis of AD.

Keywords: Alzheimer’s disease; Cysteinyl-tRNA synthetase; Microglia; Neuroinflammation; TLR2.


Conflict of interest statement

The authors declare that the research was conducted in the absence of any commercial or financial relationships that could be construed as a potential conflict of interest.

Figures

Fig. 1
Fig. 1
CARS protein level in the temporal cortex increases with aging and in AD. a Correlation between the CARS-ir intensity in the temporal cortex and age of the control subjects. b Representative images of CARS staining in the post-mortem temporal cortex of subjects with different Braak stages. Insets: Magnifications of the white dotted boxes. c Quantification of the CARS-ir intensity in panel b. d and e Representative images of western blotting (d) and quantification (e) of CARS protein level in the post-mortem temporal cortex of subjects with different Braak stages. f Representative images of neuronal CARS expression in the post-mortem temporal cortex of subjects with different Braak stages. White arrowheads denote the co-localization of CARS-ir and NeuN. g Quantification of the density of neurons. h Quantification of CARS-ir intensity per neuron in the temporal cortex of subjects with different Braak stages. Data are shown as mean ± SEM; *P < 0.05, ***P < 0.001, ****P < 0.0001
Fig. 2
Fig. 2
Overexpression of CARS in hippocampal neurons induces memory deficits in C57BL/6J mice. a Representative images showing CARS-ir neurons in the cortex and the hippocampus of C57BL/6J mice. White arrowheads denote neurons expressing CARS. b Percentages of neurons expressing CARS in the cortex and the hippocampus of C57BL/6J mice. c Schedule of viral injection and subsequent behavioral tests. d Left: Illustration of the injection sites. Right: Representative image of the infected hippocampus. e Immunostaining of NeuN in the hippocampus after the hSynapsin promoter-driven expression of CARS. f Left: Western blotting of CARS protein in the hippocampus of CARS-overexpressing and control mice. Right: Quantification of CARS protein level in the hippocampus. g Spontaneous alternation behavior in the Y-maze test (YMT). hj Ratios of distance moved (h), as well as time spent (i) and entries (j) in the novel arm in the YMT. k Representative activity traces of the control and CARS-overexpressing mice in the YMT. ln The exploration time on familiar and novel objects (l), discrimination index (m) and total distance moved (n) in the novel object recognition (NOR) test. o Representative activity traces of the control and the CARS-overexpressing mice in the NOR test. Data are shown as mean ± SEM; *P < 0.05, **P < 0.01, ***P < 0.001
Fig. 3
Fig. 3
Neuronal overexpression of CARS activates microglia and the TLR2/MyD88 pathway in the hippocampus. a Representative images of Iba1 immunostaining (red) and 3D reconstruction (gray) of microglia in the hippocampus of the naïve C57BL/6J mice treated with AAV-hSyn-CARS-EGFP (CARS-overexpression or overexpression) or AAV-hSyn-EGFP (control). The areas indicated with dotted lines are magnified and shown in the “Iba1: zoom” images. b Quantification of Iba1 fluorescence intensity in the hippocampus of the control and CARS-overexpressing mice. cf Imaris-based automated quantification of Iba1+ microglial filament length (c), filament area (d), filament volume (e), and numbers of dendrite branch points (f) in the hippocampus of the control and the CARS-overexpressing mice. g Sholl analyses of microglial morphology in the control and the CARS-overexpressing mice. h Representative images of immunostaining for Iba1 (blue) and TLR2 (red) in the hippocampus of the control and the CARS-overexpressing mice. i, j Representative western blotting images (i) and quantification (j) of TLR2, MyD88 and p-NF-κB protein levels in the hippocampus of the control and the CARS-overexpressing mice. k, l Representative western blotting images of p-AKT, p-JNK, p-ERK and p-P38 proteins (k) and quantification (l) of the ratio of p-AKT/AKT, p-JNK/JNK, p-ERK/ERK and p-P38/P38 in the hippocampus. m, n Representative western blotting images (m) and quantification (n) of IL-6, TNF-α, IL-1β, and IL-10 protein levels in the hippocampus. Data are shown as mean ± SEM; *P < 0.05, **P < 0.01, ****P < 0.0001
Fig. 4
Fig. 4
CARS activates microglia and the TLR2/MyD88 pathway in vitro. a Representative images of adherent BV-2 cells stained with hematoxylin in the vehicle and CARS treatment groups. BV-2 cells were treated with CARS (100 μg/ml) for 12 h. Magnifications of the yellow boxes are shown in the lower panels. b Quantification of BV-2 cell density in the vehicle and CARS treatment (100 μg/ml, 12 h) groups. cf Representative western blotting images (ce) and quantification (f) of IL-6, IL-1β, IL-10, TLR2, TNF-α, p-NF-κB, and MyD88 protein levels in the BV-2 cells treated with CARS (10 μg/ml) for 24 h. gi Representative western blotting images (g and h) and quantification (i) of p-AKT, p-JNK, p-ERK and p-P38 protein levels in BV-2 cells treated with CARS (10 μg/ml) for 24 h. Data are shown as mean ± SEM; *P < 0.05, **P < 0.01, ***P < 0.001, ****P < 0.0001
Fig. 5
Fig. 5
CARS accumulates within dense-core Aβ plaques along with recruitment of ameboid microglia in the post-mortem temporal cortical tissues from AD patients. a Representative images showing CARS expression (green) within 4G8 (anti-β-amyloid antibody, red)-labeled diffusive Aβ plaques (upper panels) and dense-core Aβ plaques (lower panels) in the temporal cortical tissues from AD patients. The dashed lines indicate diffusive Aβ plaques (upper panels) and dense-core Aβ plaques (lower panels), and the magnifications are shown in the right panels. b Quantification of normalized CARS-ir intensity within the diffusive and the dense-core Aβ plaques in the temporal cortical tissues from three AD subjects. c Representative images showing Iba1-labeled microglia (red) within 4G8 (green)-labeled diffusive Aβ plaques (upper panels) and dense-core Aβ plaques (lower panels) in the temporal cortex of the AD subjects. d Quantification of microglia within the diffusive and the dense-core Aβ plaques in the temporal lobe cortex from three AD subjects. Data are shown as mean ± SEM; ****P < 0.0001
Fig. 6
Fig. 6
Proposed mechanisms underlying the CARS-induced chronic neuroinflammation in AD. Continuous accumulation of Aβ or other stresses such as oxidative stress can induce chronic neuroinflammation. The increased levels of pro-inflammatory cytokines such as TNF-α stimulate the release of CARS from neurons. Local elevation of CARS can induce additional microglial activation and the release of inflammatory cytokines, which further exacerbate the neuroinflammation cycle, aggravating cognitive impairment

References

    1. Wimo A, Winblad B, Jönsson L. The worldwide societal costs of dementia: estimates for 2009. Alzheimers Dement. 2010;6(2):98–103. doi: 10.1016/j.jalz.2010.01.010. - DOI - PubMed
    1. Velandia PP, Miller-Petrie MK, Chen C, Chakrabarti S, Chapin A, Hay S, et al. Global and regional spending on dementia care from 2000–2019 and expected future health spending scenarios from 2020–2050: An economic modelling exercise. EClinicalMedicine. 2022;45:101337. doi: 10.1016/j.eclinm.2022.101337. - DOI - PMC - PubMed
    1. Zhang B, Gaiteri C, Bodea L-G, Wang Z, McElwee J, Podtelezhnikov AA, et al. Integrated systems approach identifies genetic nodes and networks in late-onset Alzheimer's disease. Cell. 2013;153(3):707–720. doi: 10.1016/j.cell.2013.03.030. - DOI - PMC - PubMed
    1. Guerrero A, De Strooper B, Arancibia-Cárcamo IL. Cellular senescence at the crossroads of inflammation and Alzheimer's disease. Trends Neurosci. 2021;44(9):714–727. doi: 10.1016/j.tins.2021.06.007. - DOI - PubMed
    1. Sarlus H, Heneka MT. Microglia in Alzheimer's disease. J Clin Invest. 2017;127(9):3240–3249. doi: 10.1172/JCI90606. - DOI - PMC - PubMed

Substances