. 2024 Jan 8;14(1):836.
doi: 10.1038/s41598-023-50760-7.

Predicting the subjective intensity of imagined experiences from electrophysiological measures of oscillatory brain activity

Affiliations

Predicting the subjective intensity of imagined experiences from electrophysiological measures of oscillatory brain activity

Derek H Arnold et al. Sci Rep. .

Abstract

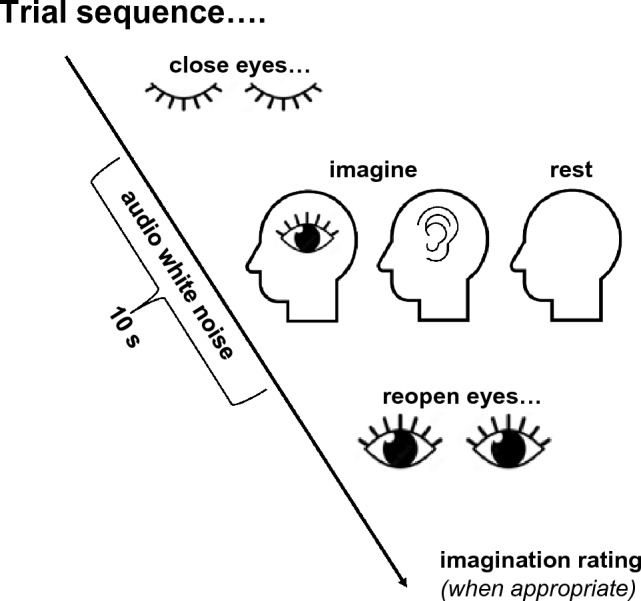
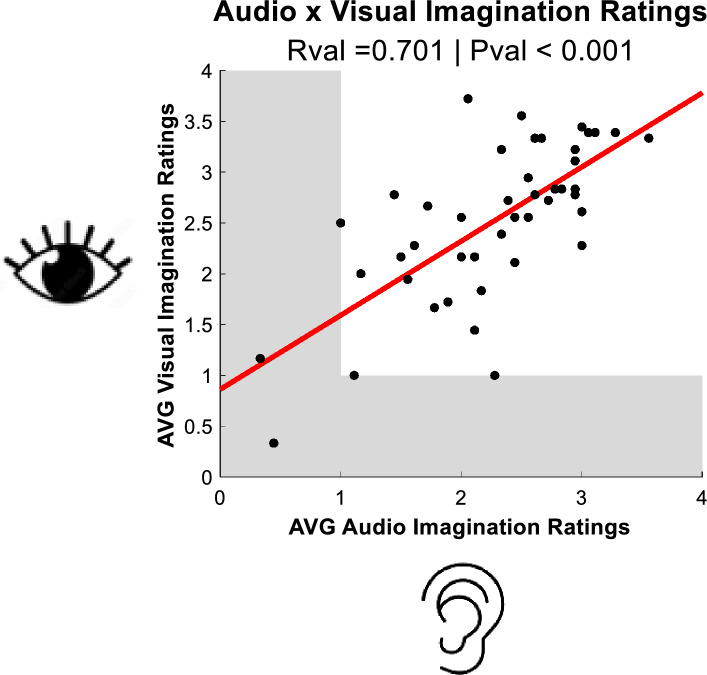
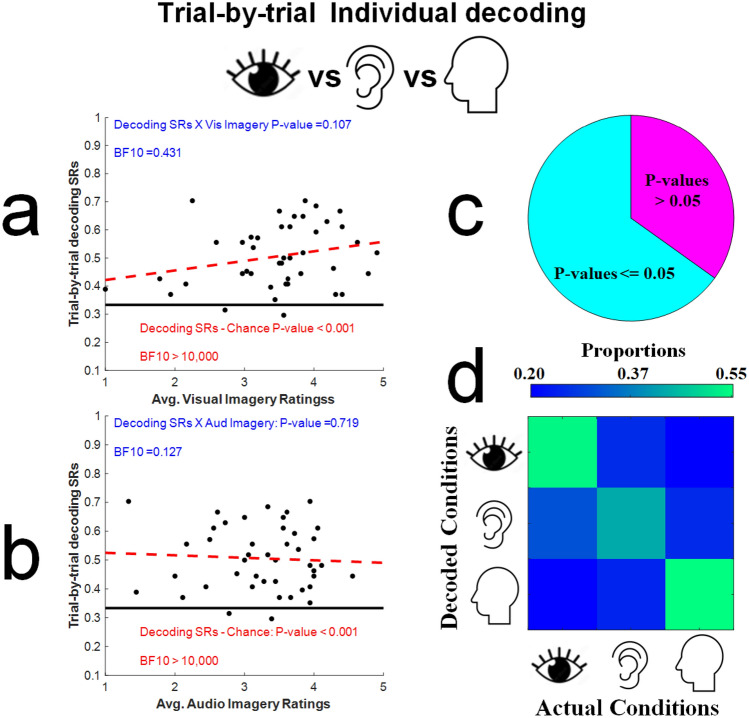
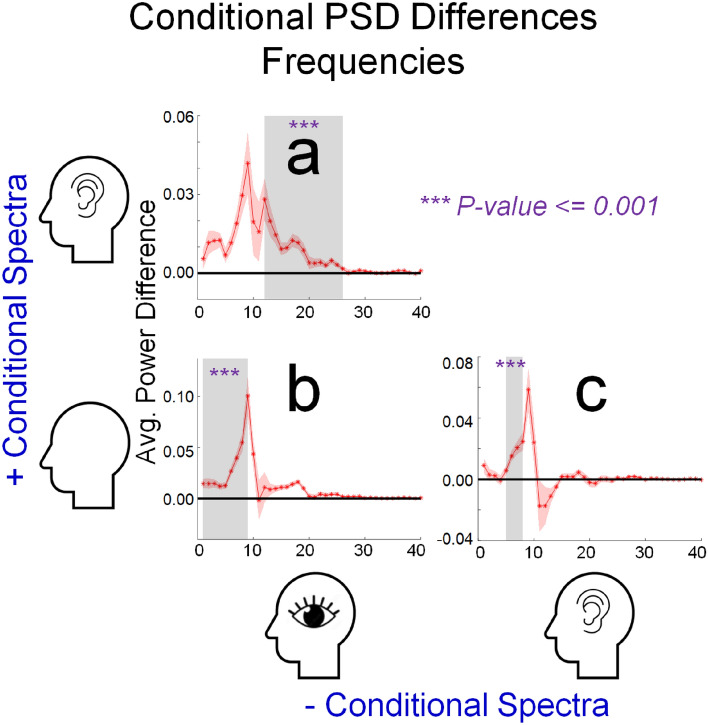
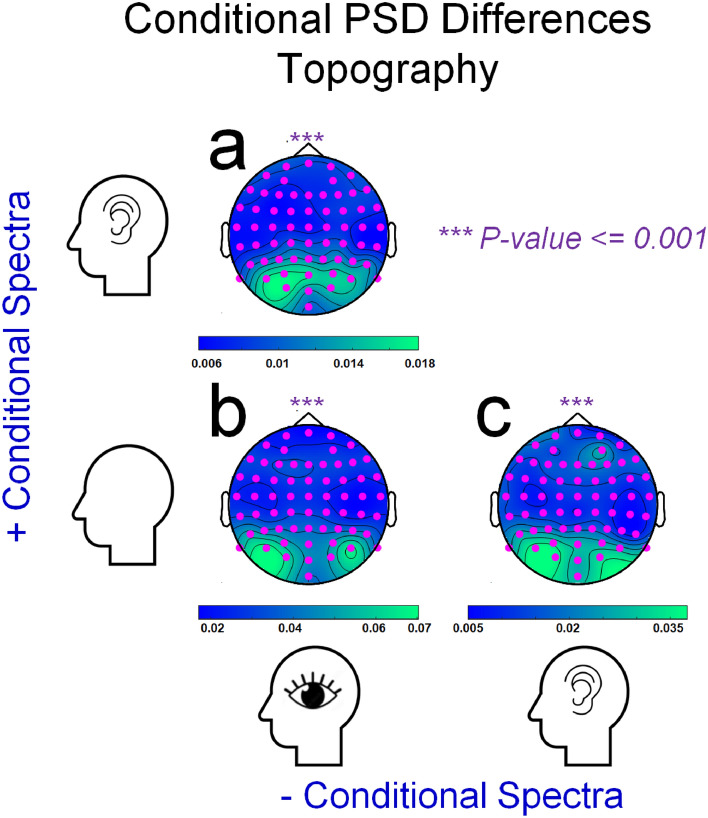
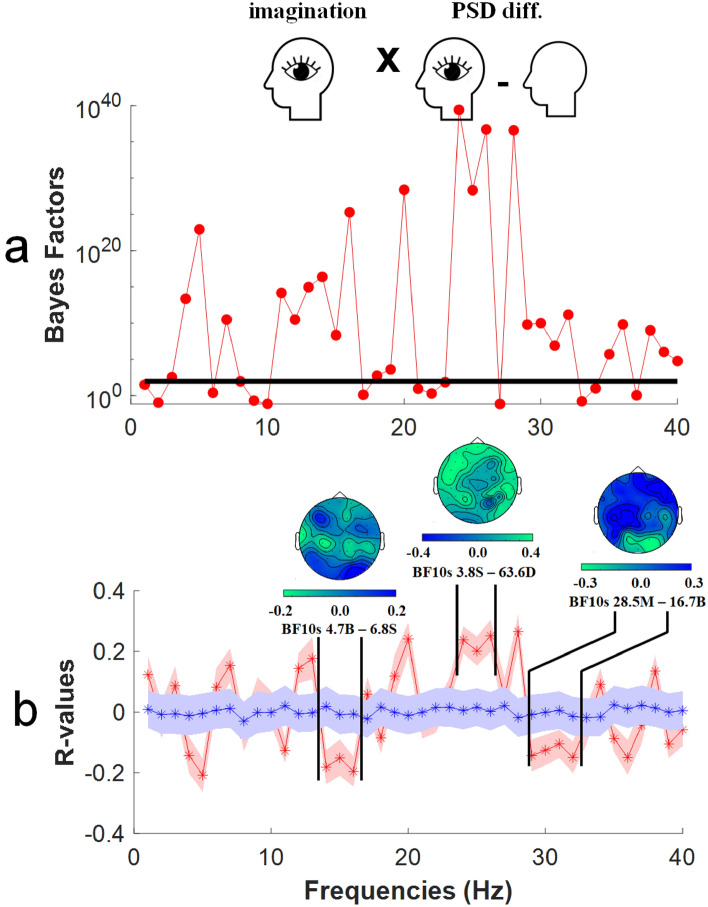
Most people can conjure images and sounds that they experience in their minds. There are, however, marked individual differences. Some people report that they cannot generate imagined sensory experiences at all (aphantasics) and others report that they have unusually intense imagined experiences (hyper-phantasics). These individual differences have been linked to activity in sensory brain regions, driven by feedback. We would therefore expect imagined experiences to be associated with specific frequencies of oscillatory brain activity, as these can be a hallmark of neural interactions within and across regions of the brain. Replicating a number of other studies, relative to a Resting-State we find that the act of engaging in auditory or in visual imagery is linked to reductions in the power of oscillatory brain activity across a broad range of frequencies, with prominent peaks in the alpha band (8-12 Hz). This oscillatory activity, however, did not predict individual differences in the subjective intensity of imagined experiences. For audio imagery, these were rather predicted by reductions within the theta (6-9 Hz) and gamma (33-38 Hz) bands, and by increases in beta (15-17 Hz) band activity. For visual imagery these were predicted by reductions in lower (14-16 Hz) and upper (29-32 Hz) beta band activity, and by an increase in mid-beta band (24-26 Hz) activity. Our data suggest that there is sufficient ground truth in the subjective reports people use to describe the intensity of their imagined sensory experiences to allow these to be linked to the power of distinct rhythms of brain activity. In future, we hope to combine this approach with better measures of the subjective intensity of imagined sensory experiences to provide a clearer picture of individual differences in the subjective intensity of imagined experiences, and of why these eventuate.


Conflict of interest statement

The authors declare no competing interests.

Figures

Figure 1
Figure 1
Graphic depicting a trial sequence. Each trial began with participants reading trial task instructions. They would then close their eyes before pressing a mouse button to begin the trial. After a short delay (0.62–1.62 s), this initiated a 10 s period wherein soft white noise was presented via speakers. On Audio and Visual Imagination trials, during these periods participants tried to imagine having a sensory experience in the specified sensory modality. On Resting-State trials, participants tried to empty their minds and concentrate on their breathing. In each case, participants were prompted to re-open their eyes by the white audio noise stopping. On Audio and Visual Imagination trials, they would then rate the vividness of their imagined experience.
Figure 2
Figure 2
Scatter plot of average Visual (Y-axis) and Auditory (X-axis) imagination intensities reported by each participant. Shaded grey mark regions where scores might be taken as evidence for aphantasia (i.e. these scores indicate that participants always rated imagined sensory experiences as “No image/mental soundtrack at all. I only know that I was thinking of images / sounds” or as “Vague and not at all clear”.
Figure 3
Figure 3
Plots of estimates of oscillatory power (Y-axes) as a function of frequency (X-axes). These data are averaged across all participants, separately for each condition. In top panels (ac) data are averaged across all sensors. In bottom panels (df) data are averaged across occipital/parietal sensors (sensors 24:26 and 62:64). Data recorded while people imagined having audio experiences are depicted in panels (a) and (d). Data recorded while people imagined having visual experiences are depicted in panels (b) and (e). Data recorded while people rested are depicted in panels (c) and (f).
Figure 4
Figure 4
(a) Scatterplot of trial-by-trial decoding success rates, calculated for each participant (Y-axis), and the average subjective ratings given to imagined experiences on visual imagination trials (X-axis). Blue text relates to statistical tests for a correlation between trial-by-trial decoding success rates and the subjective intensity of imagined experiences, whereas red text relates to statistical tests comparing actual decoding success rates to a chance decoding success rate (33.3%, marked by the black horizontal line). (b) Details are as for Fig. 4a, but analyses relate to average subjective ratings given to imagined experiences on audio imagination trials. (c) Pie chart showing the proportion of participants for whom the experimental condition (imagined Visual, Audio or Resting-State trials) could be decoded on a trial-by-trial basis, from analyses of the PSD of their brain activity, at a rate that was statistically above chance (established via a non-parametric shuffle test, see main text for further details). (d) Decoding Confusion Matrix, depicting proportions of decoded trials averaged across participants as a colour map, X-axis denotes actual experimental conditions and Y-axis the decoded conditions.
Figure 5
Figure 5
Plots depicting the results of significant non-parametric cluster tests, for differences in Power of Spectral Density in different experimental conditions (Y-axes) as a function of frequency (Hz, X-axes). Red shaded regions of each plot depict ± 1 SEM from the average difference between conditions. The frequency limits (Hz) of each significant cluster are indicated by the horizontal extent of grey shaded regions. Results are depicted for (a) a test for differences in oscillatory power when people were instructed to imagine having audio as opposed to visual experiences, (b) a test for differences in oscillatory power when people were instructed to rest as opposed to having imagined audio experiences, and (c) a test for differences in oscillatory power when people were instructed to rest as opposed to having imagined audio experiences.
Figure 6
Figure 6
Details are as for Fig. 5, with the following exceptions. Panel graphics depict heatmaps of differences in PSD, recorded by each sensor and averaged across cluster frequencies (as depicted in Fig. 5). In each case data recorded by all sensors contributed to these significant cluster tests, as indicated by the distributions of pink dots.
Figure 7
Figure 7
Results of non-parametric support vector regression (SVR) analyses. Analyses were conducted to detect relationships between estimates of PSD averaged across all sensors and individual subjective ratings of imagined audio intensities. (a) Bayes Factors (Y-axis) as a function of oscillatory frequency (Hz, X-axis). The bold horizontal line marks a BF10 = 100, which constitutes extreme evidence for the alternative hypothesis, that there is a predictive relationship between PSD differences and the intensity of imagined audio experiences. (b) R-values (Y-axis) as a function of oscillatory frequency (Hz, X-axis). The red line marks the average R value of regressions informing the audio SVR analysis, and the blue line marks the average R value of shuffled chance regressions. In each case shaded regions mark ± 2SEM. Insert heatmaps depict the distribution of R-values across individual sensors, averaged across cluster frequencies. The frequency limits of clusters are depicted by bold vertical black lines. Note that individual sensor difference scores were averaged into a global measure for SVR analyses. See main text for further details.
Figure 8
Figure 8
Results of non-parametric support vector regression (SVR) analyses, to detect predictive relationships between estimates of oscillatory power and subjective ratings of imagined visual intensities. All other details are as for Fig. 7.

Similar articles

References

    1. Pearson J. The human imagination: The cognitive neuroscience of visual mental imagery. Nat. Rev. Neurosci. 2019;20:624–634. doi: 10.1038/s41583-019-0202-9. - DOI - PubMed
    1. Zeman A, Dewar M, Della Sala S. Lives without imagery—Congenital aphantasia. Cortex. 2015;73:378–380. doi: 10.1016/j.cortex.2015.05.019. - DOI - PubMed
    1. Dawes A, Keogh R, Andrillon T, Pearson J. A cognitive profile of multi-sensory imagery, memory and dreaming in aphantasia. Sci. Rep. 2020;10:10022. doi: 10.1038/s41598-020-65705-7. - DOI - PMC - PubMed
    1. Hinwar RP, Lambert AJ. Anauralia: The silent mind and its association with aphantasia. Front. Psychol. 2021;12:744213. doi: 10.3389/fpsyg.2021.744213. - DOI - PMC - PubMed
    1. Galton F. Statistics of mental imagery. Mind. 1880;5:301–318. doi: 10.1093/mind/os-V.19.301. - DOI