. 2024 Jan 8;15(1):352.
doi: 10.1038/s41467-024-44686-5.

Mechanism-centric regulatory network identifies NME2 and MYC programs as markers of Enzalutamide resistance in CRPC

Affiliations

Mechanism-centric regulatory network identifies NME2 and MYC programs as markers of Enzalutamide resistance in CRPC

Sukanya Panja et al. Nat Commun. .

Abstract

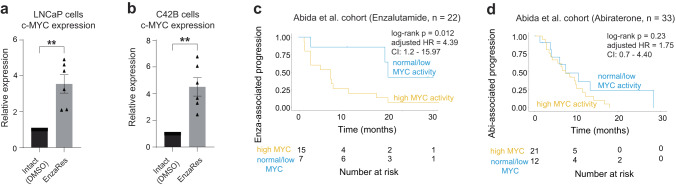
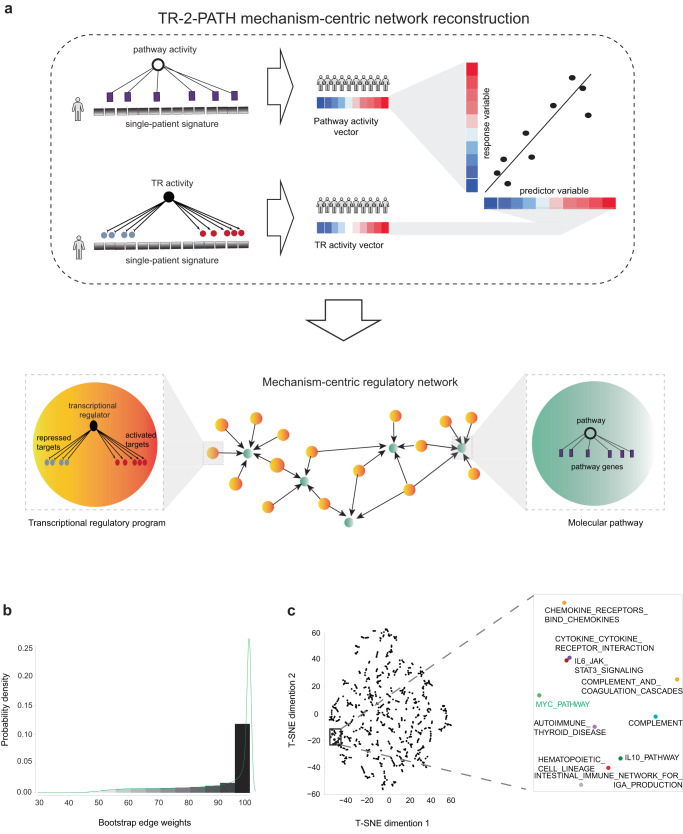
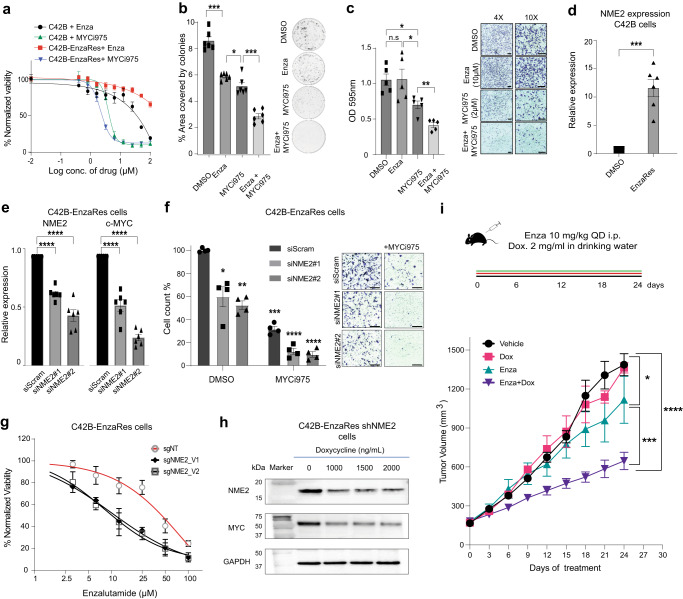
Heterogeneous response to Enzalutamide, a second-generation androgen receptor signaling inhibitor, is a central problem in castration-resistant prostate cancer (CRPC) management. Genome-wide systems investigation of mechanisms that govern Enzalutamide resistance promise to elucidate markers of heterogeneous treatment response and salvage therapies for CRPC patients. Focusing on the de novo role of MYC as a marker of Enzalutamide resistance, here we reconstruct a CRPC-specific mechanism-centric regulatory network, connecting molecular pathways with their upstream transcriptional regulatory programs. Mining this network with signatures of Enzalutamide response identifies NME2 as an upstream regulatory partner of MYC in CRPC and demonstrates that NME2-MYC increased activities can predict patients at risk of resistance to Enzalutamide, independent of co-variates. Furthermore, our experimental investigations demonstrate that targeting MYC and its partner NME2 is beneficial in Enzalutamide-resistant conditions and could provide an effective strategy for patients at risk of Enzalutamide resistance and/or for patients who failed Enzalutamide treatment.


Conflict of interest statement

S.A.A. is a coinventor on patents covering the methods and assays to identify and characterize MYC inhibitors and derivatives (US11420957B2, “Substituted heterocycles as c-MYC targeting agents”). A.M., S.P., S.A.A. E.M.S., and V.K. are coinventors on patent applications covering the methods and assays to identify Enzalutamide-responsive tumors (PCT Application No. PCT/US2023/065533, “MYC program as a marker of response to Enzalutamide in prostate cancer”). A.M. and S.P. are coinventors on patent applications covering the computational method TR-2-PATH (U.S. Patent Application No. 18/297,470, “Identifying treatment response signatures”). The remaining authors declare no competing interests.

Figures

Fig. 1
Fig. 1. MYC pathway activity is specific for predicting response to Enzalutamide in CRPC patients.
c-MYC expression in Intact (DMSO treated) and Enzalutamide-resistant (EnzaRes) (a) LNCaP and (b) C42B cells as shown using qRT-PCR. P values were estimated using a one-tailed Welch t-test. Data are presented as mean values ± SEM from n = 6 independent biological replicates. **p value ≤ 0.01. Source data are provided as a Source Data file. Kaplan-Meier survival analysis comparing CRPC patients that received (c) Enzalutamide or (d) Abiraterone after sample collection from the Abida et al. cohort with high (yellow) and normal/low (blue) MYC pathway activity levels. Log-rank p value, adjusted HR (hazard ratio), and CI (confidence interval) are indicated. Source data are provided as a Source Data file.
Fig. 2
Fig. 2. Reconstruction of a mechanism-centric regulatory network for CRPC patients.
a Schematic representation of the TR-2-PATH workflow. (First row) Single-patient pathway enrichment analysis and single-patient transcriptional regulatory analysis identifies pathway activity vector and transcriptional regulatory activity vector respectively, pairs of which are then subjected to linear regression analysis to reconstruct a mechanism-centric regulatory network. (Second row) In the network, transcriptional regulatory programs are represented as orange nodes and molecular pathways as green nodes. An edge (black arrow) illustrates that a significant relationship was defined between a transcriptional regulatory program and molecular pathway. b Distribution of edge weights across the network, as defined by the bootstrap analysis. The x-axis corresponds to the edge weight and the y-axis to its frequency (probability). c (Left) t-SNE clustering of molecular pathways (dots), based on the weights of their incoming edges. (Right) Pathways around MYC are shown as a zoom-in and MYC pathway is shown in green. Source data are provided as a Source Data file.
Fig. 3
Fig. 3. Network mining I: identifying upstream transcriptional regulatory programs that affect MYC pathway and are associated with response to Enzalutamide.
a Schematic representation of the changes in activity levels of molecular pathways and their upstream transcriptional regulatory programs (i.e., sub-networks) as they transition from Intact (treated with DMSO) to Enzalutamide-sensitive (EnzaSens) to Enzalutamide-resistant (EnzaRes) phenotypes. Red depicts up-regulation and blue depicts down-regulation of TR and pathway activities. b Identified upstream transcriptional regulatory programs (MYC-centered sub-network) associated with Enzalutamide treatment affecting MYC pathway, depicted across Intact, EnzaSens, and EnzaRes phenotypes. Red depicts up-regulation and blue depicts down-regulation of TR and pathway activities. Source data are provided as a Source Data file.
Fig. 4
Fig. 4. Network mining II: NME2 is prioritized as TR with the most significant effect on MYC pathway.
a Schematic representation of the PLS-inspired approach to prioritize TR programs, based on their effect on a molecular pathway of interest. (Left) TR activity vectors are utilized as inputs, which are then regressed on a pathway to identify non-collinear latent variables (pie charts), which include a linear combination of TR programs, based on their effect on the pathway (slices in each pie). (Middle) These latent variables are utilized to build a circle of correlation, which depicts the relationship between each latent variable and each TR and pathway. (Right) Effect scores are defined to group and prioritize TRs, based on their effect on a pathway. b A circle of correlation is utilized to determine the degree of closeness between TR programs and the MYC pathway, based on their effect on each latent variable. c Grouping and prioritization of the MYC upstream TR programs. Circle sizes correspond to the TR effect scores. NME2 is determined to have the most significant effect on MYC pathway. Source data are provided as a Source Data file.
Fig. 5
Fig. 5. Activities of MYC and NME2 are associated with poor response to Enzalutamide.
a, b Comparing NME2 TR and MYC pathway activity between adenocarcinoma cells (dark magenta) and other cells (dark orchid) in neoadjuvant and adjuvant samples of a CRPC patient obtained from He et al. P value was estimated using a one-tailed Welch t-test. In boxplots, the center line corresponds to the median and the box limits correspond to the first and third quartiles (the 25th and 75th percentiles). The upper and lower whiskers extend to the maximum or minimum value within 1.5 times the interquartile range, respectively. c (Left, top) Pearson correlation analysis between NME2 TR and MYC pathway activity in the Abida et al. cohort subjected to adjuvant Enzalutamide. Pearson r and p value are indicated. (Left, bottom) Patients with high-MYC and high-NME2 (yellow) and the rest of the patients (blue) were identified. (Right) Kaplan-Meier survival analysis, comparing high-MYC and high-NME2 group (yellow) to the rest of the patients (blue) in Abida et al. cohort subjected to adjuvant Enzalutamide. Log-rank p value, adjusted HR (hazard ratio), and CI (confidence interval) are indicated. d (Left, top) Pearson correlation analysis between NME2 TR and MYC pathway activity in SU2C West Coast cohort subjected to Enzalutamide and/or Abirterone either before or after sample collection. Pearson r and p value are indicated. (Left, bottom) Patients with high-MYC and high-NME2 (yellow) and the rest of the patients (blue) were identified. (Right) Kaplan-Meier survival analysis, comparing high-MYC and high-NME2 group (yellow) to the rest of the patients (blue) in SU2C West Coast cohort. Log-rank p value, adjusted HR (hazard ratio), and CI (confidence interval) are indicated.
Fig. 6
Fig. 6. Ability of MYC and NME2 to predict Enzalutamide-response outperforms known markers of PCa progression and treatment response.
Comparison of MYC and NME2 ability to predict response to Enzalutamide in Abida et al. cohort to known markers of PCa aggressiveness, including (a) transcriptomic and (b) genomic markers. Comparison of MYC and NME2 ability to predict response to Enzalutamide in Abida et al. cohort to known markers of response to ADT and ARSIs including (c) transcriptomic and (d) genomic markers. Comparison of MYC and NME2 ability to predict response to Enzalutamide in Abida et al. cohort to known markers of Enzalutamide-response, including (e) transcriptomic and (f) genomic markers. Two-tailed Welch t-test was utilized to calculate p values to estimate the difference in expression levels (red corresponds to over-expression and blue to under-expression) between high-MYC and high-NME2 group and the rest of the patients for transcriptomic markers in (a, c, e). Two-tailed Fisher-exact test was utilized to calculate p values to estimate the difference in the frequency/occurrence of any genomic alterations between high-MYC and high-NME2 group and the rest of the patients for genomic markers in (b, d, f).
Fig. 7
Fig. 7. MYC targeting is beneficial in Enzalutamide-resistant conditions.
a Drug sensitivity curves of Enzalutamide-naïve, or Enzalutamide-resistant (EnzaRes) C42B cells treated with MYCi975. Data are presented as mean values ± SEM from n = 3 biologically independent experiments. b Colony formation assay using Enzalutamide-resistant (EnzaRes) C42B cells in Intact (i.e., treated with DMSO), treated with Enzalutamide (10 µM), MYCi975 (2 µM), or a combination of Enzalutamide+MYCi975 (10 µM + 2 µM). Cells were grown in the presence of respective drugs. Representative images are shown, and data are presented as mean values ± SEM from n = 6 biologically independent experiments. P value was estimated using a one-tailed Welch t-test. *p value < 0.05, ***p value ≤ 0.001. c Boyden chamber-based in vitro migration assay using Enzalutamide-resistant (EnzaRes) C42B cells in Intact (i.e., treated with DMSO), treated with Enzalutamide (10 µM), MYCi975 (2 µM), or a combination of Enzalutamide+MYCi975 (10 µM + 2 µM). Representative images are shown, data are presented as mean values ± SEM from n = 5 biologically independent experiments, indicating the quantification of Crystal Violet trapped by migrated cells. Scale bars, 100 μm. P value was estimated using a one-tailed Welch t-test. *p value < 0.05, **p value ≤ 0.01. d Expression of NME2 in Intact and Enzalutamide-resistant (EnzaRes) C42B cells, using qRT-PCR, data are presented as mean values ± SEM from n = 6 biologically independent experiments. P value was estimated using the one-tailed Welch t-test. ***p value ≤ 0.001. e Two different siRNAs targeting NME2 were used to downregulate NME2 (left panel) and its effect on MYC expression using qRT-PCR is shown (right panel), data are presented as mean values ± SEM from n = 6 biologically independent experiments. P value was estimated using one-tailed Welch t-test. * p value < 0.05. f Boyden chamber-based in vitro migration assay using Enzalutamide-resistant (EnzaRes) C42B cells treated with DMSO or MYCi975 (2 μM) with or without knockdown of NME2. Representative images are shown, data are presented as mean values ± SEM from n = 4 biologically independent experiments, indicating the cell count quantification of Crystal Violet trapped by migrated cells, normalized to control (DMSO with siScramble). Scale bars, 100 μm. P value was estimated using 2-way ANOVA, *p value < 0.05, **p value < 0.01, ***p value < 0.001, ****p value < 0.0001. g Comparison of anti-proliferative effects of Enzalutamide on C42B EnzaRes cells that have NME2 knocked down via CRISPR (sgNME2_V1 and sgNME2_V2) versus C42B EnzaRes which have received non-targeting sgRNA control (sgNT). Data are presented as mean values ± SEM from n = 3 independent biological replicates for each cell line. h Western blot of NME2, MYC and GAPDH protein levels in C42B shNME2 EnzaRes cells treated with Doxycycline for 96 h at the indicated concentrations. (n = 3 biologically independent experiments, representative blot shown). i Schematic representation and tumor volumes for mice bearing established C42B EnzaRes shNME2 xenografts treated with vehicle (n = 7 mice), Enzalutamide (10 mg/kg QD i.p) and/or Doxycycline (2 mg/mL in drinking water) (n = 6 mice for Dox, Enza, Enza + Dox arms) for 24 days. Statistical significance was performed via two-way ANOVA. *p value < 0.05, ***p value ≤ 0.001, ****p value ≤ 0.0001. Source data for all the panels in this figure are provided as a Source Data file.

References

    1. Huggins C, Hodges CV. Studies on prostatic cancer. I. The effect of castration, of estrogen and of androgen injection on serum phosphatases in metastatic carcinoma of the prostate. Cancer Res. 1941;1:293–297. - PubMed
    1. Perlmutter MA, Lepor H. Androgen deprivation therapy in the treatment of advanced prostate cancer. Rev. Urol. 2007;9:S3–S8. - PMC - PubMed
    1. Shen MM, Abate-Shen C. Molecular genetics of prostate cancer: new prospects for old challenges. Genes Dev. 2010;24:1967–2000. doi: 10.1101/gad.1965810. - DOI - PMC - PubMed
    1. Salonen AJ, et al. Finnish multicenter study comparing intermittent to continuous androgen deprivation for advanced prostate cancer: interim analysis of prognostic markers affecting initial response to androgen deprivation. J. Urol. 2008;180:915–919. doi: 10.1016/j.juro.2008.05.009. - DOI - PubMed
    1. Waltering KK, Urbanucci A, Visakorpi T. Androgen receptor (AR) aberrations in castration-resistant prostate cancer. Mol. Cell. Endocrinol. 2012;360:38–43. doi: 10.1016/j.mce.2011.12.019. - DOI - PubMed

Publication types

MeSH terms