. 2024 Jan 8;13(1):4.
doi: 10.1038/s41389-023-00502-1.

A cyclin D1 intrinsically disordered domain accesses modified histone motifs to govern gene transcription

Affiliations

A cyclin D1 intrinsically disordered domain accesses modified histone motifs to govern gene transcription

Xuanmao Jiao et al. Oncogenesis. .

Abstract

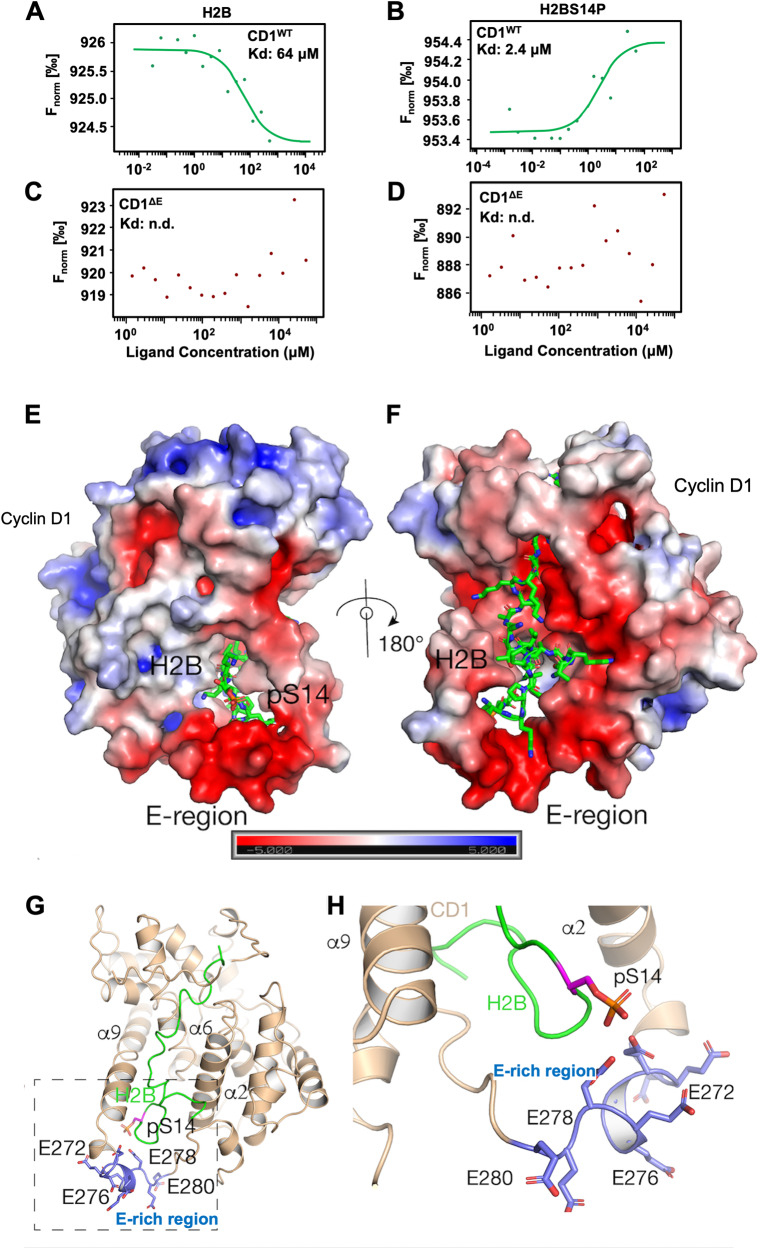
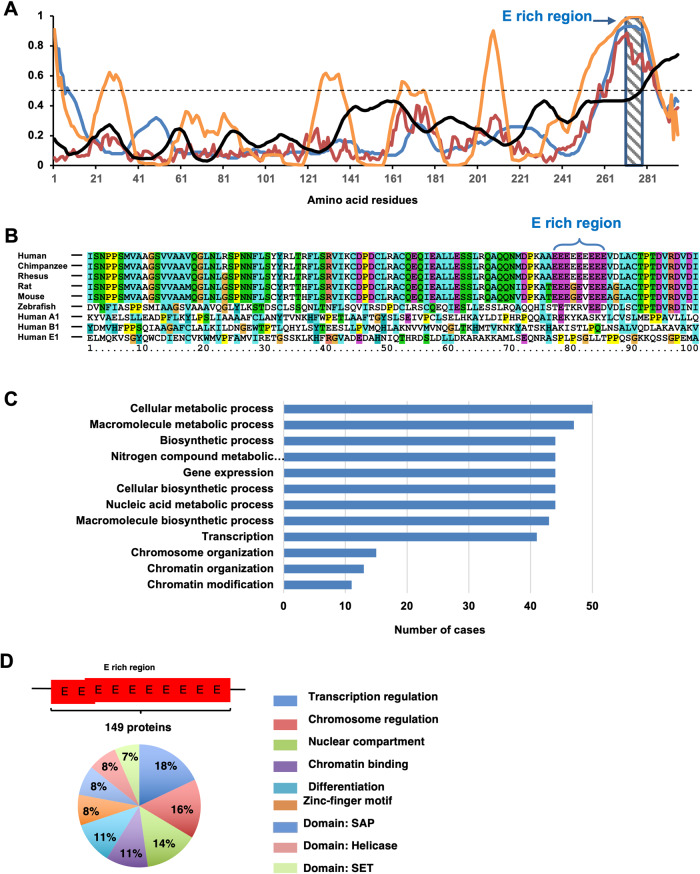
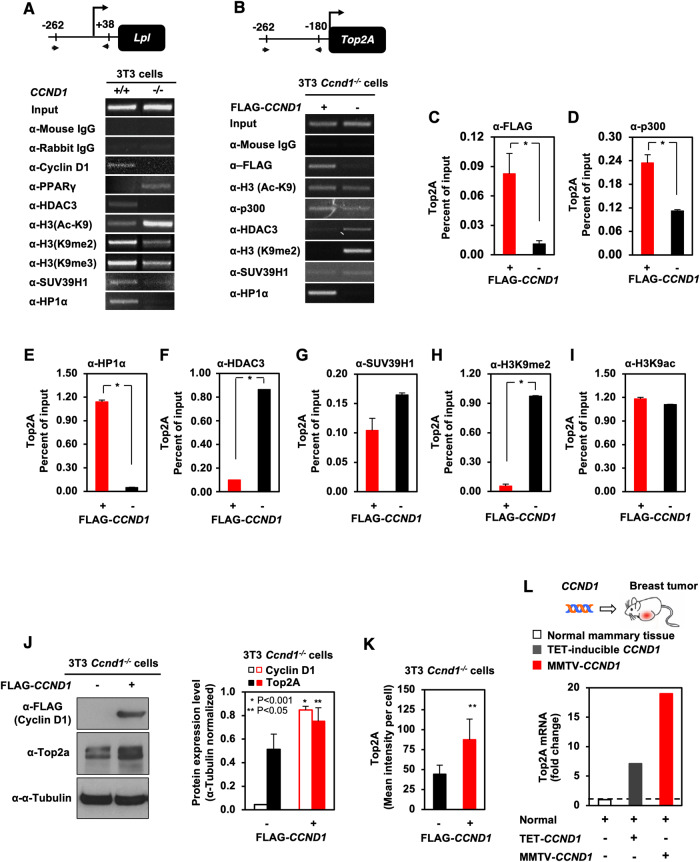
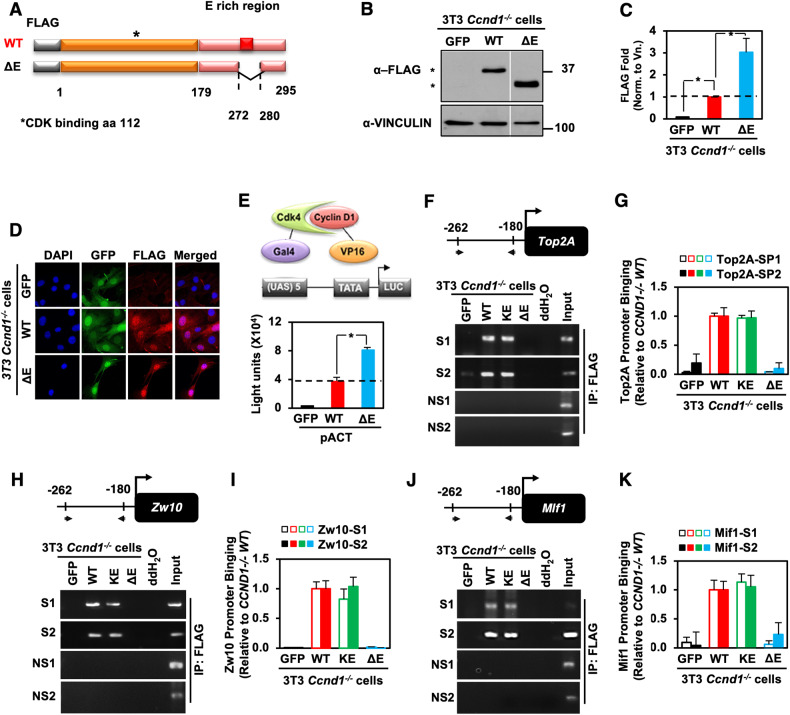
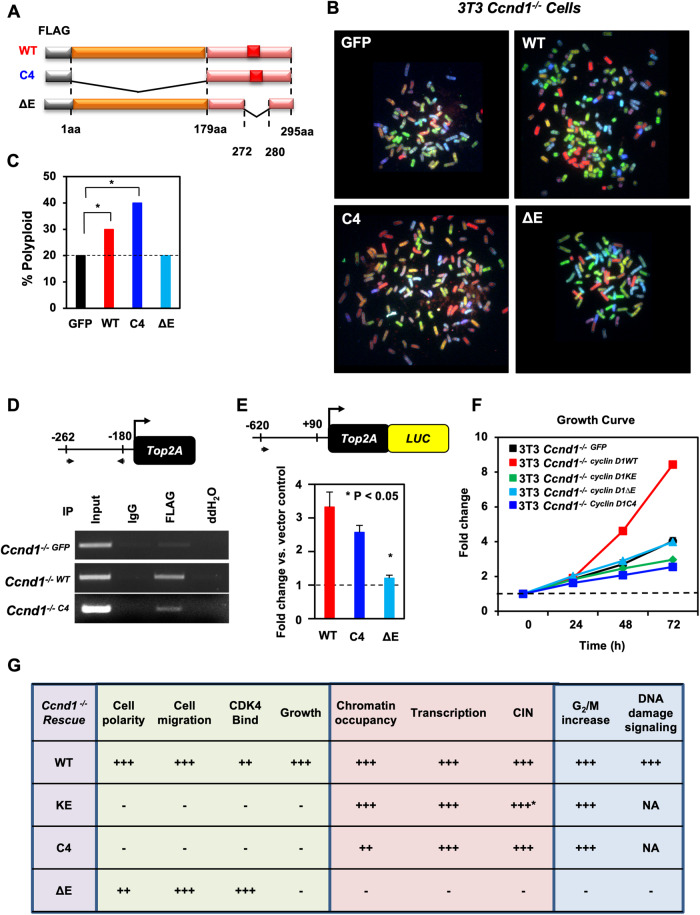
The essential G1-cyclin, CCND1, is frequently overexpressed in cancer, contributing to tumorigenesis by driving cell-cycle progression. D-type cyclins are rate-limiting regulators of G1-S progression in mammalian cells via their ability to bind and activate CDK4 and CDK6. In addition, cyclin D1 conveys kinase-independent transcriptional functions of cyclin D1. Here we report that cyclin D1 associates with H2BS14 via an intrinsically disordered domain (IDD). The same region of cyclin D1 was necessary for the induction of aneuploidy, induction of the DNA damage response, cyclin D1-mediated recruitment into chromatin, and CIN gene transcription. In response to DNA damage H2BS14 phosphorylation occurs, resulting in co-localization with γH2AX in DNA damage foci. Cyclin D1 ChIP seq and γH2AX ChIP seq revealed ~14% overlap. As the cyclin D1 IDD functioned independently of the CDK activity to drive CIN, the IDD domain may provide a rationale new target to complement CDK-extinction strategies.


Conflict of interest statement

The authors declare no competing interests.

Figures

Fig. 1
Fig. 1. The cyclin D1 carboxyl terminal E-rich region is necessary for the recognition of modified histones by Surface plasmon resonance.
A Coomassie staining and (B). Western blot for cyclin D1 (CD1WT), cyclin D1 E-region deleted (CD1ΔE) and KDM4A GST fusion proteins. C GST pull-down, with (D). quantitation shown as mean ± SEM for multiplicate experiments for GST-CD1WT, GST-CD1ΔE or GST-ctrl fusion proteins with histone peptide (H2B) and S14-phosphorylated histone peptide (H2BS14P). In comparison, GST pull-down of histone H3K4me3 with KDM4A is shown in (E). F Schematic representation of GST-cyclin D1 wild type and ΔE mutant. G Surface plasmon resonance (SPR) analysis of histone peptide (H2BS14P) with GST-cyclin D1, GST-ΔE or GST-ctrl fusion proteins. (GST-Cyclin D1: blue:10 μM, light blue:7 μM, magenta:5 μM, red:3.5 μM, orange:1 μM).
Fig. 2
Fig. 2. The cyclin D1 E-rich region is necessary for the recognition of H2BS14P in Microscale Thermophoresis (MST) analysis.
A MST analysis with H2B (A, C) and H2BS14P (B, D), indicating Kd, or the lack of binding (Kd cannot be determined, n.d.). E Human cyclin D1 (CD1) (Alpha fold – AF-P24385-F1) is shown in electrostatic surface and H2B (PDB ID: 2RVQ) [102] is shown in the sticks (green or magenta). Cyclin D1 contains a large negatively charged cavity on its surface which is ideal for binding to the highly positively charged tail of H2B. It is worth noting that this pocket is formed by helices α2, α 6, and α9 and is away from the CDK4/6 interacting site of cyclin D1. F 180° rotation of the structure in (E). G Cartoon representation of cyclin D1-H2B structural model. Helices α2, α6, and α9 that form the H2B binding pocket of cyclin D1 are shown, as well as the pS14 and the glutamates that form the E-rich region. H Zoom in on the representation of the interaction between cyclin D1 and H2B same orientation as in (H). Cyclin D1 is shown in wheat color. The E-region which binds S14P is shown in blue. The phosphoserine S14P is shown in magenta on the green sticks of the histone peptide.
Fig. 3
Fig. 3. Cyclin D1 association with histones is governed by phosphorylation (H2BS14).
A Representative example of histone array consisting of 384 unique histone modification combinations in duplicate. The array includes up to four different modifications on the same 19mer peptide. For the individual modifications, please see Supplemental Table 3. The Y axis is labeled alphabetically for a given histone in each row, with modifications labeled numerically on the X axis. As each spot is arrayed in duplicate, representative examples of cyclin D1 binding to modified histones as tested by histone-modification arrays and analyzed by active Motif software are shown. B Binding is representative of the average positive intensity over the average negative intensity of each modification. The correlation between densitometric analysis of duplicate interactions for each interaction from two separate arrays is shown as intensity left vs. intensity right. The intensity is highly reproducible between duplicate binding assessments (R2 = 0.927). (P refers to the designation of the column on the array (H2B), and the number refers to the numerical labeling of the row). C Representative examples of histone arrays (384 unique histone modifications on the same 19mer peptide), with binding shown to GST-cyclin D1 (GST-CD1WT), GST-CD1ΔE, GST-KDM4A or GST-ctrl fusion proteins. D Representative and (E) quantitated binding, representing average positive intensity over the average negative intensity of each modification for H2B 19mer peptide. F Graphical quantification of cyclin D1 binding to post-translationally modified H2BS14 19mer peptide.
Fig. 4
Fig. 4. The cyclin D1 carboxyl-terminal domain has intrinsic disorder tendency.
A Disorder tendency and disordered binding site prediction. PRDos (blue), IUPred long (maroon), PONDR (orange) predictions show that the carboxy-terminal 40 residues (aa 256 - aa295) have a strong tendency to be intrinsically disordered, whereas ANCHOR (black) suggests that last 15 amino acids contain a protein-protein interaction site. B Multiple sequence alignment of the last (carboxyl-terminal) 100 amino acids of cyclin D1 from various species and of human cyclin A1, B1 and E1. The E-box motif was found in 148 human proteins by BLASTP, and their enrichment (C) and ratio (D) in GO Biological Process (BP) categories (“regulation of…”, no. of hits in the given category/148 polyE proteins) is shown.
Fig. 5
Fig. 5. Cyclin D1 recruits distinct chromatin remodeling complexes to repressed (LPL) vs. activated (Top2A) promoters.
Endogenous murine LPL ChIP assay (A) and Top2A ChIP assays (BI) with antibodies directed to target proteins, as indicated in the figure. CI Recruitment of the indicated proteins to Top2A promoter was determined by ChIP and real-time quantitative PCR (qPCR). All data are mean ± SEM and represent n = 3 experiments. P-values were determined by the student’s t-test. J Western blot for Top2α and β tubulin abundance in cyclin D1-/- 3T3 cells rescued with a cyclin D1 expression vector with quantitation of multiplicate experiments. K Top2a intensity assessed by immunofluorescent staining in cyclin D1-/- cyclin D1 rescue 3T3 cells with data shown as mean ± SEM for N = 5. L Relative Top2A mRNA abundance in the mammary gland of Tet-inducible cyclin D1 mammary epithelial cell targeted transgenic mice (7 days of transgenic induction) or MMTV-cyclin D1 transgenic induced mammary gland tumors.
Fig. 6
Fig. 6. The cyclin D1 Glutamic acid (E)-rich region is required for Top2A promoter occupancy.
A Schematic representation of cyclin D1wt and cyclin D1ΔE mutant with internal deletion of the E-rich region (red), FLAG tag (gray), C terminal region (pink), and remaining (orange) region. B Western blot detection of the FLAG-tagged expression vectors and (C) densitometric analysis of cyclin D1 proteins shown as mean ± SEM for N = 5 separate experiments (P < 0.05). D Immunofluorescence staining of the FLAG epitope. GFP (Green) from the vector IRES, DAPI (Blue), and FLAG (Red). E Mammalian 2-hybrid interaction of cyclin D1wt and cyclin D1ΔE. shown as mean ± SEM for N > 5 separate transfections conducted in MCF7 cells. F ChIP assays of cyclin D1-/- 3T3 cells rescued with the indicated FLAG-tagged cyclin D1 proteins conducted with the Top2A promoter with oligonucleotide pairs that were either specific (S) to the region identified in ChIP-seq or non-specific (NS) targeted to a region not identified in ChIP-seq as binding to cyclin D1. PCR and (G) detected occupancy. Quantitation of PCR products was shown as mean ± SEM for N = 3. H, I Representative ChIP analysis and quantitation of the PCR products derived from cyclin D1 proteins binding Zw10 or (J, K) Mlf1 regulatory region.
Fig. 7
Fig. 7. The cyclin D1 carboxyl-terminal domain is necessary and sufficient to induce Top2A promoter activity and polyploidy.
A Schematic representation of cyclin D1wt and mutants with internal deletion of the E-rich region (red), FLAG tag (gray), C terminal region (pink), and remaining (orange) region. B Karyotype determined through SKY analysis for cyclin D1-/- cells rescued with either cyclin D1wt or cyclin D1 mutants with (C) mean polyploidy shown. D ChIP assays of cyclin D1-/- 3T3 cells rescued with the indicated FLAG-tagged cyclin D1 proteins were conducted with the Top2A promoter. E Top2A promoter luciferase reporter assays are shown as mean ± SEM for N > 5 separate transfections. F Cellular proliferation assays were conducted in cyclin D1-/- 3T3 cells, rescued either with cyclin D1WT, mutant or control vector. G Summary of cyclin D1 mutant properties. The items labeled with * are based on ref. [99].

References

    1. Hanahan D, Weinberg RA. Hallmarks of cancer: the next generation. Cell. 2011;144:646–74. doi: 10.1016/j.cell.2011.02.013. - DOI - PubMed
    1. Cahill DP, Kinzler KW, Vogelstein B, Lengauer C. Genetic instability and darwinian selection in tumours. Trends Cell Biol. 1999;9:M57–60. doi: 10.1016/S0962-8924(99)01661-X. - DOI - PubMed
    1. Davoli T, Uno H, Wooten EC, Elledge SJ. Tumor aneuploidy correlates with markers of immune evasion and with reduced response to immunotherapy. Science. 2017;355:eaaf8399 - PMC - PubMed
    1. Fujiwara T, Bandi M, Nitta M, Ivanova EV, Bronson RT, Pellman D. Cytokinesis failure generating tetraploids promotes tumorigenesis in p53-null cells. Nature. 2005;437:1043–7. doi: 10.1038/nature04217. - DOI - PubMed
    1. Sack LM, Davoli T, Li MZ, Li Y, Xu Q, Naxerova K, et al. Profound tissue specificity in proliferation control underlies cancer drivers and aneuploidy patterns. Cell. 2018;173:499–514 e423. doi: 10.1016/j.cell.2018.02.037. - DOI - PMC - PubMed

LinkOut - more resources