. 2024 Oct;42(10):1548-1558.
doi: 10.1038/s41587-023-02030-0. Epub 2024 Jan 8.

A palmitoyl transferase chemical-genetic system to map ZDHHC-specific S-acylation

Affiliations

A palmitoyl transferase chemical-genetic system to map ZDHHC-specific S-acylation

Cory A Ocasio et al. Nat Biotechnol. 2024 Oct.

Abstract

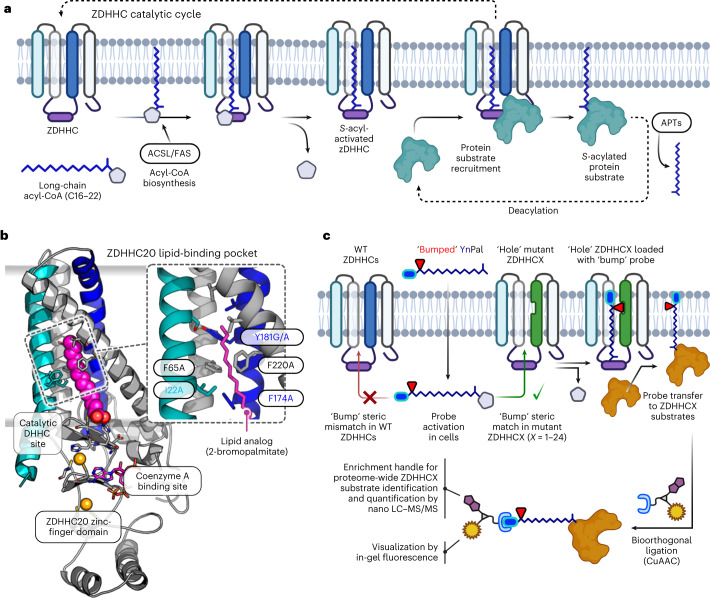
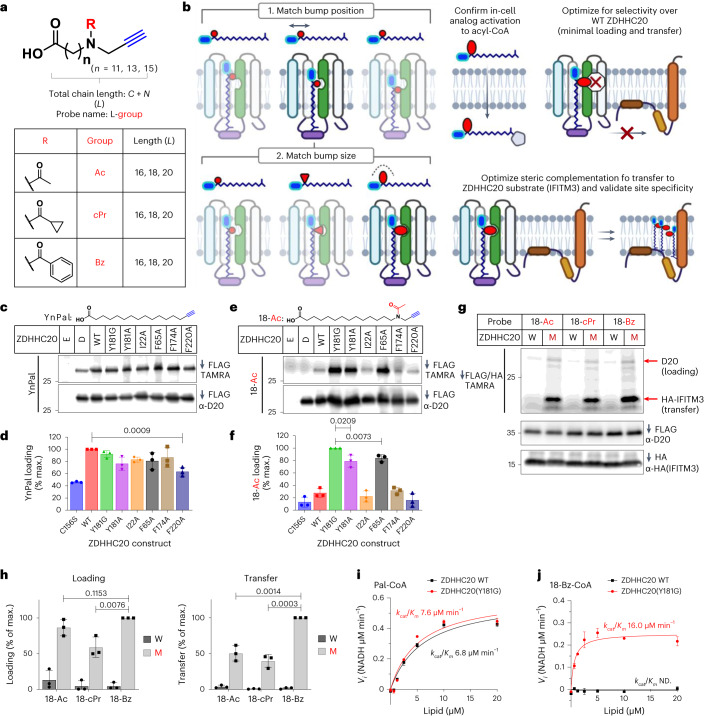
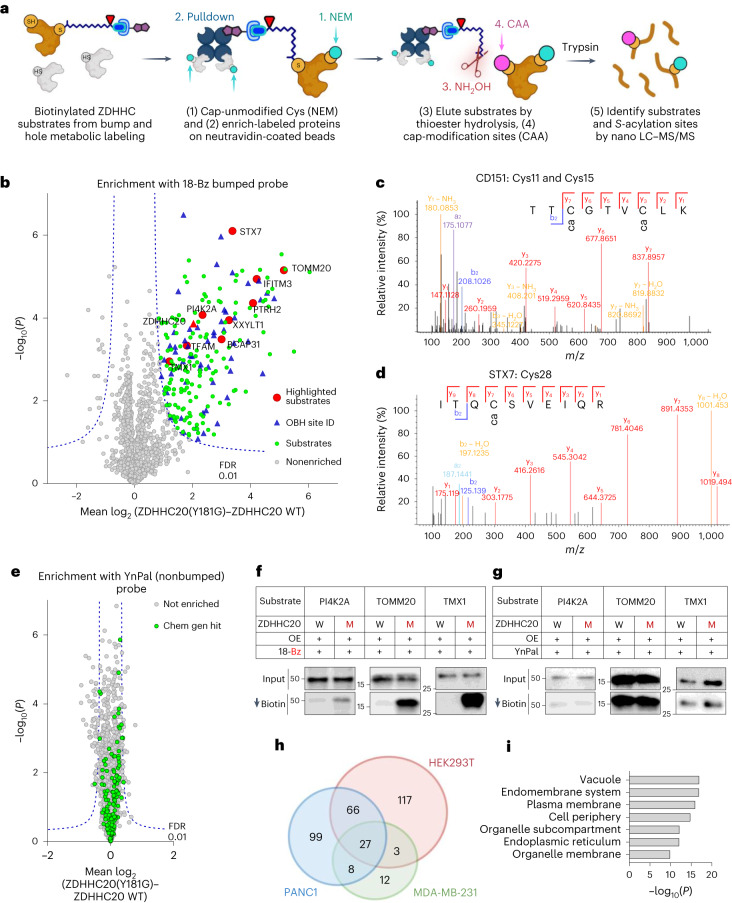
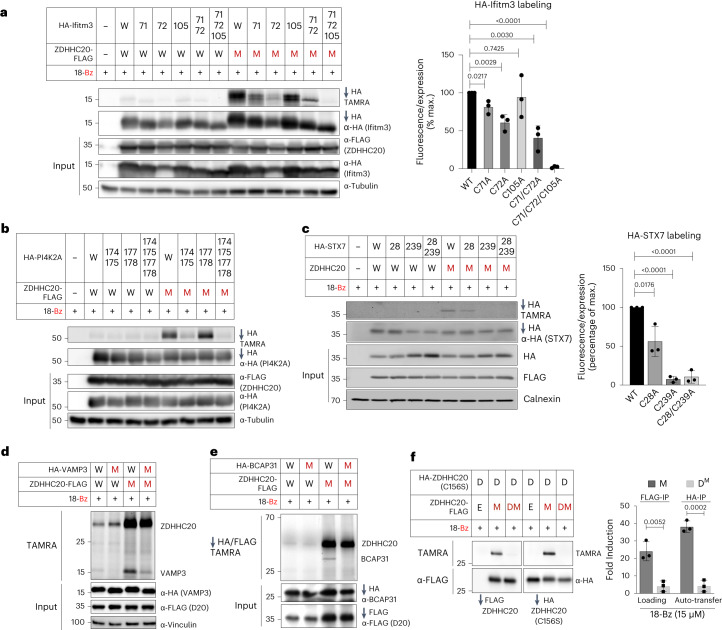
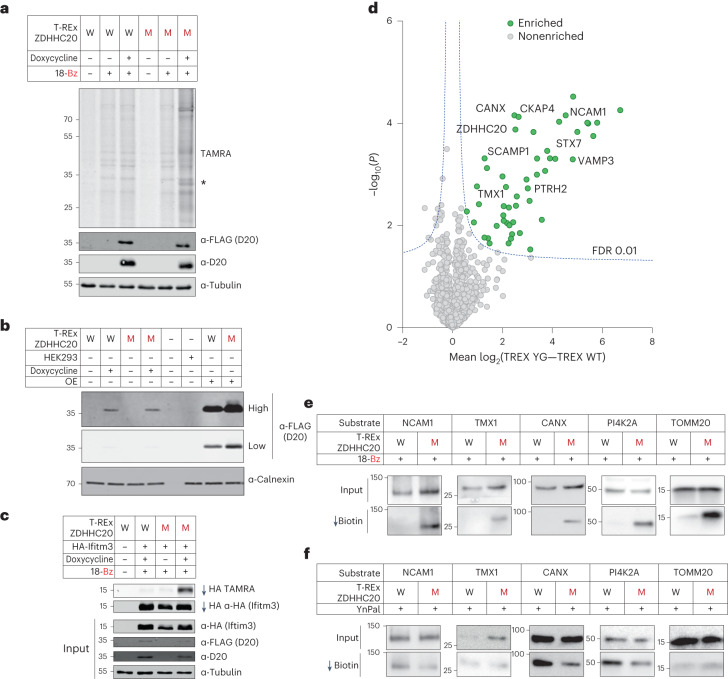
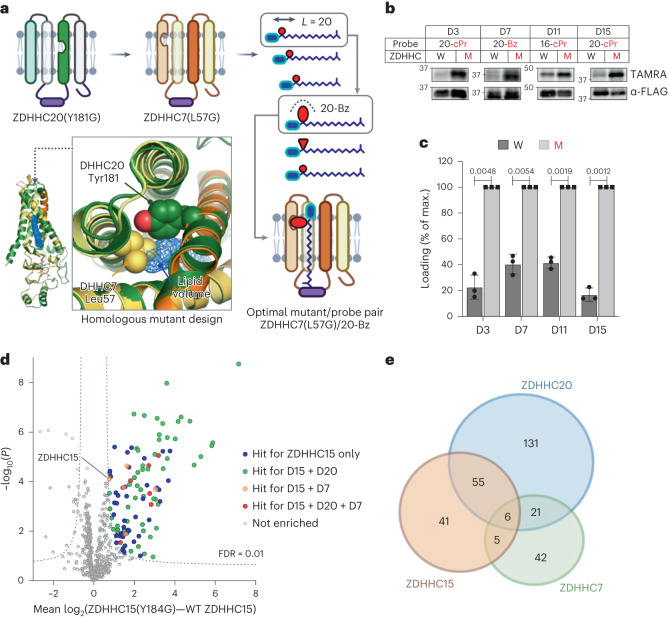
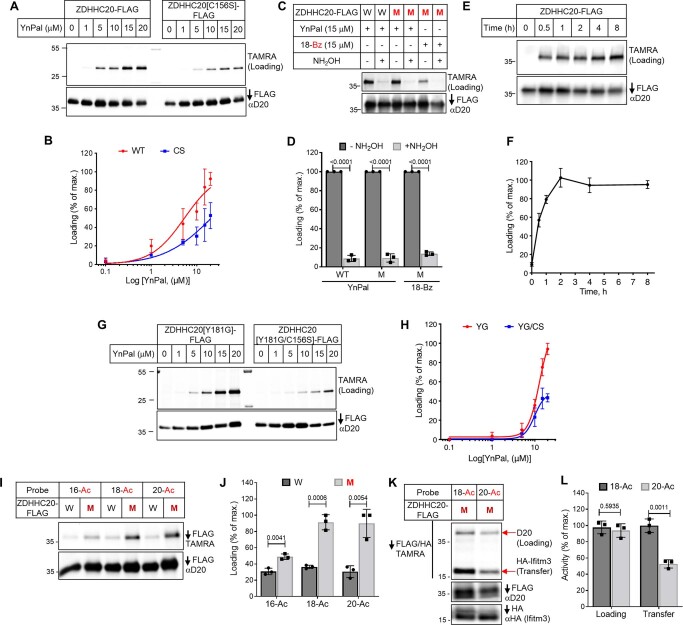
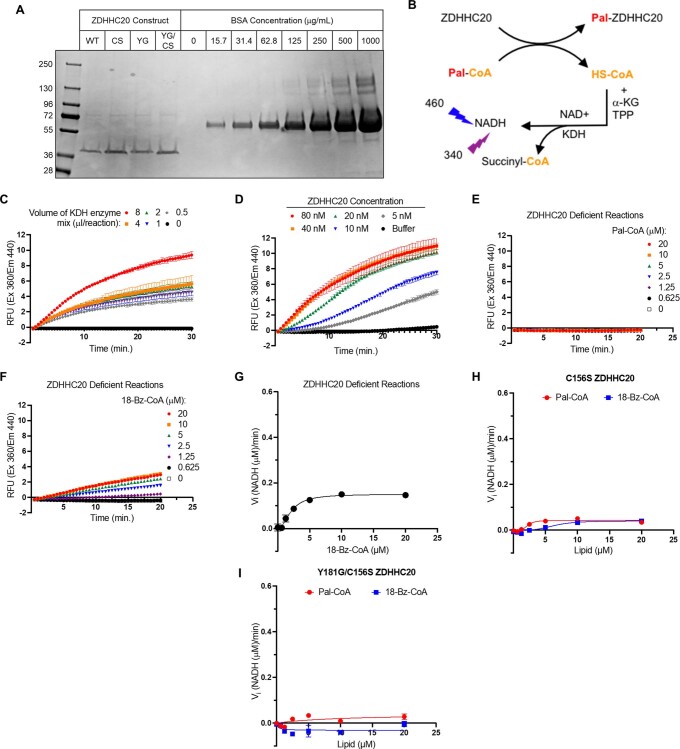
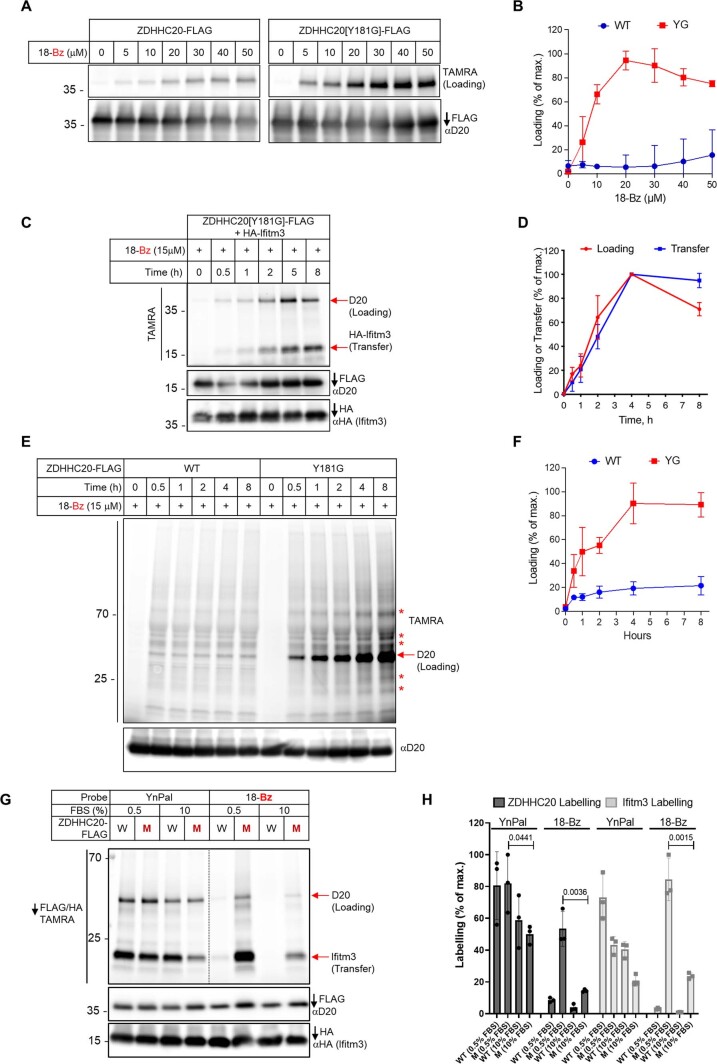
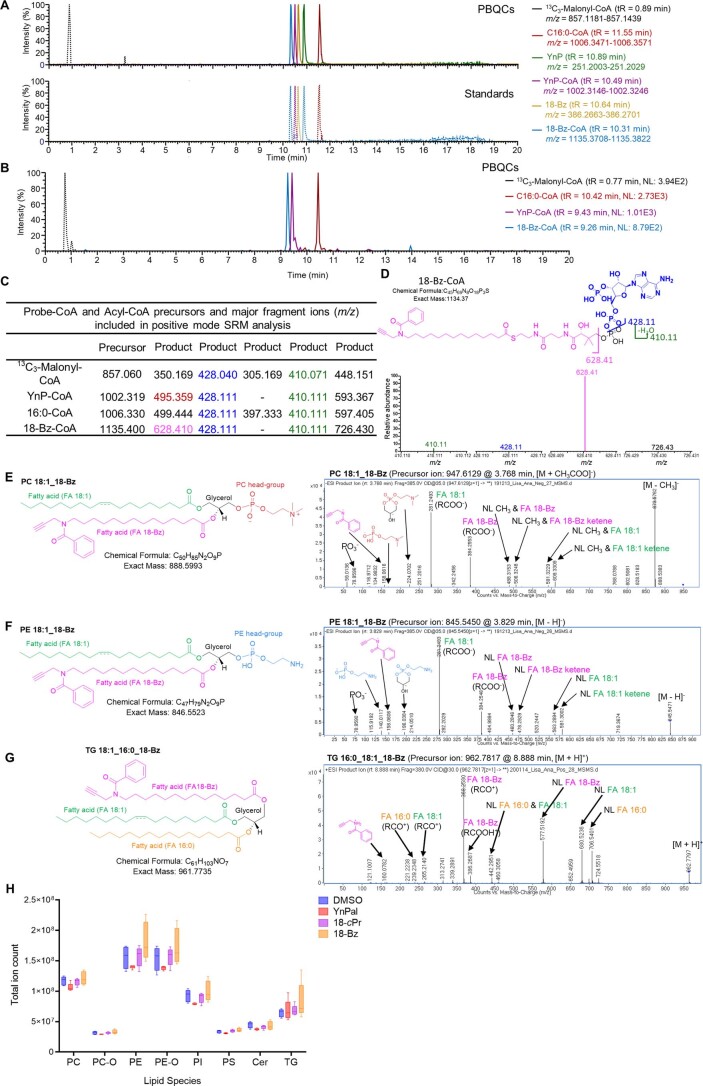
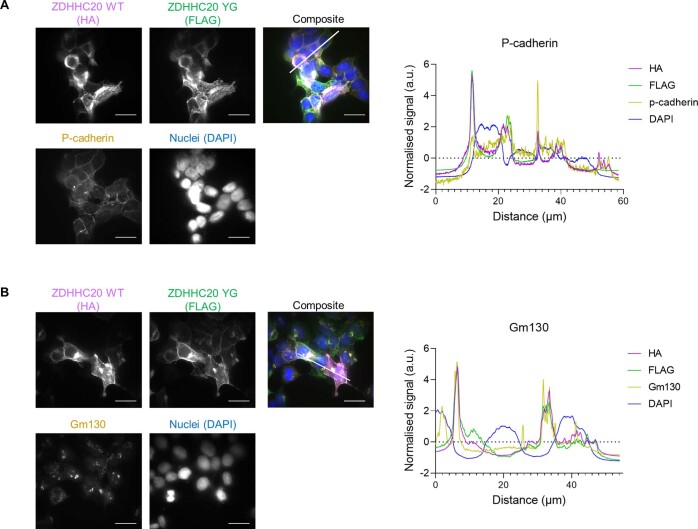
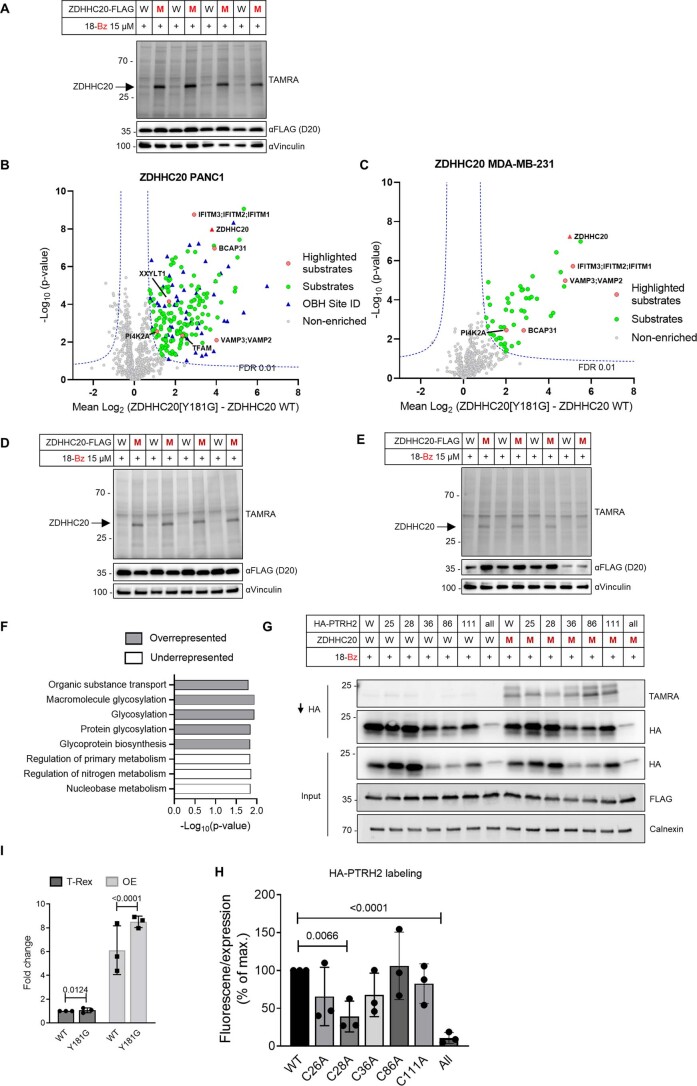
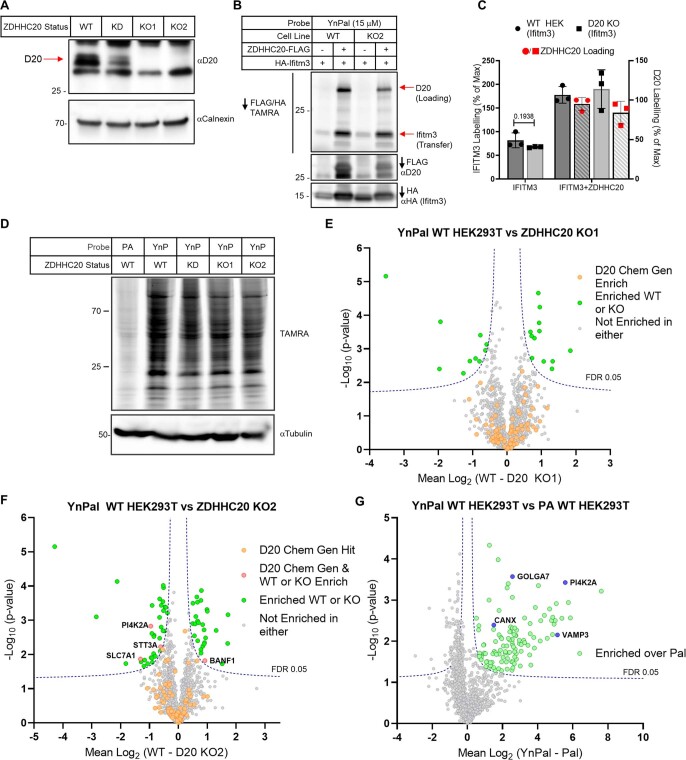
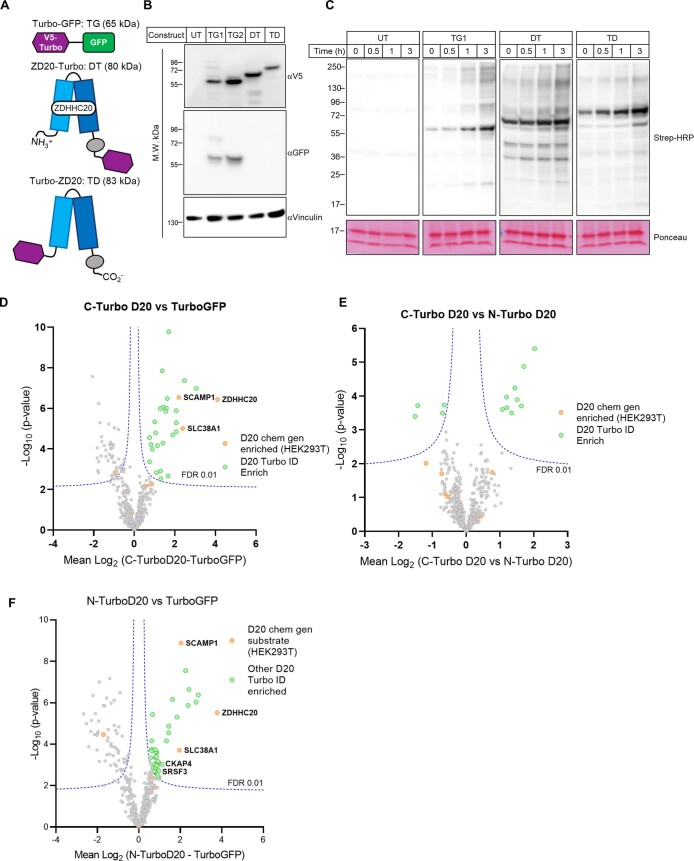
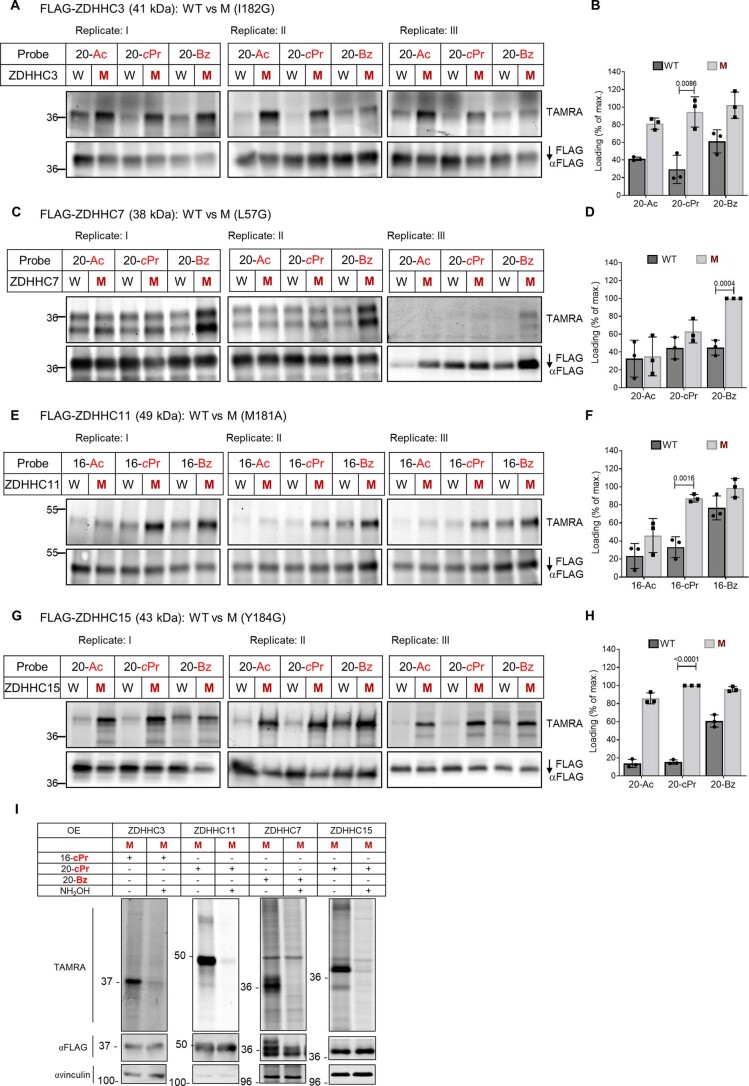
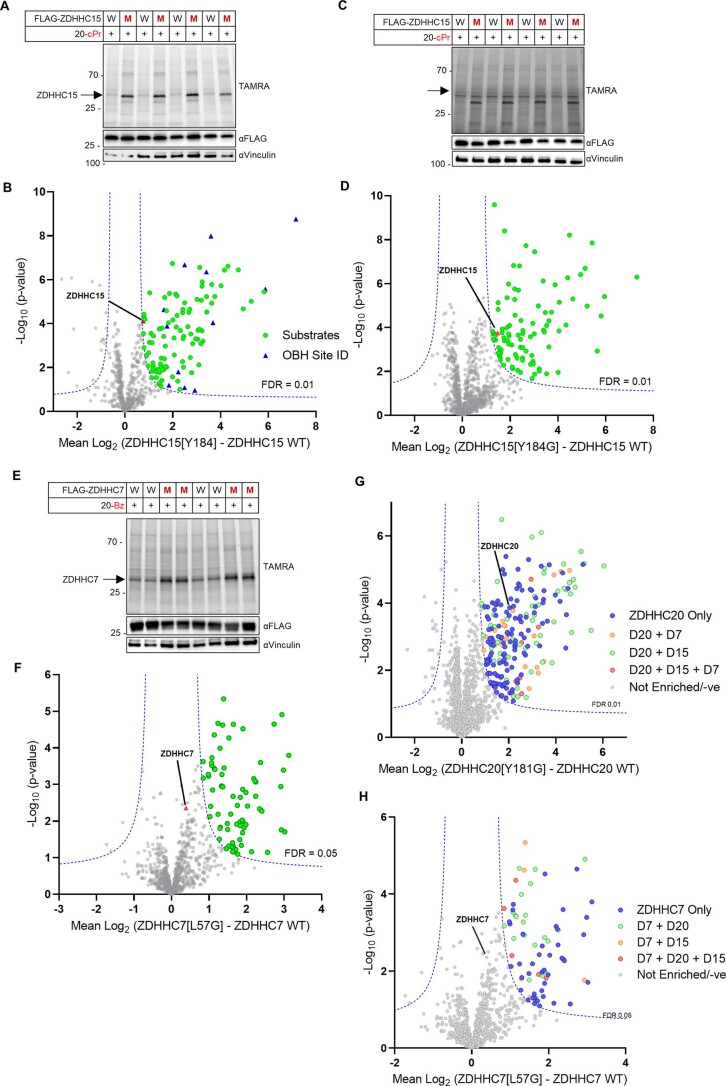
The 23 human zinc finger Asp-His-His-Cys motif-containing (ZDHHC) S-acyltransferases catalyze long-chain S-acylation at cysteine residues across an extensive network of hundreds of proteins important for normal physiology or dysregulated in disease. Here we present a technology to directly map the protein substrates of a specific ZDHHC at the whole-proteome level, in intact cells. Structure-guided engineering of paired ZDHHC 'hole' mutants and 'bumped' chemically tagged fatty acid probes enabled probe transfer to specific protein substrates with excellent selectivity over wild-type ZDHHCs. Chemical-genetic systems were exemplified for five human ZDHHCs (3, 7, 11, 15 and 20) and applied to generate de novo ZDHHC substrate profiles, identifying >300 substrates and S-acylation sites for new functionally diverse proteins across multiple cell lines. We expect that this platform will elucidate S-acylation biology for a wide range of models and organisms.


Conflict of interest statement

E.W.T. is a founder and shareholder in Myricx Pharma and receives consultancy or research funding from Kura Oncology, Pfizer, Samsara Therapeutics, Myricx Pharma, Merck Sharp and Dohme (MSD), Exscientia and Daiichi Sankyo. J.D. has acted as a consultant for AstraZeneca, Jubilant, Theras, BridgeBio and Vividion and receives research funding from Bristol Myers Squibb and Revolution Medicines. The other authors declare no competing interests.

Figures

Fig. 1
Fig. 1. ZDHHC chemical genetics.
a, S-acylation is mediated by ZDHHC loading of long-chain acyl-CoA derived from lipid biosynthesis followed by acyl transfer to a proximal Cys of a protein substrate and regeneration of apo-ZDHHC. The reversible cycle is closed by thioester hydrolysis by APTs. b, X-ray structure of human ZDHHC20 irreversibly inhibited by lipid mimic 2-bromopalmitate (PDB ID: 6BML). Inset, sterically demanding residues in the ZDHHC20 lipid-binding pocket contact the acyl chain distal to the DHHC catalytic site. c, Steric complementation between a ZDHHC ‘hole’ mutant and an alkyne-tagged ‘bumped’ lipid substrate probe enables selective loading and tag transfer to ZDHHC substrates, bypassing endogenous (WT) ZDHHCs. Fluorescence visualization and chemical proteomics are enabled by bioorthogonal conjugation to multifunctional capture reagents. Source data
Fig. 2
Fig. 2. Engineering a ‘bump’ probe and ‘hole’ mutant pair for ZDHHC20.
a, Fatty acid probes containing an alkynyl click-handle (blue), varying chain length L = 16, 18 or 20 heavy atoms in the chain (carbons + nitrogen) and an R ‘bump’ group (red)—Ac, cPr or Bz. b, Two-stage pairing strategy for a designed ZDHHC20 mutant optimizes probe chain length and then bump size to match the new binding cavity, with probe activation, selectivity over ZDHHC20 WT and transfer to a known ZDHHC20 substrate (IFITM3) optimized in parallel. cf, Bump-hole loading analysis of C-terminal FLAG-tagged ZDHHC20 WT and mutants in HEK293T cells treated with 15 μM YnPal (c,d) or 18-Ac (e,f) for 4 h (D, catalytic-dead ZDHHC20(C156S); E, empty vector; n = 3 independent biological replicates average ± s.d.). g, Probe bump-size optimization by transfer assays with HA-IFITM3 and either WT ZDHHC20 (W) or ZDHHC20(Y181G) (M) co-expression in HEK293T cells (n = 3 independent biological replicates average ± s.d.). h, Average loading and transfer activity relative to highest fluorescent/input ratio (n = 3 independent biological replicates average ± s.d.). i,j, Enzyme kinetics for WT ZDHHC20 and ZDHHC20(Y181G) treated with Pal-CoA (i) or 18-Bz-CoA (j) using a KDH assay (3). Michaelis–Menten plots generated from average reaction rate (NADH generated μM min−1, n = 3 independent experiments) ± s.d. versus lipid concentration (μM). d,f,h, The two-tailed unpaired t test of Prism 9.0 was used to determine P values and noted above relevant comparisons.
Fig. 3
Fig. 3. Chemical proteomic ZDHHC20 substrate and modification site identification.
a, Chemical proteomic OBH workflow for enrichment and identification of S-acyltransferase substrates and S-acylation sites by LC–MS/MS. b, Chemical proteomic analysis of ZDHHC20 substrates in HEK293T cells (15 µM 18-Bz, 8 h). Enrichment in ZDHHC20(Y181G) cells over WT ZDHHC20 reveals selective ZDHHC20 loading (red triangle), and significantly enriched substrates (green circles) selected for further validation (red circles), with site identification data (blue triangles; Student’s two-tailed unpaired t test, S0 = 0.5, adjusted FDR = 0.01, n = 4 independent biological replicates per condition). c,d, LC–MS/MS spectrum corroborating reported sites of CD151 (c) S-acylation at Cys11 and Cys15 and of STX7 (d) S-acylation at Cys28 (see also Extended Data Fig. 10). e, S-acylated proteome profiling using YnPal. HEK293T cells transiently transfected with WT ZDHHC20 or ZDHHC20(Y181G) were treated with 15 µM YnPal for 8 h before processing using the on-bead digestion workflow. Substrates highlighted in green had been identified using a chemical–genetic system (Student’s two-tailed unpaired t test, S0 = 0.5, adjusted FDR = 0.01, n = 4 independent biological replicates per condition). f,g, Validation of S-acylation for substrates at endogenous levels. HEK293T cells transiently transfected with WT ZDHHC20 (W) or ZDHHC20(Y181G) (M) were treated with 15 µM 18-Bz (f) or 15 µM YnPal (g) for 24 h. Lysates were clicked with biotin azide before enrichment on neutravidin magnetic beads. Representative immunoblots are shown for input and pull-down signals (n = 2 independent biological replicates). h, Venn diagram of putative ZDHHC20 substrates identified in HEK293T, MDA-MB231 and PANC1 cells. i, Statistical overrepresentation analysis of putative ZDHHC20 substrate cellular compartment (Slim)-GO terms compared to the full human genome using the PANTHER classification system showing terms with >9 −log10(P value) from an FDR-adjusted two-tailed Fisher’s exact test.
Fig. 4
Fig. 4. ZDHHC20 substrate and S-acylation site analysis.
a,b, ZDHHC20(Y181G) retains exquisite selectivity for specific cysteines on substrates IFITM3 (a) and PI4K2A (b; n = 3 independent biological replicates average ± s.d.), matching previously reported labeling, with the 18-Bz bumped probe. c, Validation of HA-STX7 S-acylation by ZDHHC20 using the bumped probe 18-Bz and S-acylation site mutants (C28A) and (C239A). Representative images (n = 3 independent biological replicates average ± s.d.) for TAMRA signal are shown, as well as for HA and FLAG immunoblots for HA pull down and input. Calnexin was used as loading control. d,e, Validation of HA-VAMP3 and HA-BCAP31 site S-acylation by ZDHHC20 using the bumped probe 18-Bz and S-acylation site mutants, VAMP3(C76A) and BCAP31(C23A). d, Cell-based transfer assays were performed without FLAG-ZDHHC20 and HA-VAMP3 enrichment, but rather with direct labeling of cell lysates by TAMRA-azide click followed by SDS–PAGE and anti-HA, anti-FLAG and anti-vinculin immunoblot analysis. e, FLAG-ZDHHC20 and HA-BCAP31 constructs were enriched before TAMRA-azide click labeling. f, Confirmation of trans-auto-S-acylation in peripheral cysteines on a catalytically dead C-HA-ZDHHC20(C156S) (D) by a mutant C-FLAG-ZDHHC20(Y181G) (M) with 15 μM 18-Bz. Catalytically dead C-FLAG-ZDHHC20(Y181G) (DM) did not transfer the probe to D. Cells transfected with an empty vector (E) were used as negative control. HA- and FLAG-tagged ZDHHC20 constructs were transiently cotransfected into HEK293T cells and treated with 15 μM 18-Bz for 4 h. After cell lysis, constructs were separately enriched on anti-HA and anti-FLAG resins, clicked with TAMRA-azide and separated by SDS–PAGE. Loading and input were visualized by in-gel fluorescence and immunoblot, respectively. The average (n = 3 independent biological replicates) loading and transfer activity were reported as a percent of the maximal fluorescent:input ratios ± s.d. a,c,f, The two-tailed unpaired t test of Prism 9.0 was used to determine P values and noted above relevant comparisons.
Fig. 5
Fig. 5. Chemical–genetic analysis under inducible low-expression of ZDHHC20(Y181G).
a, Profile of WT ZDHHC20 (W) or ZDHHC20(Y181G) Flp-In 293 T-REx cell lines treated with 18-Bz (15 µM, 24 h). Lysates were clicked with TAMRA azide and then analyzed by in-gel fluorescence and SDS–PAGE. Note that the asterisk represents YG-dependent labeling of substrate protein bands. b, Comparison of protein expression levels between doxycycline induction of Flp-In 293 T-REx cells and overexpression by transient expression in HEK293T cells. Representative immunoblots are shown for FLAG at high or low exposure, to probe for ZDHHC20 WT versus ZDHHC20(Y181G), and calnexin as loading control (n = 3 independent biological replicates). c, In Flp-In 293 T-REx cells ZDHHC20(Y181G) retains exquisite selectivity for its substrate IFITM3 with the 18-Bz bumped probe, as seen in prior experiments. d, Chemical proteomic analysis of ZDHHC20 substrates in Flp-In 293 T-REx cells (15 µM 18-Bz, 24 h). Enrichment in T-REx ZDHHC20(Y181G) cells over T-REx WT ZDHHC20 reveals selective ZDHHC20 modification of substrates (green) (Student’s two-tailed unpaired t test, S0 = 0.5, adjusted FDR = 0.01, n = 4 independent biological replicates per condition). e,f, Validation of S-acylation for T-REx ZDHHC20(Y181G) substrates at endogenous levels. Flp-In 293 T-REx cells, WT ZDHHC20 (W) or ZDHHC20(Y181G) (M), induced with doxycycline for 24 h, were treated with 15 µM 18-Bz (e) or YnPal (f) for 24 h. Lysates were clicked with biotin azide before enrichment on neutravidin magnetic beads. Representative immunoblots are shown for input and pull-down signals (n = 2 independent replicates).
Fig. 6
Fig. 6. Extension of ZDDHC chemical genetics to ZDHHC3, 7, 11 and 15.
a, Structure-guided ZDHHC engineering exemplified for ZDHHC7 (see also Extended Data Figs. 9 and 10). ZDHHC7 homology model (yellow/orange) overlayed on experimental ZDHHC20 structure (dark green) identifies a potential hole-generating amino acid (Leu57) on an adjacent helix in the vicinity of ZDHHC20 Tyr181; lipid density (blue mesh), and length/size probe analysis identifies a mutant/probe pair (ZDHHC7(L57G)/20-Bz) with optimal activity and selectivity over WT ZDHHC7. b, Bump-hole analysis of N-FLAG-tagged WT ZDHHCs or mutant ZDHHCs ZDHHC3(I182G) (D3), ZDHHC7(L57G) (D7), ZDHHC11(M181A) (D11) and ZDHHC15(Y184G) (D15) in HEK293T cell-based loading assays using 15 µM corresponding optimized probe. c, Average (n = 3 independent biological replicates) loading reported as a percent of maximal fluorescent:input ratio ± s.d. P values determined by Prism 9.0 two-tailed unpaired t test statistical module and noted above relevant comparisons. d, ZDHHC15 substrate discovery in HEK293T cells treated with 15 µM 20-cPr in HEK293T cells using the OBH workflow. In total, 107 chemical–genetic ZDHHC15 substrates were identified (Student’s two-tailed unpaired t test, S0 = 0.5, adjusted FDR = 0.01, n = 4 independent biological replicates). Substrates unique or in common with parallel analyses for DHHC7 and DHHC20 in HEK293T cells are highlighted (Extended Data Fig. 10). e, Overlap of chemical–genetic ZDHHC substrates identified in HEK293T cells. Of 301 total substrates, only 87 are shared by 2 or more family members, suggesting distinct substrate pools for each ZDHHC.
Extended Data Fig. 1
Extended Data Fig. 1. Establishing assay conditions to measure ZDHHC20 lipid-loading.
(a-b) Catalytically dead ZDHHC20 is appreciably labeled by YnPal at peripheral cysteine sites. FLAG-tagged WT and ZDHHC20[C156S] constructs were transfected in HEK293T cells and treated with the indicated concentration of YnPal for 4 h. After lysis and IP with anti-FLAG resin, samples were subjected to CuAAC with TAMRA azide and separated by SDS-PAGE. ZDHHC20 loading and input were measured by in-gel fluorescence and anti-ZDHHC20 immunoblot (n = 3 independent biological replicates). (c-d) Thioester dependence of ZDHHC20 labeling was demonstrated upon treatment of YnPal and C18-Bz treated samples with 0.8 M neutralized NH2OH following IP and CuAAC with TAMRA azide (n = 3 independent biological replicates). (e-f) Time-course measuring 15 µM YnPal labeling of ZDHHC20 WT expressing HEK293T cells (n = 3 independent biological replicates). (g-h) Labeling activity of the indicated concentrations of YnPal in FLAG-tagged ZDHHC20[Y181G] and ZDHHC20[Y181G/C156S] expressing HEK293T cells (n = 3 independent biological replicates). The average (n = 3 independent biological replicates) loading (b, d, f and h) was reported as a percent of the maximal fluorescent: input ratios ± S.D. between treatments with and without hydroxylamine. (i-l) Probe chain-length was optimized against ZDHHC20[Y181G] using cell-based loading (i-j) and transfer (k-l) assays in HEK293T using ZDHHC20 WT (W) and ZDHHC20[Y181G] (M). (i) HEK293T cells were treated with 15 µM acetyl bumped probes of L = 16, 18 and 20 for 4 h and enzyme loading assessed by in-gel fluorescence following anti-FLAG IP and CuAAC with TAMRA azide (n = 3 independent biological replicates). (k) HEK293T cells co-expressing ZDHHC20[Y181G] and HA-Ifitm3 were treated with 15 µM 18-Ac or 20-Ac for 4 h with loading and transfer of the probe assessed following by anti-FLAG/anti-HA IP and CuAAC with TAMRA azide (n = 3 independent biological replicates). (j-l) The average (n = 3 independent biological replicates) loading and transfer activity were reported as a percent of the maximal fluorescent/input ratios ± S.D. The two tailed unpaired t-test of Prism 9.0 was used to determine p-values and are note above relevant comparisons.
Extended Data Fig. 2
Extended Data Fig. 2. Establishing kinetic parameters for an optimal Y181G-ZDHHC20 bump probe pair.
(a) Wild-type (WT), Y181G (YG), C156S (CS) and Y181G/C156S (YGCS) FLAG-tagged ZDHHC20 constructs were transfected into HEK293T cells and purified by anti-FLAG agarose affinity chromatography. After enzyme elution with 3X FLAG-peptide, buffer was exchanged using 50 kDa M.W. cut-off protein concentrator tubes and sample concentration determined using a BSA standard curve. All samples were run on SDS-PAGE gels and protein visualized by Coomassie staining (n = 2 independent experiments). (b) An enzyme-coupled assay monitoring ZDHHC20 autoacylation was established using commercial α-ketoglutarate dehydrogenase enzyme (KDH) along with its substrates α-ketoglutarate (α-KG), thiamine pyrophosphate (TPP) and NAD+. Optimization of α-ketoglutarate dehydrogenase (KDH) (c) and WT ZDHHC20 (d) concentrations. Pal-CoA (e) and 18-Bz-CoA (f) KDH activities were determined in the absence of ZDHHC20, to establish background rates for each probe. (g) 18-Bz-CoA displayed significant background activity in the KDH assay without ZDHHC20. Reaction rates for ZDHHC20[C156S] (h) and ZDHHC20[Y181G, C156S] (i) treated with Pal-CoA or 18-Bz-CoA. Michaelis-Menten plots generated by plotting average (n = 3 independent experiments) reaction rates (NADH generated (µM)/min) ± S.D.) versus lipid concentration (µM) using Prism 9.0. For reactions with 18-Bz-CoA, the basal rates at all concentrations tested were subtracted from the corresponding total reaction rates.
Extended Data Fig. 3
Extended Data Fig. 3. Optimization of conditions for characterization of substrates using 18-Bz in ZDHHC20[Y181G] expressing cells.
FLAG-tagged ZDHHC20 WT and ZDHHC20[Y181G] expressing HEK293T cells were treated with the indicated concentration of 18-Bz (a-b) for 4 h in cell-based loading assays (n = 3 independent biological replicates). (c-d) FLAG-tagged ZDHHC20[Y181G] and HA-Ifitm3 expressing HEK293T cells were treated with 15 µM 18-Bz for the indicated time in cell-based loading and transfer assays (n = 3 independent biological replicates). (e-f) FLAG-tagged ZDHHC20 WT and ZDHHC20[Y181G] expressing HEK293T cells were treated with 15 µM 18-Bz for the indicated times (n = 3 independent biological replicates). Lysates were clicked with TAMRA azide then analyzed by in-gel fluorescence and SDS-PAGE; note YG-dependent labeling of substrate protein bands (*). Input was assessed by anti-ZDHHC20 (D20) immunoblot. The average (n = 3 independent biological replicates) loading (b, d & f) and transfer (d) were reported as a percent of the maximal fluorescent: input ratios ± S.D. (g-h) The effect of FBS concentration on ZDHHC20 loading and transfer. (g) FLAG-tagged wild-type (WT) or ZDHHC20[Y181G] (M) and HA-Iftim3 expressing HEK293T cells were treated with 15 µM YnPal or 18-Bz in the presence of 0.5 or 10% FBS for 4 h in cell-based transfer assays. (h) The average (n = 3 independent biological replicates) loading and transfer were reported as a percent of the maximal fluorescent: input ratio ± S.D. The two tailed unpaired t-test of Prism 9.0 was used to determine p-values and noted above the relevant comparisons.
Extended Data Fig. 4
Extended Data Fig. 4. Metabolomic analysis of HEK293T cells.
HEK293T cells were treated with 30 µM YnPal or 18-Bz for 2 h in media containing 0.5% FBS. Cells were lysed, and metabolites extracted (see Supplementary Methods, Metabolomics). Polar metabolites (including probe and probe-CoA molecules) were analyzed by LC-MS. (a) Probes and probe-CoA molecules were detected by LC-HRMS in positive and negative modes. Features from sample pooled biological controls (PBQCs, solid lines, upper panel) and authentic standards (dotted lines, lower panel) had identical retention times (shown). 13C3-Malonyl-CoA (black dotted line) was used as an internal standard. Retention times (tR) and mass ranges (m/z) used for each molecule are shown. (b-e) Probe-CoA identifications were confirmed by LC-MS/MS in positive mode. (b) Panel shows an LC-MS/MS chromatogram of sample PBQCs, using selected ion monitoring (SRM) specific for probe-CoAs. Retention times (tR) and normalized intensities (NL) for each molecule are shown. (c) SRM transitions (precursor and most abundant product [M + H]+ ions) used for identification of probe-CoAs. (d) Upper panel show chemical structures, formulae, and exact masses of 18-Bz-CoA. Lower panel show spectra of major LC-MS/MS product ions for 18-Bz-CoA, with colors equivalent to fragmentations depicted in the upper panel. Product ion of m/z 726.43 (18-Bz-CoA) is equivalent to the ion m/z 628.41, but where an acyl chain moiety is retained. Abundance is shown relative to the most abundant product ion (m/z 628.41 for 18-Bz-CoA. (e-i) Lipidomic analysis of cells treated with 18-bump series. HEK293T cells were treated with DMSO and 15 µM YnPal, 18-cPr and 18-Bz for 4 h. After treatment, cells were lysed, extracted with tert-butyl methyl ether/methanol/water and sample lipids analyzed by UHPLC-MS/MS in the positive and negative mode. (e-g) Chemical structures and MS/MS spectra of selected PC, PE and TG lipid species incorporating an 18-Bz lipid side-chain. PC and PE spectra were acquired in negative polarity and TG spectrum was acquired in positive polarity. Note that TG species with an 18-Bz side chain preferentially formed the [M + H]+ ion, in contrast to endogenous TG species where the predominant ion forms are [M + NH3]+ and [M+Na]+, presumably due to facile protonation at the 18-Bz amide moiety. (h) Summed ion intensity of all endogenous lipid species identified within each major lipid class plotted using Prism 9.0. Box and whisker plots represent median values (center lines) and 25th and 75th percentiles (box limits) with Tukey whiskers, n = 5 independent experiments. FA, fatty acid; NL, neutral loss; PC, phosphatidylcholine; PE, phosphatidylethanolamine; TG, triacylglycerol; PI, phosphatidylinositol; PS, phosphatidylserine; Cer, ceramide. PC-O, ether-linked PC; PE-O, ether-linked PE.
Extended Data Fig. 5
Extended Data Fig. 5. Localization of ZDHHC20 WT and Y181G mutant in HEK293T cells by overexpression.
(a) Left: representative confocal microscopy images showing average signal of Z-stacks of HEK293T cells transiently co-expressing ZDHHC20 WT HA-tagged and Y181G mutant FLAG-tagged. Each image shows signal for HA (magenta), FLAG (green), p-cadherin as plasma membrane marker (yellow), nucleus (blue) and a composite image of all signals. Scale bar at the bottom right marks 20 mm, while the other white line highlights the region of interest (ROI) used for image analysis. Right: plot showing normalized fluorescence signal for each of the channels in the ROI (1 biological replicate). (b) As a, but with using Gm130 as Golgi marker (1 biological replicate).
Extended Data Fig. 6
Extended Data Fig. 6. ZDHHC substrate profiling in different cell lines.
(a) Full gel and western blots of all replicates corresponding to the chemical proteomics ZDHHC20 substrate identification (Fig. 3b) performed in HEK293T cells. A portion of the lysate was clicked with TAMRA azide for analysis by in-gel fluorescence. The bands present at ~35 kDa in ZDHHC20[Y181G] (M) lanes but absent in WT ZDHHC20 lanes indicate selective loading of 18-Bz on ZDHHC20[Y181G] over WT-ZDHHC20. Anti-FLAG WB indicates similar expression levels of WT construct compared to ZDHHC20[Y181G] construct. Vinculin is used as loading control (n = 4 independent biological replicates). (b-e) Chemical proteomics ZDHHC20 substrate detection with 18-Bz probe (15 µM) in (b) PANC1 cells and (C) MDA-MB-231 cells. Cells were transiently transfected with WT ZDHHC20 versus ZDHHC20[Y181G] (M) then clicked with biotin azide and enriched on neutravidin agarose for proteomic processing. Significantly enriched putative substrates (Student’s two tailed unpaired t-test S0 - 0.5, adjusted FDR - 0.01) are shown as green circles, hits with site identification data are shown in as blue triangles and other validated substrates are highlighted as red circles. 200 putative ZDHHC20 substrates are identified in (B) PANC1 cells and 50 putative substrates in (c) MDA-MB-231 cells. (d-e) Gel and western blots corresponding to the volcano plot in (a-b) where a portion of the lysate was clicked with TAMRA azide as described in B (n = 4 independent biological replicates). (f) Statistical over/underrepresentation analysis of putative ZDHHC20 substrate biological process GO-terms compared to a reference list containing reported S-acylated proteins (SwissPalm) using the PANTHER classification system showing terms with >1.5 -Log10(p-value) from an FDR adjusted Fisher’s exact two tailed test. (g-h) PTRH2 Site ID analysis and quantification. (g) Validation of HA-PTRH2 S-acylation by ZDHHC20 using the bumped probe 18-Bz and S-acylation site mutants. Representative images (n = 3 independent biological replicates) for TAMRA signal are shown, as well as for HA and FLAG immunoblots for HA pull down and input. Calnexin was used as loading control. (h) Bar plot showing the ratio of TAMRA fluorescence and HA pulldown signal of PTRH2 cysteine mutants as a percentage of WT PTRH2 ratio. The two tailed unpaired t-test statistical module of Prism 9.0 was used to calculate p-values and noted above relevant comparisons. (i) Profiling of Flp-in T-Rex substrates ZDHHC20 cell lines. The average (n = 3 independent biological replicates) Fold change of FLAG signal is reported as a percent of the maximal ratios ± S.D. The unpaired t-test statistical module of Prism 9.0 was used to determine p-values and noted above relevant comparisons. Related to main Fig. 5b.
Extended Data Fig. 7
Extended Data Fig. 7. IFITM3 labeling in ZDHHC20 knock-out HEK293T cells.
(a) Untreated (UT) or gRNA/CAS9 treated (pSpCas9(BB)-2A-Puro, PX459 plasmid) HEK293T cells were probed with anti-ZDHHC20 (D20) and –vinculin antibodies. Cells treated with gRNA1/CAS9 resulted in knockdown (KD); whereas cells treated with gRNA2/CAS9 yielded two ZDHHC20-knockout (D20-KO) clones: KO1 and KO2 (n = 2 independent biological replicates). (b) WT or KO2 HEK293T cells were transfected with HA-IFITM3 and empty vector or C-FLAG-tagged ZDHHC20. Cells were then treated with 15 mM YnPal for 4 h before being harvested and lysed. IFITM3 and D20 were enriched in one pot with a mix of anti-HA and –FLAG resins before being treated with TAMRA-azide and click reagents. Tagged proteins were eluted from beads with 1X Laemmli buffer and separated by SDS-PAGE. YnPal ZDHHC20-loading and transfer to IFITM3 and input were visualized by in-gel fluorescence and anti-HA and -FLAG immunoblot, respectively (n = 2 independent biological replicates). (c) The average (n = 3 independent biological replicates) loading and transfer activity was reported as a percent of the maximal D20 fluorescent: input ratio and as a percent of the WT IFITM3 (empty vector) fluorescent: input ratio ± S.D. The two tailed unpaired t-test of Prism 9.0 was used to determine p-values and noted above relevant comparisons (d-g) WT HEK293T cells, two ZDHHC20 KO clones, and one partial knockdown (KD) clone were treated with 15 μM YnPal for 8 h. As a control for lipidation, HEK293T cells were treated with palmitic acid (Pal) and also taken through the experiment. Samples were then clicked with biotin-TAMRA-azide, 10% of which was analyzed by SDS-PAGE, in-gel fluorescence, and anti-tubulin western blot (d) (n = 3 independent biological replicates). The remainder was enriched on dimethylated neutravidin beads and digested for LC-MS/MS LFQ analysis. (E-G) Whilst a small number of proteins are identified as being significantly enriched/depleted (Student’s two tailed unpaired T-test S0 – 0.1, adjusted FDR – 0.05), they are few in number and none are consistently found which correspond to our putative chemical genetic substrates found in HEK293T cells. (f) Analysis of YnPal treated cells against Pal shows a large number a potentially lipidated proteins have been identified, with many well validated S-acylation proteins identified, some of which have been highlighted in blue.
Extended Data Fig. 8
Extended Data Fig. 8. Cloning of TurboID chimeras and optimization of conditions for TurboID-enabled proximity labeling.
(a) Schematic representation of TurboID fusion proteins used for proximity labeling experiments. (b-c) Confirmation of the expression of each fusion protein by western blot after generation of ‘Jump-in’ cell lines using either anti-V5 antibody (b) (n = 2 independent biological replicates) or an anti-GFP antibody (c) (n = 2 independent biological replicates). The labeling efficiency of the TurboID biotin ligase was confirmed by the addition of 500 μM biotin for the indicated times. Only those cells expressing the ligase show an increase in the biotinylation of proteins, as determined by Streptavidin conjugated HRP, compared to the UT HEK293T cells, and also in a time dependent manner. (d) Volcano plot showing the enrichment of proteins when comparing the C-terminally tagged ZDHHC20 with the N-terminally tagged construct (Student’s two tailed unpaired t-test S0 – 0.1, adjusted FDR 0.01). There does appear to be a preference for either the N- or C- terminus for some interactors, none of these correspond to our chemical genetic hits. (e) Volcano plot showing the enrichment of proteins when comparing the N-terminally tagged ZDHHC20 with the Turbo GFP construct (Student’s two tailed unpaired t-test S0 – 0.1, adjusted FDR 0.01). (f) TurboID-based proximity-labeing enabled detection of ZDHHC20 (D20) interactors. Volcano plot showing the mean log2 difference in protein group intensities between N-TurboID-ZDHHC20 and TurboID-GFP clones (Student’s two tailed unpaired T-test S0 – 0.1, adjusted FDR 0.01).
Extended Data Fig. 9
Extended Data Fig. 9. Bump optimization for mutants of ZDHHCs 3, 7, 11 and 15.
(a-h) WT (W in tables) and the indicated mutants of N-FLAG-tagged ZDHHC family members, ZDHHC3 (a-b), ZDHHC7 (c-d), ZDHHC11 (e-f), and ZDHHC15 (g-h), were subjected to loading assays with probes containing optimal chain length and Ac, cPr and Bz bump groups. WT and mutant constructs were transiently transfected into HEK293T cells and treated with 15 µM probe for 4 h. After cell lysis, constructs were immunoprecipitated on anti-FLAG resin, clicked with TAMRA-azide and separated by SDS-PAGE. Loading and input were visualized by in-gel fluorescence and anti-FLAG immunoblot, respectively. The average (n = 3 independent biological replicates) loading (b, d, f, and h) was reported as a percent of the maximal fluorescent: input ratios ± S.D. The two tailed unpaired t-test of Prism 9.0 was used to determine p-values and noted above relevant comparisons. (i) Thioester dependence of zDHHC7, zDHHC15, zDHHC3 and zDHHC11 labeling with bumped probes. HEK293T cells transiently expressing the acyltransferase mutants (M) were treated with C20-Bz (ZDHHC7), C20-cPr (ZDHHC15, ZDHHC11) or C16-cPr (ZDHHC3). Following CuAAC with TAMRA azide, lysates were treated with or without 0.8 M neutralized NH2OH. Representative images of 3 biological replicates (n = 3).
Extended Data Fig. 10
Extended Data Fig. 10. Proteomic analysis of ZDHHC15 and ZDHHC7 chemical genetic systems.
(a-b) Gels and corresponding volcano plots for HEK293T cells treated with 15 μM 20-cPr for 8 h in the presence of ZDHHC15 WT or ZDHHC15[Y184G]. (a) Lysates were subjected to CuAAC with TAMRA azide to assess probe incorporation and expression levels of FLAG-tagged ZDHHC and the loading control vinculin. (b) Volcano plot showing enrichment of putative ZDHHC15 substrates by ZDHHC15[Y184G] (Student’s two tailed unpaired T-test, S0 0.5, adjusted FDR 0.01, n = 4 independent biological replicates) of matched lysates processed by OBH workflow and analyzed by LC-MS/MS. The positive control ZDHHC15 (red triangle) shows enrichment and many sites of modification (blue triangle) were identified through our OBH workflow. (c-d) Gels and corresponding volcano plots for PANC1 cells treated as described in (a-b). (e-f) Gels and corresponding volcano plots for HEK293T cells treated with 15 μM 20-Bz for 8 h in the presence of ZDHHC7 WT or ZDHHC7[L57G]. (e) Lysates were subjected to CuAAC with TAMRA azide to assess probe incorporation and expression levels of FLAG-tagged ZDHHCs and the loading control vinculin. (f) Volcano plot showing enrichment of putative ZDHHC7 substrates by ZDHHC7[L57G] (Student’s two tailed unpaired T-test, S0 0.5, adjusted FDR 0.05, n = 4 independent biological replicates) of matched lysates processed by OBH workflow and analyzed by LC-MS/MS. (g-h) Overlap among ZDHHC substrate profiles for ZDHHC7, ZDHHC15, and ZDHHC20 (Student’s two tailed unpaired t-test, S0 0.5, adjusted FDR 0.05, n = 4 independent biological replicates). (g) Volcano plot of ZDHHC20 OBH shown in Fig. 3b, with unique putative substrates; putative substrates shared with ZDHHC7 and/or ZDHHC15 highlighted. (h) Volcano plot of ZDHHC7 OBH shown in Supplementary Fig. 17 with unique putative substrates; putative substrates shared with ZDHHC15 and/or ZDHHC20 highlighted.

References

    1. Aebersold, R. et al. How many human proteoforms are there? Nat. Chem. Biol.14, 206–214 (2018). - PMC - PubMed
    1. Adhikari, S. et al. A high-stringency blueprint of the human proteome. Nat. Commun.11, 5301 (2020). - PMC - PubMed
    1. Rana, M. S. et al. Fatty acyl recognition and transfer by an integral membrane S-acyltransferase. Science359, eaao6326 (2018). - PMC - PubMed
    1. Sanders, S. S. et al. Curation of the mammalian palmitoylome indicates a pivotal role for palmitoylation in diseases and disorders of the nervous system and cancers. PLoS Comput. Biol.11, e1004405 (2015). - PMC - PubMed
    1. Lanyon-Hogg, T., Faronato, M., Serwa, R. A. & Tate, E. W. Dynamic protein acylation: new substrates, mechanisms, and drug targets. Trends Biochem. Sci.42, 566–581 (2017). - PubMed

Substances

LinkOut - more resources