. 2024 Jan;6(1):78-93.
doi: 10.1038/s42255-023-00945-1. Epub 2024 Jan 8.

Depletion of JunB increases adipocyte thermogenic capacity and ameliorates diet-induced insulin resistance

Affiliations

Depletion of JunB increases adipocyte thermogenic capacity and ameliorates diet-induced insulin resistance

Xing Zhang et al. Nat Metab. 2024 Jan.

Abstract

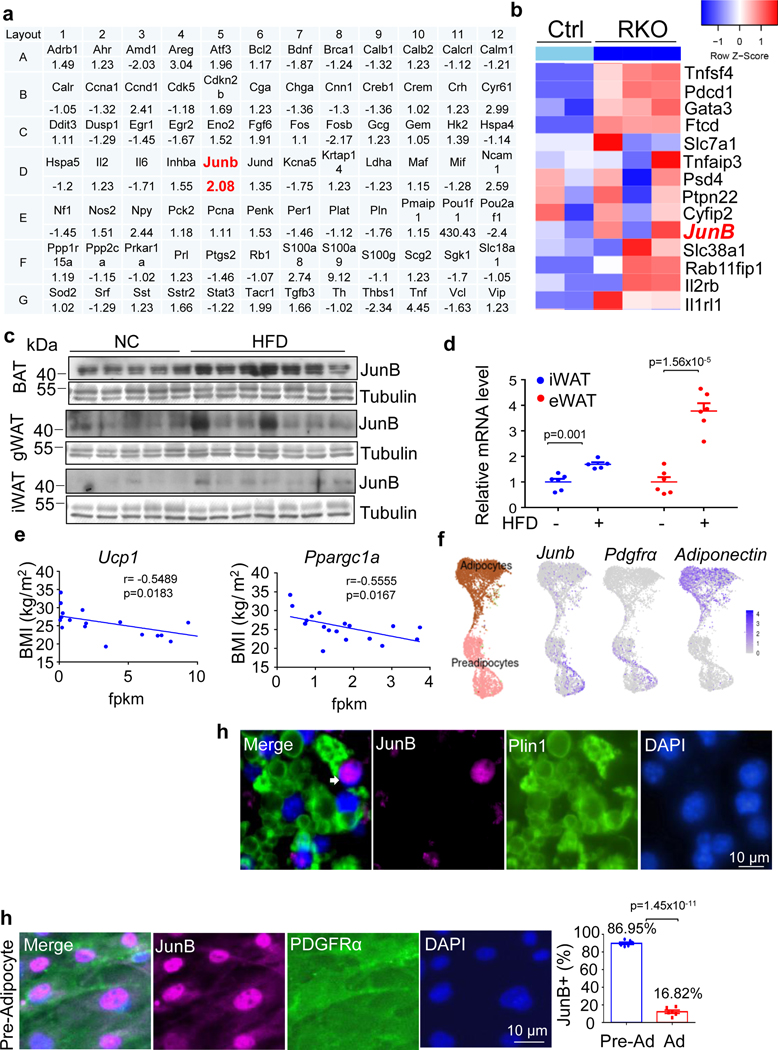
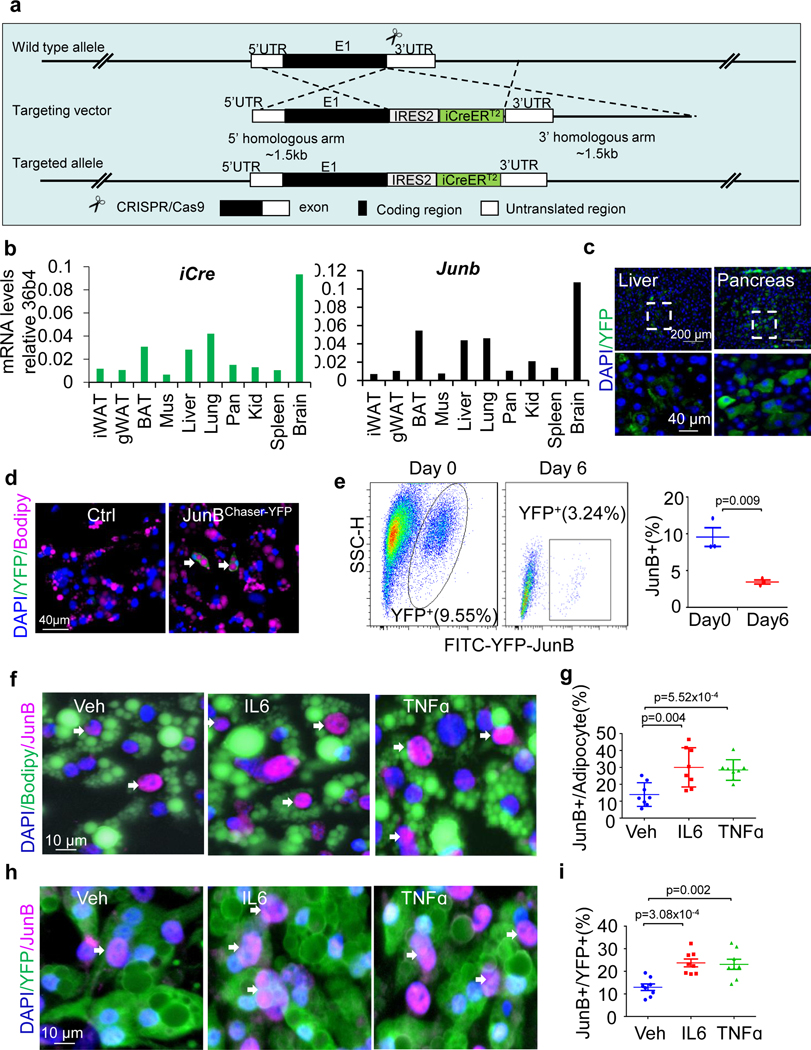
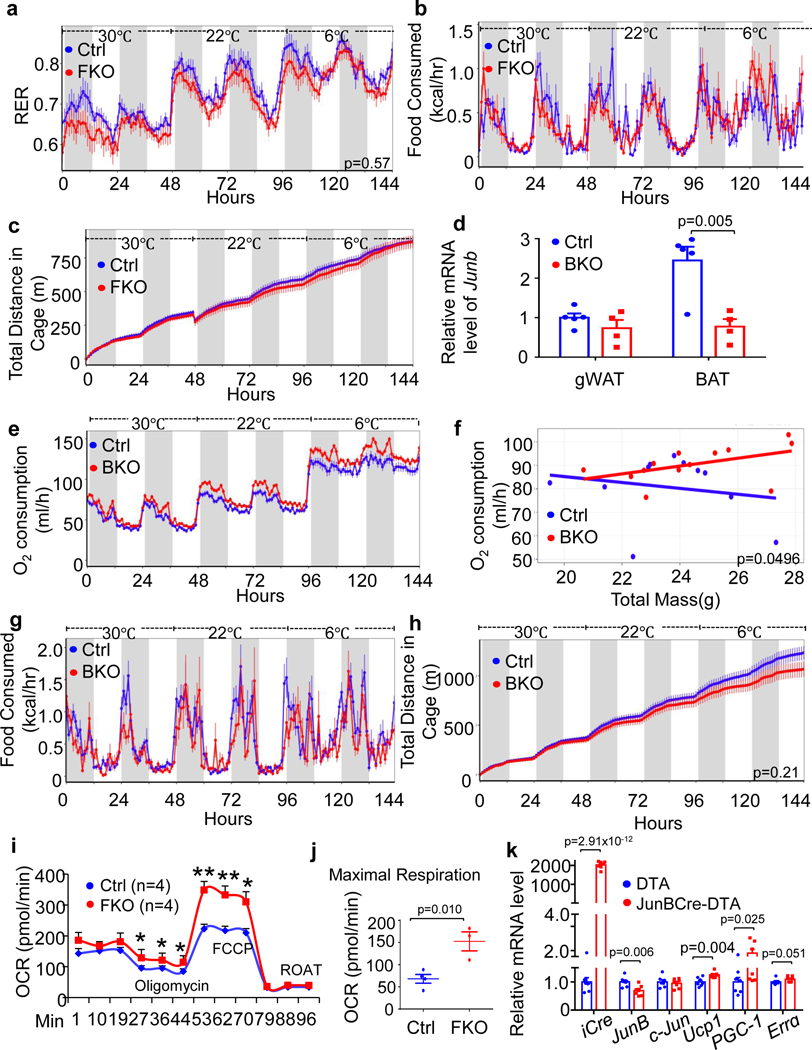
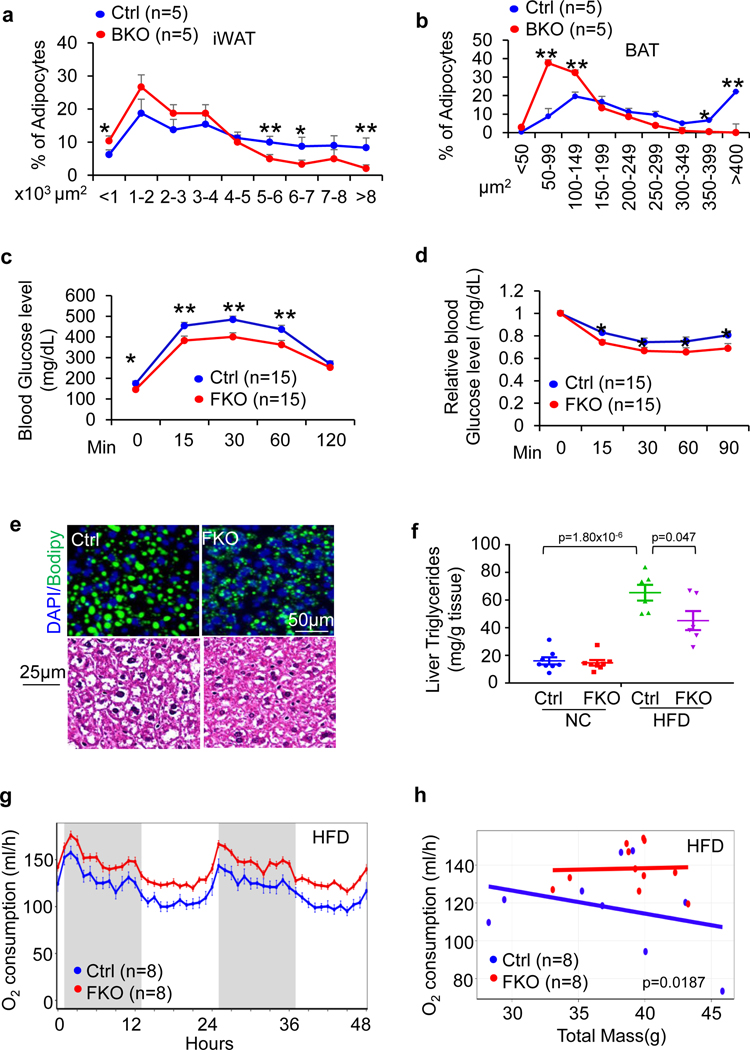
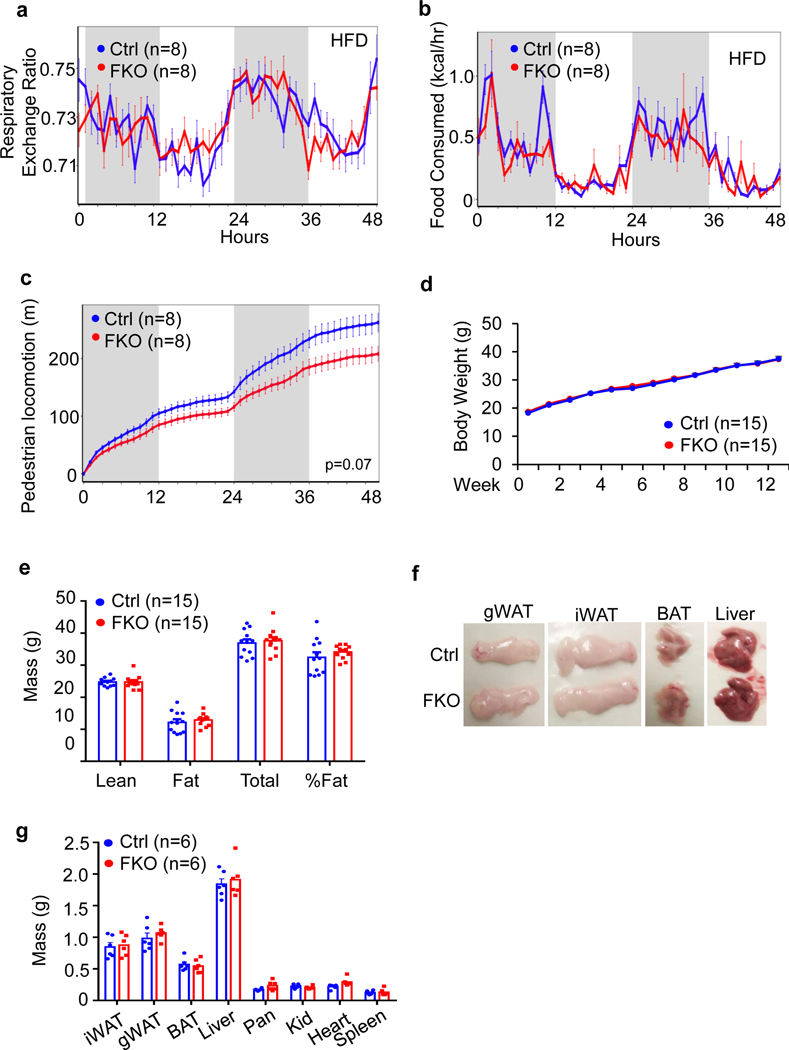
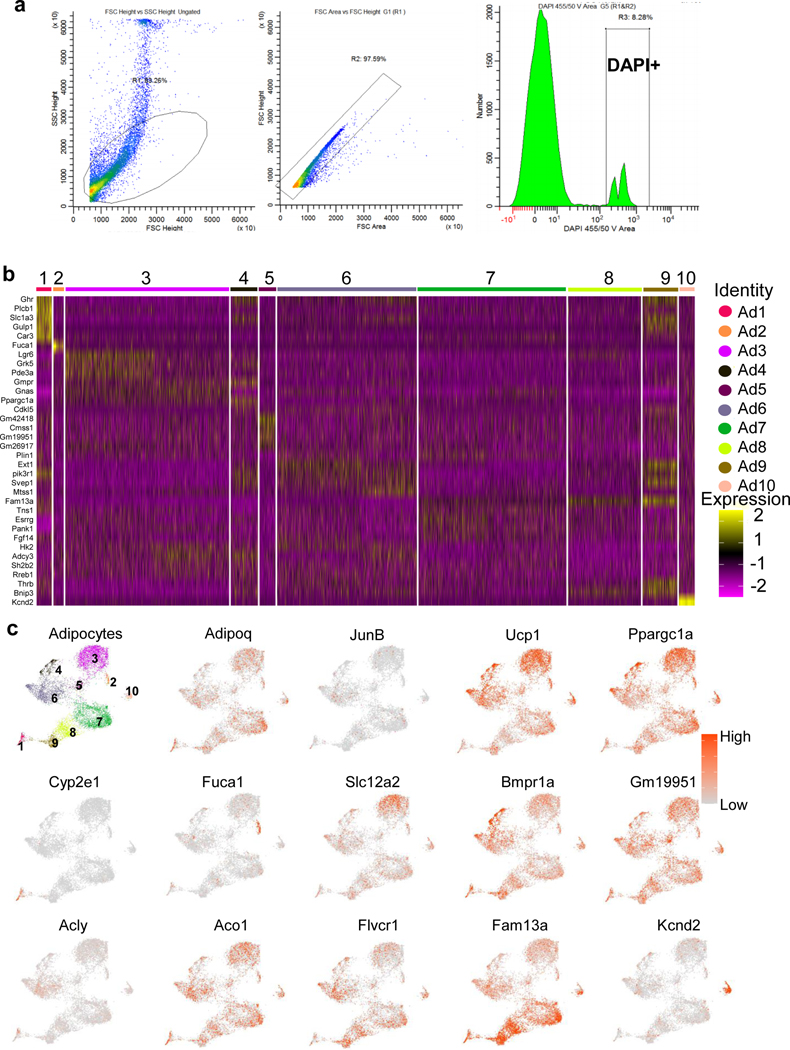
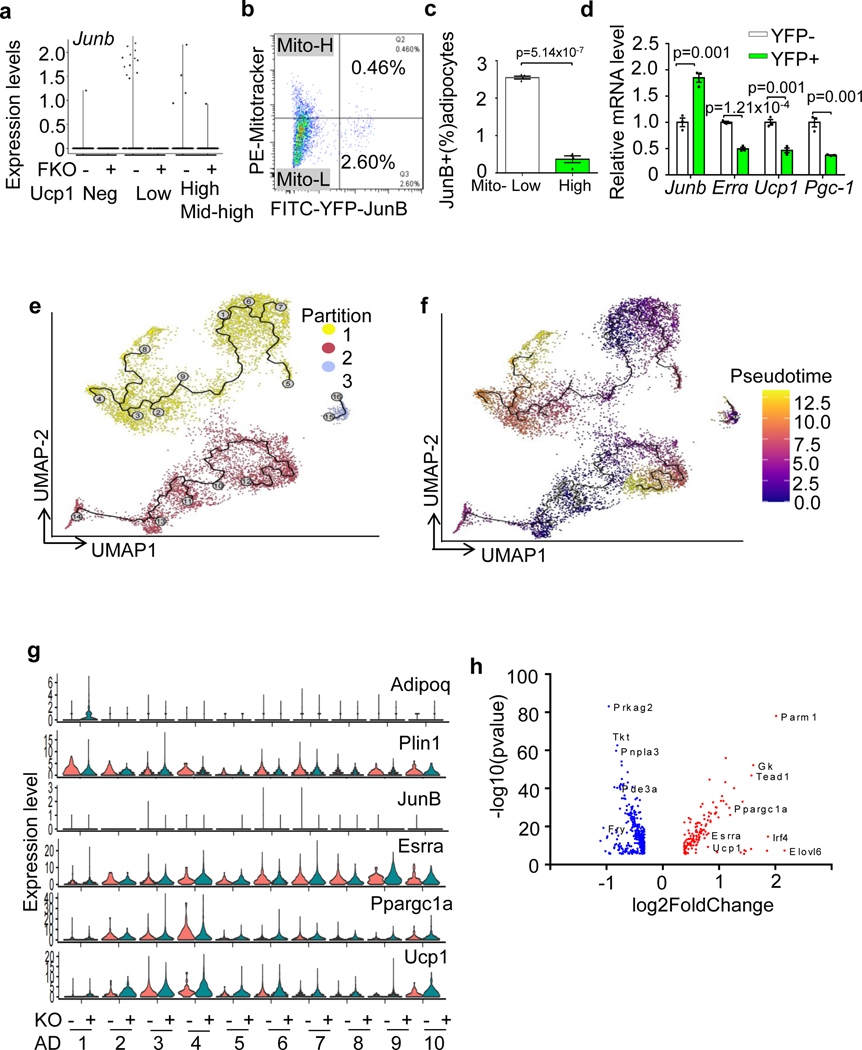
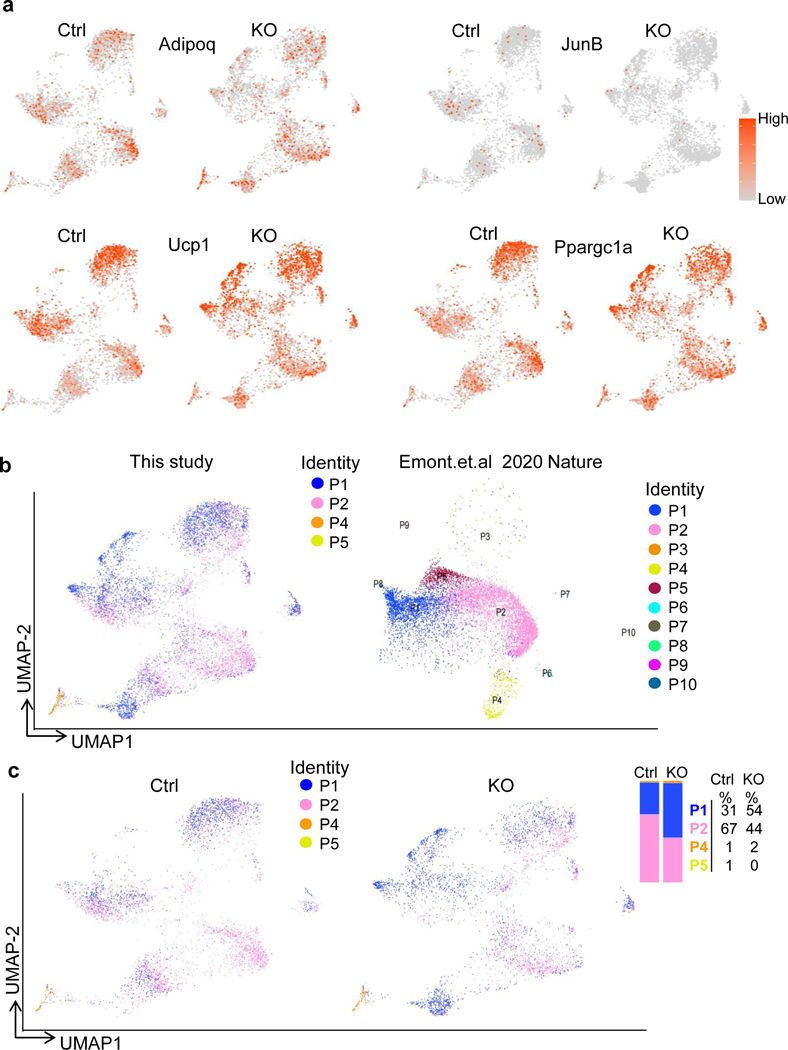
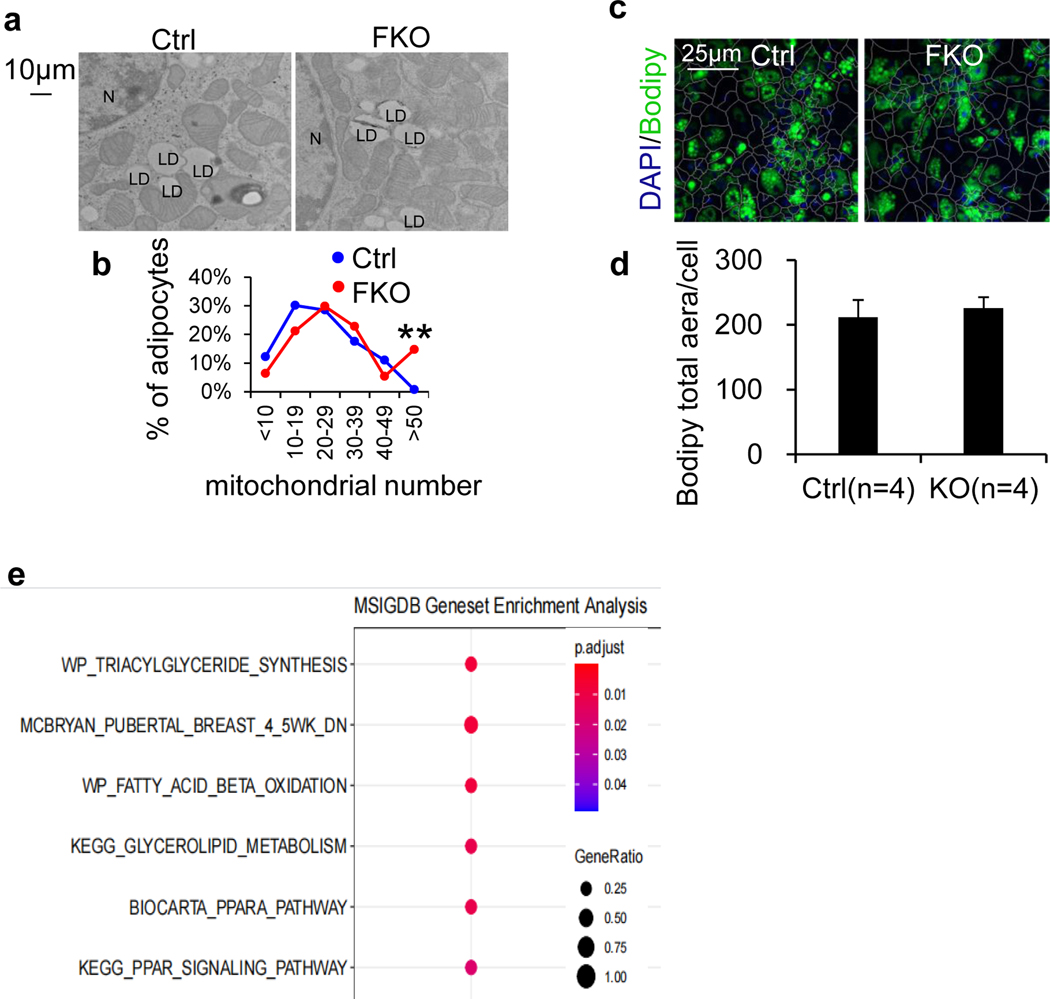
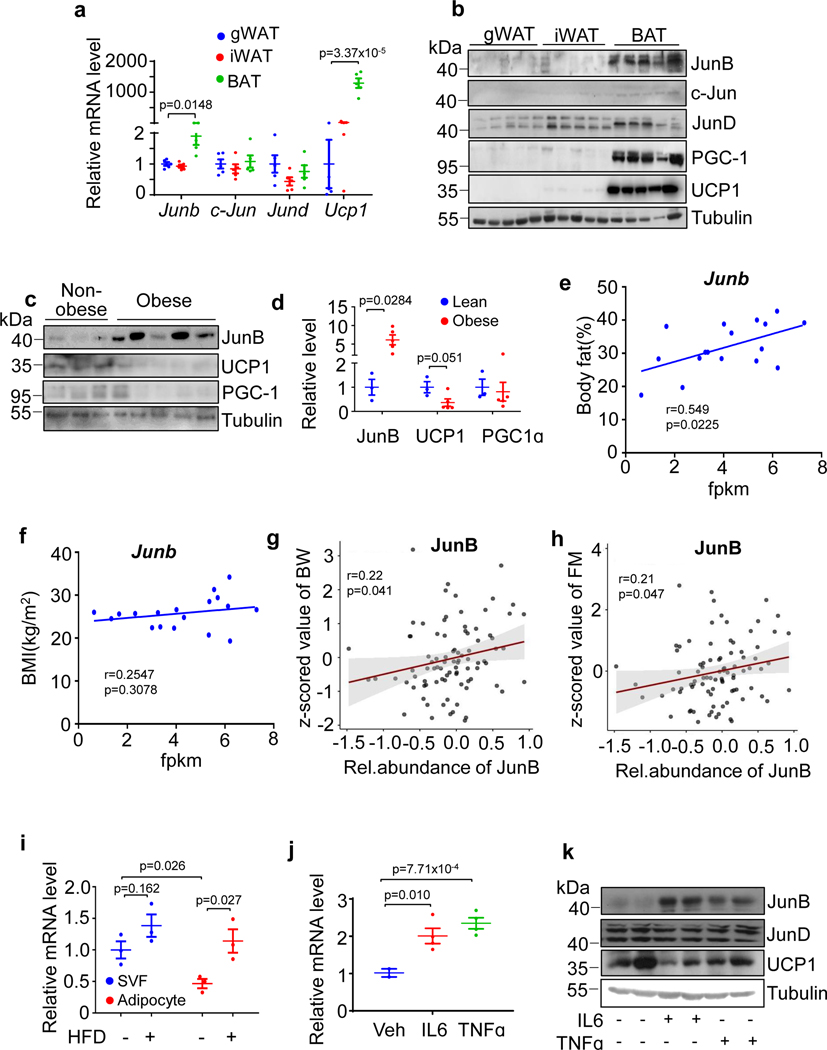
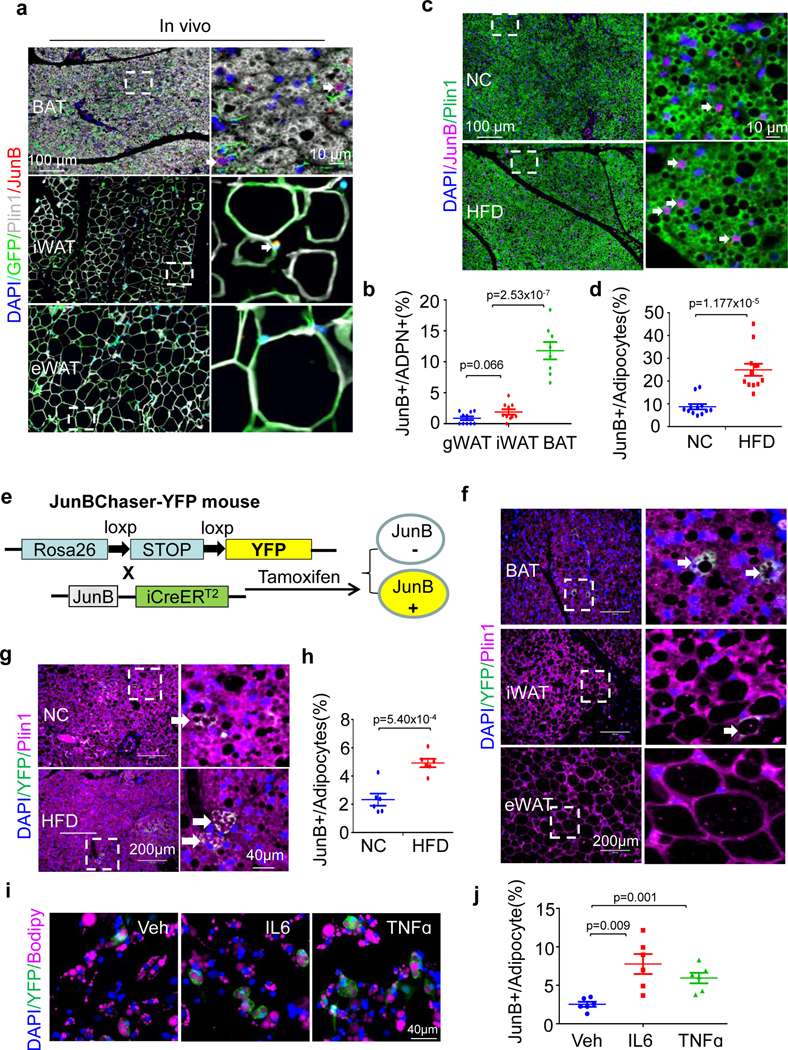
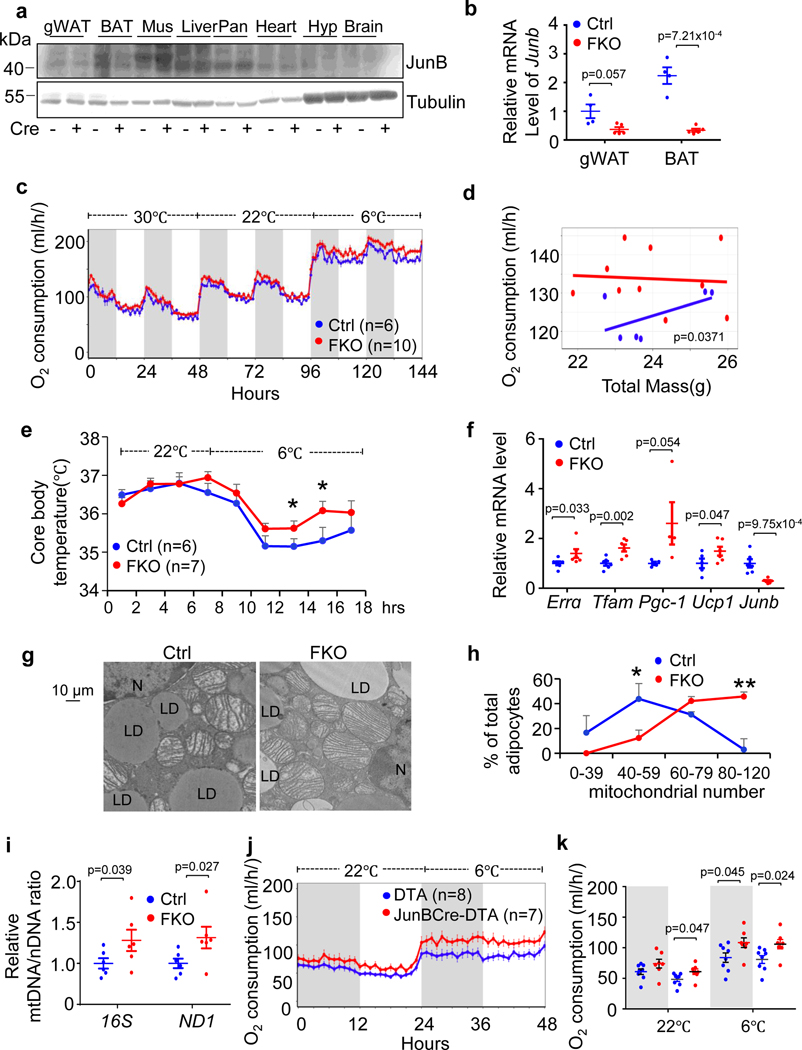
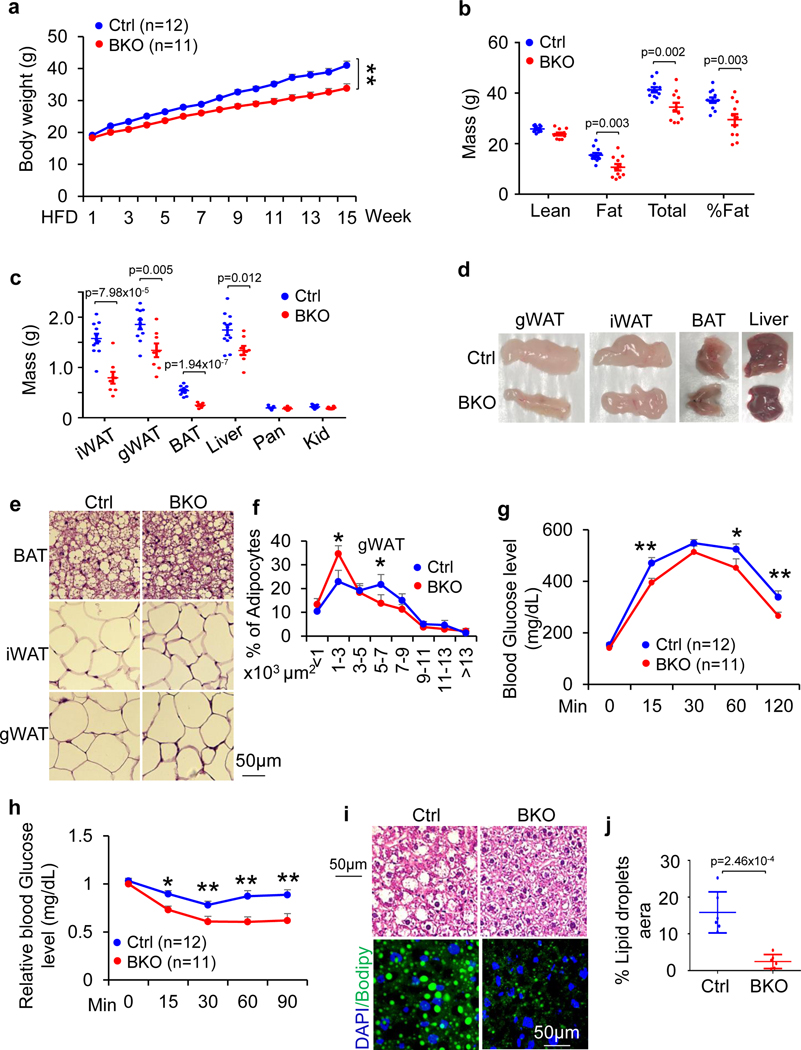
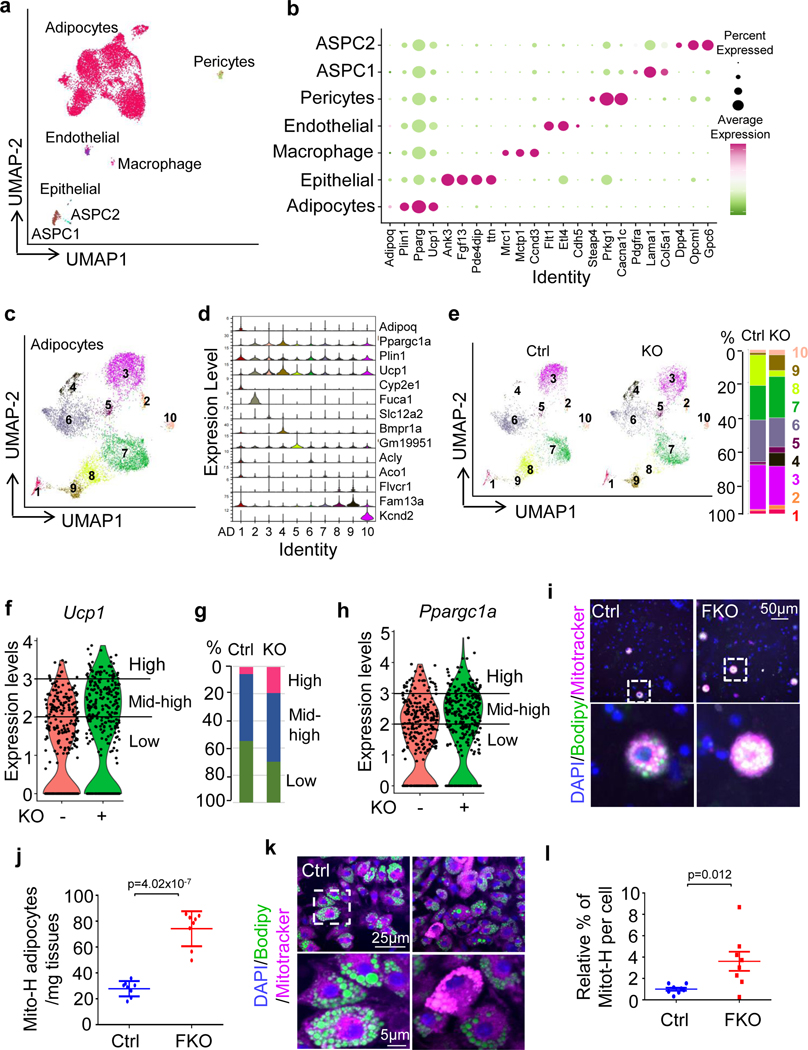
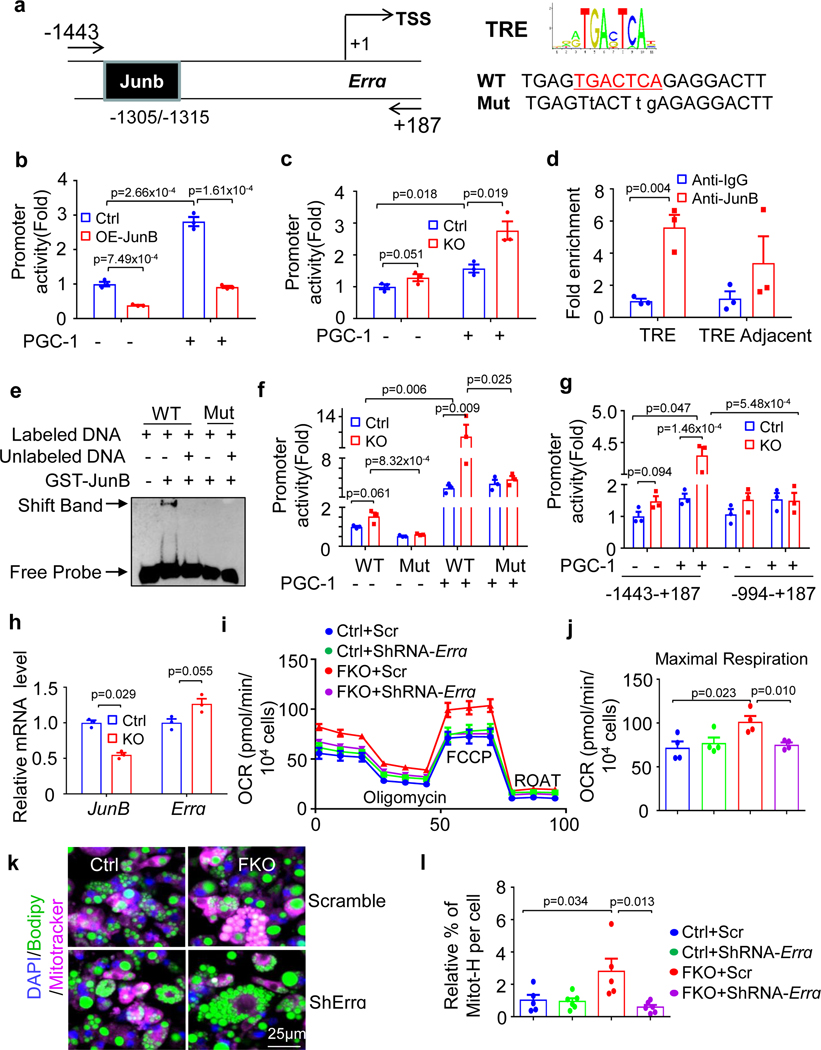
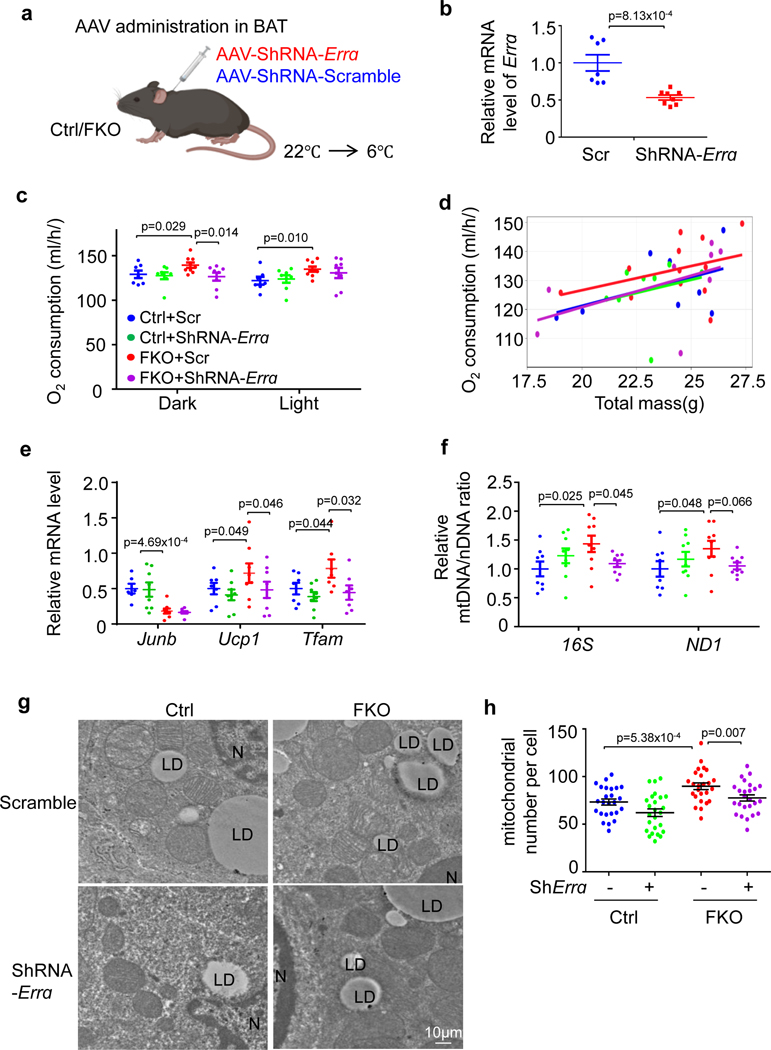
The coexistence of brown adipocytes with low and high thermogenic activity is a fundamental feature of brown adipose tissue heterogeneity and plasticity. However, the mechanisms that govern thermogenic adipocyte heterogeneity and its significance in obesity and metabolic disease remain poorly understood. Here we show that in male mice, a population of transcription factor jun-B (JunB)-enriched (JunB+) adipocytes within the brown adipose tissue exhibits lower thermogenic capacity compared to high-thermogenic adipocytes. The JunB+ adipocyte population expands in obesity. Depletion of JunB in adipocytes increases the fraction of adipocytes exhibiting high thermogenic capacity, leading to enhanced basal and cold-induced energy expenditure and protection against diet-induced obesity and insulin resistance. Mechanistically, JunB antagonizes the stimulatory effects of PPARγ coactivator-1α on high-thermogenic adipocyte formation by directly binding to the promoter of oestrogen-related receptor alpha, a PPARγ coactivator-1α downstream effector. Taken together, our study uncovers that JunB shapes thermogenic adipocyte heterogeneity, serving a critical role in maintaining systemic metabolic health.


Conflict of interest statement

Competing interests

The authors declare no competing interests.

Figures

Extended Data Fig. 1 |
Extended Data Fig. 1 |. The mRNA levels of JunB were upregulated by inhibition of mTORC1 and by obesity in BAT, related to Fig. 1.
a. The layout of fold changes (rapamycin: control) of 96 genes that are cAMP responsive in PCR array analysis. The reverse transcription was performed with total RNA extracted from BAT in mice treated with or without rapamycin (n = 3/group), and then the synthesized cDNAs was used for PCR array analysis. b. RNA-sequencing gene expression signatures of iWAT from 10-week-old male Raptor KO and control mice. n = 2–3/group. c. The protein levels of JunB were upregulated by HFD feeding in adipose tissue. d. Quantification of JunB expression in Extended Data Figure c. e. mRNA levels of JunB were induced in WAT of HFD-fed mice (6 mice/group). f. mRNA levels of Ucp1 and Pgc-1α in human deep neck fat were negatively correlated with BMI. g. The expression pattern of JunB in adipocyte subsets and APCs in human BAT. h. Quantification the protein level in Fig. 1k. i. JunB is expressed in Plin1-enriched primary differentiated adipocytes. j. JunB was highly enriched in primary preadipocytes which declined during differentiation (n = 3, independent experiments). Statistical analysis was performed using Pearson’s correlation coefficient in Extended Data Fig. 1f. Extended Data Fig. 1d, e, h, j were analyzed using unpaired two-sided T-Test.
Extended Data Fig. 2 |
Extended Data Fig. 2 |. The JunB Chaser mouse model was generated to show the presence of JunB-expressing adipocytes in fat, related to Fig. 2.
a. The generation strategy for JunBCreERT2 mice as described in the genomic structure. An internal ribosome entry site (IRES) fused to a CreERT2 fusion gene was inserted downstream of the internal stop codon of Junb gene. b. Representative tissue distribution of iCre and Junb mRNA in adult JunBCreERT2 transgenic mice as determined by qPCR. c. Immunofluorescence staining of YFP+ cells in liver and pancreas of JunBCreERT2 mice. Differentiated YFP+ brown adipocytes were present during primary adipogenesis by imaging (d) and flow cytometry (e) in Primary brown adipocytes of JunBCreERT2 mice. f. JunB+ adipocytes were increased by the treatment of 20 ng/mL TNFα or 20 ng/mL IL-6 for 24 hrs post primary adipogenesis. g. Quantification of JunB-expressing adipocytes in Figure f. h. JunB+ adipocytes were increased by the treatment of 20 ng/mL TNFα or 20 ng/mL IL-6 for 24 hrs post primary adipogenesis. Preadiocytes were isolated from AdipoChaser-YFP mice and differentiated into adipocytes. i. Quantification of JunB-expressing adipocytes in Figure h. All data in this Figure were analyzed by unpaired two-sided T-Test.
Extended Data Fig. 3 |
Extended Data Fig. 3 |. Both JunB FKO and BKO mice display enhanced energy expenditure and cold adaptation, related to Fig. 3.
10-week-old male were individually housed in Phenotyping Systems (Sable Systems International) coupled with a temperature controllable chamber. a. Respiratory exchange ratio (RER) was decreased in adipocyte-specific JunB KO (JunB FKO) mice compared to control littermates under cold stress conditions. Food intake (b) and motor activities (c) were little affected by JunB deficiency in fat. d. mRNA levels of JunB were significantly downregulated in BAT but not in gWAT of UCP1+ cell-specific JunB KO (JunB BKO) mice compared to the controls. e. JunB BKO mice exhibited enhanced basal and cold-induced O2 consumption throughout light and dark cycles compared with controls. f. The quantified data of Extended Data Fig. 3e using CaIR. There was little difference in food intake (g) despite slightly reduced motor activities under cold stress conditions (h) between JunB BKO and control mice. i. JunB deficiency significantly increased oxygen consumption in primary brown adipocytes (4 mice/group). j. The quantified data of Extended Data Fig. 3i using CaIR. k. Ablation of JunB-expressing adipocytes upregulated the expression levels of Ucp1, Ppargc1α, and Errα (7 mice/group). Extended Data Fig. 3i was analyzed by ANOVA analysis and the unpaired two-sided T-Test was used for the rest figures. Data are presented as the mean ± SEM. *P < 0.05 or **P < 0.01.
Extended Data Fig. 4 |
Extended Data Fig. 4 |. Both JunB FKO and BKO mice exhibit improved diet-induced insulin resistance, related to Fig. 4.
6-week-old male JunB FKO and control mice were fed with HFD for 16 weeks and used for the studies (4a-h). The percentage of larger adipocytes was decreased accompanied with an increase in smaller adipocytes in iWAT (a) and BAT (b) of HFD-fed JunB BKO mice compared to controls. Depletion of JunB in adipocytes improved glucose (c) and insulin (d) tolerance after 16-week HFD feeding. JunB FKO mice displayed improved hepatic steatosis (e) and triglyceride content in the liver (8 mice for NC and 6 mice for HFD). (f) of JunB FKO mice compared with control mice under HFD feeding conditions. g-h. O2 consumption was significantly increased in JunB FKO mice compared to controls after feeding with HFD for 12 weeks. Extended Data Fig. 4a–d were analyzed by ANOVA analysis. Extended Data Fig. 4f was analyzed with unpaired two-sided T-Test. Data are presented as the mean ± SEM. *P < 0.05 or **P < 0.01.
Extended Data Fig. 5 |
Extended Data Fig. 5 |. Depletion of JunB in adipocytes increased O2 consumption with insignificant anti-obesity effect under HFD condition, related to Fig. 4.
Under HFD feeding conditions, JunB FKO displayed similar RER (a) and food intake (b), while exhibited a significant decrease in motor activities (c) compared to control mice. There was no significant difference in body mass (d), fat mass, fat percentage (e), the image (f) and weight (g) of individual organs such as gWAT, iWAT, BAT and liver between JunB FKO and control mice when challenged with HFD.
Extended Data Fig. 6 |
Extended Data Fig. 6 |. SnRNA-seq analysis of JunB KO BAT, related to Fig. 5.
a. The sorting strategy of isolated nuclei. The nuclei were first sorted based on forward scatter height (FSC) and side scatter height (SSC), and singlets were then sorted based on the combination of area and heights of FSC followed with sorting of DAPI-positive events used for the snRNA-Seq. b. Heat map of gene signature for each population of brown adipocyte nuclei (AD1-AD10). c. Feature plots for Adipoq, JunB, Ucp1, Ppargc1a, Cyp2e1, Fuca1, Slc12a2, Bmpr1a, Gm19951, Acly, Aco1, Flvcr1, Fam13a and Kcnd2.
Extended Data Fig. 7 |
Extended Data Fig. 7 |. JunB deficiency induces a shift of low to high-thermogenic adipocytes in BAT, related to Fig. 5.
a. JunB is mainly expressed in UCP1low adipocytes (expression levels <2 described in Fig. 5f). b-c. Majority of YFP+ (JunB+) differentiated adipocytes are Mitochondriallow indicated by the staining with MitoTracker.(4 mice/group) d. YFP+ (JunB+) differentiated adipocytes showed significantly upregulated expression of thermogenic genes compared to YFP (JunB) adipocytes(3 mice/group). The partition (e) and pseudotime (f) trajectory of adipocytes analyzed by Monocle. g. Violin plots for Adipoq, Plin1, JunB, Ucp1, Erra, and Ppargc1α for each sub-population of adipocytes in JunB KO and control BAT. h. Volcano plot showing the up regulation of Ucp1, Erra and Ppargc1a in JunB KO BAT compared to control. The unpaired two-sided T-Test was used to analyze Extended Data Fig. 4c, d.
Extended Data Fig. 8 |
Extended Data Fig. 8 |. JunB deficiency enhances adipocyte thermogenic capacity in vivo, related to Fig. 5.
a. Feature plots for Adipoq, Junb, Ucp1 and Ppargc1a in JunB KO adipocytes and control cells. b. Mapping the present data sets of BAT snRNAseq with the published work by Sun et al (PMID: 33116305). c. UMAP of KO BAT adipocytes and controls after mapping with published work by Sun et al (PMID: 33116305).
Extended Data Fig. 9 |
Extended Data Fig. 9 |. JunB deficiency increases thermogenic capacity in primary brown adipocytes, related to Fig. 5.
a. JunB FKO mice displayed increased mitochondriahigh and decreased mitochondrialow adipocytes in BAT. LD, lipid droplet; N, nucleus. b. The quantified data of mitochondriahigh and mitochondrialow adipocytes from Figure a (n = 4, mice/group). c. JunB deficiency had little effect on the primary adipogenesis. d. Quantification of lipid droplet area of JunB FKO and control primary adipocytes in Figure c. e. Gene Set Enrichment Analysis (GSEA) of SnRNA-Seq in JunB FKO and Control mice. Extended Data Fig. 9b was analyzed by ANOVA analysis, Data are presented as the mean ± SEM. *P < 0.05; **P < 0.01.
Fig. 1 |
Fig. 1 |. JunB expression in thermogenic fat is positively correlated with obesity.
a,b, mRNA (n = 6 mice per group) (a) and protein (n = 5 mice per group) (b) levels of JunB, Jun, JunD and UCP1 in gWAT, iWAT and BAT of 10-week-old male mice. c, JunB protein expression was induced in the deep neck fat of obese individuals (n = 3 (non-obese), n = 5 (obese)). d, The quantified data of JunB expression in c. e,f, The mRNA levels of JunB in human deep neck fat were positively correlated with body fat (%) (e) and BMI (f). g,h, Protein levels of JunB in brown fat were positively correlated with body weight (BW) (g) and fat mass (FM) (h) in rodents. i, mRNA levels of JunB in the BAT fractions of adipocytes and SVFs were enhanced in diet-induced obesity (n = 3 mice per group). j,k, Expression levels of JunB in mRNA (n = 3, independent experiments) (j) and protein (n = 4, independent experiments) (k) were induced by the treatment of 20 ng ml−1 IL-6 or 20 ng ml−1 TNF for 24 h in day-6 differentiated brown adipocytes. The loading control tubulin in one membrane was used as the processing control for different gels with identical loading volumes for the sample in b and k. Data represent the mean ± s.e.m. Statistical analysis was performed using Pearson’s correlation coefficient (dh) and an unpaired two-sided t-test. FPKM, fragments per kilobase of transcript per million mapped reads.
Fig. 2 |
Fig. 2 |. A distinct adipocyte subset that expresses JunB is present in the brown and inguinal fat depots and increased by obesity in abundance.
a, Immunostaining shows the localization of JunB+ adipocytes in BAT, iWAT and gWAT of AdipoChaser mice. Antibodies against JunB (red), Adipoq (green), Plin1 (white) and nucleus (blue) were used for the staining. b, Quantification of JunB-expressing adipocytes in various fat depots as indicated in a (n = 4 mice per group). c, Immunostaining of BAT from mice fed with normal chow (NC) or HFD for 4 weeks. Antibodies recognizing JunB (red), Plin1 (green) and nucleus (blue) were used. d, Quantification of BAT JunB-expressing adipocytes in c (n = 6 mice per group). e, The generation strategy of JunBChaser-YFP mice. f, YFP-expressing adipocytes (green) were more enriched in BAT, albeit in modest numbers in iWAT and gWAT in JunBChaser-YFP mice. Antibodies recognizing perilipin 1 (red) and nucleus (blue) were used. g, YFP+ adipocytes were increased in BAT of JunBChaser-YFP mice after 4 weeks of HFD feeding. Antibodies recognizing YFP (green), perilipin 1 (red) and nucleus (blue) were used. White arrows in a, c, f and g indicate the JunB+ cells h, Quantification of BAT YFP+ adipocytes in g (n = 4 mice per group). i, YFP+ adipocytes (green) were increased by the treatment of 20 ng ml−1 TNF or 20 ng ml−1 IL-6 for 24 h in primary differentiated brown adipocytes. j, Quantification of YFP+ adipocytes in i (n = 3 per group). n = 3 per group for a, c, f, g and i. Microscopic images (×20 objective) were taken. Data in b, d, h and j are presented as the mean ± s.e.m. An unpaired two-sided t-test was used for analysis.
Fig. 3 |
Fig. 3 |. Adipose-specific JunB-deficient ( JunB FKO) mice exhibit enhanced thermogenesis and cold adaptation.
a,b, Expression levels of JunB in protein (n = 3, independent experiments) (a) and mRNA (n = 4 mice per group) (b) in BAT and WAT were notably suppressed by depletion of JunB in adipocytes with little effect on other tissues. Mus, skeletal muscle; Liv, liver; Pan, pancreas; Hyp, hypothalamus; Ctrl, control. c, JunB deficiency enhanced cold-induced oxygen consumption at both light and dark cycles. d, Data analysis of oxygen consumption from c using the CaIR website as described. e, JunB deficiency prevented the decrease in core body temperature under cold stress conditions. f, JunB deficiency induced mRNA expression of mitochondria and thermogenic markers in BAT compared to controls (n = 6 mice per group). g, Depletion of JunB increased the average copy number of mitochondria and the proportion of high-mitochondria cells in BAT (n = 4 per group). LD, lipid droplet; N, nucleus. h, Quantification of mitochondrial number in individual cells from g. i, JunB deficiency significantly increased the ratio of mtDNA/nDNA (n = 8 mice per group). j, Elimination of JunB+ adipocytes significantly increased oxygen consumption at both light and dark cycles. k, Analysis of oxygen consumption from j using CaIR. Data in e and h were analysed by analysis of variance (ANOVA). The other data were analysed by unpaired two-sided t-test. Data are presented as the mean ± s.e.m. *P < 0.05 or **P < 0.01.
Fig. 4 |
Fig. 4 |. Specific depletion of JunB in UCP1+ adipocyte ( JunB BKO) enhances energy expenditure and protects against diet-induced obesity and insulin resistance.
Six-week-old male JunB BKO and control mice were fed with an HFD for 16 weeks for the following studies. a, JunB deficiency in UCP1+ cells protected against HFD-induced obesity. b, JunB BKO mice displayed decreased body mass, fat mass and fat percentage compared to control littermates after HFD feeding. The lean mass, fat mass, total mass and fat percentage were measured using dual-energy X-ray absorptiometry (n = 12, control; n = 11, BKO). c, The mass of gWAT, iWAT, BAT and liver was reduced by JunB deficiency after HFD feeding. The organs were weighed after mice were euthanized (n = 11, control; n = 8, BKO). d, Representative images of gWAT, iWAT, BAT and liver in JunB BKO and control mice. e, H&E staining of gWAT, iWAT and BAT of HFD-fed JunB BKO and control mice. f, Quantification of fat cell size of HFD-fed JunB BKO and control mice in e (n = 6 per group). g,h, Depletion of JunB in UCP1+ adipocytes improved glucose tolerance (n = 12, control; n = 11, BKO) (g) and insulin tolerance (n = 12, control; n = 11, BKO) (h). i, JunB BKO mice displayed improved diet-induced hepatic steatosis and fatty liver as reflected in the H&E staining and Bodipy/DAPI immunofluorescence staining. j, Quantification of lipid droplet area in the liver in i (n = 6 per group). Data in a and f-h were analysed by ANOVA. Data in b, c and j were analysed using an unpaired two-sided t-test. Data are presented as the mean ± s.e.m. *P < 0.05; **P < 0.01.
Fig. 5 |
Fig. 5 |. JunB deficiency induces a shift of low-thermogenic to high-thermogenic adipocytes in BAT.
a, Uniform manifold approximation and projection (UMAP) plots and seven distinct cell clusters of BAT by unsupervised clustering. ASPC, adipose stem and progenitor cell. b, Dot plot showing the average expression of marker genes for each cluster in BAT. c, UMAP showing the ten adipocyte subpopulations formed by 8,324 nuclei (4,177 for control, 4,147 for KO). d, Violin plots for Adipoq, Ucp1, Ppargc1α and marker genes for each subpopulation of adipocytes. Expression level (y axis) refers to the log-normalized ratio of gene expression reads, normalized to the sum of all reads within each nucleus. e, UMAPs of adipocytes for control and KO BAT and the percentage of each adipocyte fraction in total adipocytes. f, Analysis of UCP1hi, UCP1int–hi and UCP1lo adiponectin-positive cells in JunB KO BAT. −, control; +, FKO. n = 5 per group. g, Quantification of UCP1hi, UCP1int–hi and UCP1lo adiponectin-positive cells in f. h, The fraction of PGC-1αhiadiponectin+ cells was increased in JunB KO BAT. i, The number of high-mitochondrial content cells in an isolated adipocyte fraction was significantly increased in JunB KO BAT. j, Quantification of mitochondriahi adipocytes in i (n = 6 per group). k, JunB deficiency increased the mitochondrial mass indicated by the fluorescence staining of MitoTracker using a high-content cell scanning system. Primary differentiated JunB KO and control brown adipocytes were incubated with 100 nM MitoTracker for 20 min. l, Quantification of mitochondrial intensity per cell in k (n = 3, independent experiments). Data in j and l were analysed using an unpaired two-sided t-test.
Fig. 6 |
Fig. 6 |. JunB suppresses the formation of high-thermogenic adipocytes by binding to PGC-1α effector ERRα.
a, Schematic showing the JunB binding site TRE (TGA(C/G)TCA) on the Erra promoter at the −1,305/−1,315 region. TSS, transcription start site. b, Overexpression of JunB suppressed basal and PGC-1α-induced activation of the Erra promoter in HEK293T cells (n = 3, independent experiments). c, Knockdown of JunB increased basal and PGC1α-induced activation of the Erra promoter in primary preadipocytes (n = 3, independent experiments). d, ChIP assay showed that JunB bound to the Erra promoter in BAT (n = 3 mice per group). e, The EMSA showed the direct interaction between JunB recombinant protein and DNA probe of the Erra promoter at the −1,305/−1,315 region (n = 3, independent experiments). WT, wild type. f,g, The ability of JunB to induce basal and PGC-1α-induced Erra gene activation was blocked when the TRE site was mutated (n = 3, independent experiments) (f) or TRE site was depleted (n = 3, independent experiments) (g) on the luciferase reporter of the Erra promoter. h, Suppressing JunB increased the mRNA of ERRα in primary preadipocytes. il, Suppressing ERRα abolished increased oxygen consumption (n = 3, independent experiments) (i), maximum respiration capacity (n = 3, independent experiments) (j) and mitochondriahi adipocytes (k and l) (n = 3, independent experiments) in JunB KO differentiated brown adipocytes. Data were analysed using an unpaired two-sided t-test. OCR, oxygen consumption rate.
Fig. 7 |
Fig. 7 |. JunB suppresses BAT mitochondrial biogenesis and energy expenditure through ERRα in vivo.
a, Diagram of the following animal study. Created with BioRender.com. b, Administration of AAV-shRNA-Errα into BAT significantly suppressed ERRα expression compared to scramble group in JunB FKO mice (n = 7, control; n = 8, FKO). c, JunB deficiency-induced cold-induced oxygen consumption was compromised when ERRα was suppressed under cold stress conditions (n = 8 per group). d, Data analysis of oxygen consumption from c using CaIR software (n = 8 per group). e, The upregulated expression levels of UCP1 and TFAM were attenuated by Errα suppression in JunB KO BAT under cold stress conditions (n = 8 per group). f, The increased ratio of mtDNA/nDNA was diminished by Errα suppression in JunB KO BAT after cold stimulation (n = 8 per group). g, Suppressing ERRα partially reversed the increase in mitochondrial copy number in JunB-deficient BAT. h, Quantification of mitochondrial copy number in g (n = 5 per group). Data were analysed using an unpaired one-sided t-test.

References

    1. Cypess AM et al. Identification and importance of brown adipose tissue in adult humans. N. Engl. J. Med 360, 1509–1517 (2009). - PMC - PubMed
    1. Yoneshiro T. et al. Recruited brown adipose tissue as an antiobesity agent in humans. J. Clin. Investig. 123, 3404–3408 (2013). - PMC - PubMed
    1. Hanssen MJ et al. Short-term cold acclimation improves insulin sensitivity in patients with type 2 diabetes mellitus. Nat. Med. 21, 863–865 (2015). - PubMed
    1. Becher T. et al. Brown adipose tissue is associated with cardiometabolic health. Nat. Med. 27, 58–65 (2021). - PMC - PubMed
    1. Bartelt A. et al. Brown adipose tissue activity controls triglyceride clearance. Nat. Med. 17, 200–205 (2011). - PubMed