. 2024 Mar 12;8(5):1094-1104.
doi: 10.1182/bloodadvances.2023011687.

Distinct peripheral T-cell and NK-cell profiles in HGBL-MYC/BCL2 vs patients with DLBCL NOS

Affiliations

Distinct peripheral T-cell and NK-cell profiles in HGBL-MYC/BCL2 vs patients with DLBCL NOS

A Vera de Jonge et al. Blood Adv. .

Abstract

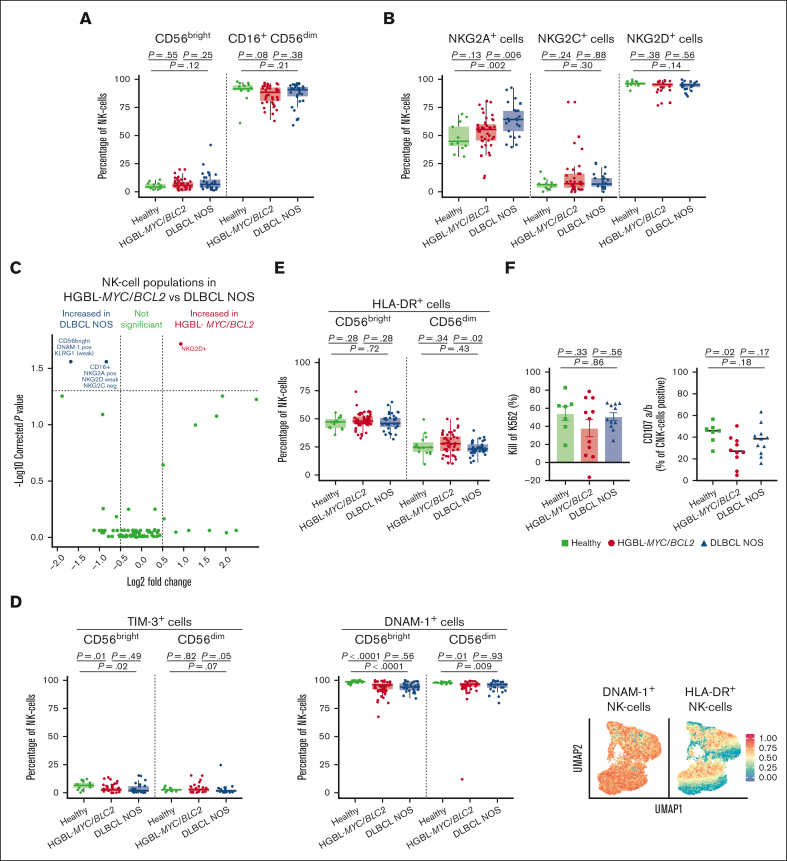
Patients with high-grade B-cell lymphoma with MYC and BCL2 rearrangements (HGBL-MYC/BCL2) respond poorly to immunochemotherapy compared with patients with diffuse large B-cell lymphoma not otherwise specified (DLBCL NOS) without a MYC rearrangement. This suggests a negative impact of lymphoma-intrinsic MYC on the immune system. To investigate this, we compared circulating T cells and natural killer (NK) cells of patients with HGBL-MYC/BCL2 (n = 66), patients with DLBCL NOS (n = 53), and age-matched healthy donors (HDs; n = 16) by flow cytometry and performed proliferation, cytokine production, and cytotoxicity assays. Compared with HDs, both lymphoma subtypes displayed similar frequencies of CD8+ T cells but decreased CD4+ T cells. Regulatory T-cell (Treg) frequencies were reduced only in patients with DLBCL NOS. Activated (HLA-DR+/CD38+) T cells, PD-1+CD4+ T cells, and PD-1+Tregs were increased in both lymphoma subtypes, but PD-1+CD8+ T cells were increased only in HGBL-MYC/BCL2. Patients with DLBCL NOS, but not patients with HGBL-MYC/BCL2, exhibited higher frequencies of senescent T cells than HDs. Functional assays showed no overt differences between both lymphoma groups and HDs. Deeper analyses revealed that PD-1+ T cells of patients with HGBL-MYC/BCL2 were exhausted with impaired cytokine production and degranulation. Patients with DLBCL NOS, but not patients with HGBL-MYC/BCL2, exhibited higher frequencies of NK cells expressing inhibiting receptor NKG2A. Both lymphoma subtypes exhibited lower TIM-3+- and DNAM-1+-expressing NK cells. Although NK cells of patients with HGBL-MYC/BCL2 showed less degranulation, they were not defective in cytotoxicity. In conclusion, our results demonstrate an increased exhaustion in circulating T cells of patients with HGBL-MYC/BCL2. Nonetheless, the overall intact peripheral T-cell and NK-cell functions in these patients emphasize the importance of investigating potential immune evasion in the microenvironment of MYC-rearranged lymphomas.


Conflict of interest statement

Conflict-of-interest disclosure: M.N. received research support from Takeda and has an advisory role at AbbVie. M.E.D.C. received research support from AbbVie, Genmab, Bristol Myers Squibb, and Gilead, and has an advisory role at AbbVie, Novartis, and Incyte. T.M. received research funding from Takeda, Janssen, and Genmab. The remaining authors declare no competing financial interests.

Figures

None
Graphical abstract
Figure 1.
Figure 1.
T-cell phenotype in patients with HGBL-MYC/BCL2, patients with DLBCL NOS, and HDs. (A-B) Expression analysis of major T-cell subsets (A), and CD127 (B) in HDs (green; n = 16), patients with HGBL-MYC/BCL2 (red; n = 66), and patients with DLBCL NOS (blue; n = 53). (C) In-depth analysis of the computationally identified T-cell populations by FlowSOM expressed higher (red) or lower (blue) in patients with HGBL-MYC/BCL2 vs patients with DLBCL NOS. (D-E) Expression analysis of HLA-DR and CD38 (D) and PD-1 (E) in HDs (green; n = 16), patients with HGBL-MYC/BCL2 (red; n = 66), and patients with DLBCL NOS (blue; n = 53). (F) Dimensionality reduction by UMAP of the flow cytometry data of T-cells. Color overlays for CD38, HLA-DR, PD-1, and CD8 are depicted. For all box plots, the lower upper hinges correspond to the 25th and 75th percentiles. The middle hinge corresponds to the median. The whiskers extend from the largest to smallest value ± 1.58 ∗ interquartile range. Samples are plotted individually, bone marrow samples (n = 3 HGBL-MYC/BCL2 and n = 1 DLBCL NOS) are indicated as square. Nonparametric Mann-Whitney U test between 2 groups was used for statistical analysis, in which P < .05 was considered significant.
Figure 2.
Figure 2.
T-cell functionality in patients with HGBL-MYC/BCL2, patients with DLBCL NOS, and HDs. (A-B) Percentages of total CD4+ (left panels) and total CD8+ (right panels) T-cell proliferation division index (A) and proliferation index (B) in HDs (green; n = 6), patients with HGBL-MYC/BCL2 (red; n = 20), and patients with DLBCL NOS (blue; n = 13) after 5 days of stimulation with CD3/CD28 beads. (C) Mean fluorescent intensity (MFI) of CD107a after 5 days of stimulation with CD3/CD28 beads on total CD4+ (left panel) and total CD8+ (right panel) T cells in HDs (green; n = 6), patients with HGBL-MYC/BCL2 (red; n = 23), and patients with DLBCL NOS (blue; n = 13). (D-E) Representative cytometry histograms and comparative percentages of PD-1+CD4+ (left panels) and PD-1+CD8+ (right panels) T cells for IFN-γ, TNF-α, and IL-2 and (E) MFI of CD107a on PD-1+CD4+ (left panel) and PD-1+CD8+ (right panel) in HDs (green; n = 6), patients with HGBL-MYC/BCL2 (red; n = 23), and patients with DLBCL NOS (blue; n = 12) after 4-hour stimulation with PMA/ionomysin. – represents unstimulated cells; + represents stimulated cells. Nonparametric Mann-Whitney U test was used for statistical analysis, in which P < .05 was considered significant.
Figure 3.
Figure 3.
NK cell phenotype in patients with HGBL-MYC/BCL2, patients with DLBCL NOS, and HDs. (A-B) Expression analysis of major NK cell subsets (A) and NK cell receptors (B) in HDs (green; n = 15 in A; n = 13 in panel B), patients with HGBL-MYC/BCL2 (red; n = 51 in A; n = 41 in panel B), and patients with DLBCL NOS (blue; n = 35 in A; n = 25 in panel B). (C) In-depth analysis of the computationally identified NK cell populations by FlowSOM expressed higher (red) or lower (blue) in patients with HGBL-MYC/BCL2 vs patients with DLBCL NOS. (D-E) Expression analysis of TIM-3, DNAM-1 (D), and HLA-DR (E) on NK cell subsets in HDs (green; n = 13-15), patients with HGBL-MYC/BCL2 (red; n = 41-51; based on sample availability for the 2 T-cell panels; see also supplemental Figure 1), and patients with DLBCL NOS (blue; n = 25-35) and dimensionality reduction by UMAP of the flow cytometry data of NK cells. Color overlays for DNAM-1 and HLA-DR are depicted. (F) Comparative percentages of kill of K562 and degranulation as measured by CD107a/b surface expression on NK cells in HDs (green; n = 7), patients with HGBL-MYC/BCL2 (red; n = 11), and patients with DLBCL NOS (blue; n = 11) after 4-hour coculture of PBMCs with K562 cell line. Cytotoxicity is calculated relative to the amount of K562 cells without PBMCs. For all box plots, the lower upper hinges correspond to the 25th and 75th percentiles. The middle hinge corresponds to the median. The whiskers extend from the largest to smallest value ± 1.58 ∗ interquartile range. Samples are plotted individually, bone marrow samples (n = 3 HGBL-MYC/BCL2 and n = 1 DLBCL NOS) are indicated as square. Mann-Whitney U test between 2 groups was used for statistical analysis. P < .05 was considered significant.

References

    1. Alaggio R, Amador C, Anagnostopoulos I, et al. The 5th edition of the World Health Organization classification of haematolymphoid tumours: lymphoid neoplasms. Leukemia. 2022;36(7):1720–1748. - PMC - PubMed
    1. Savage KJ, Johnson NA, Ben-Neriah S, et al. MYC gene rearrangements are associated with a poor prognosis in diffuse large B-cell lymphoma patients treated with R-CHOP chemotherapy. Blood. 2009;114(17):3533–3537. - PubMed
    1. Barrans S, Crouch S, Smith A, et al. Rearrangement of MYC is associated with poor prognosis in patients with diffuse large B-cell lymphoma treated in the era of rituximab. J Clin Oncol. 2010;28(20):3360–3365. - PubMed
    1. McPhail ED, Maurer MJ, Macon WR, et al. Inferior survival in high-grade B-cell lymphoma with MYC and BCL2 and/or BCL6 rearrangements is not associated with MYC/IG gene rearrangements. Haematologica. 2018;103(11):1899–1907. - PMC - PubMed
    1. Hutchings M, Mous R, Clausen MR, et al. Dose escalation of subcutaneous epcoritamab in patients with relapsed or refractory B-cell non-Hodgkin lymphoma: an open-label, phase 1/2 study. Lancet. 2021;398(10306):1157–1169. - PubMed

MeSH terms