. 2024 Feb;25(2):226-239.
doi: 10.1038/s41590-023-01722-8. Epub 2024 Jan 8.

A pairwise cytokine code explains the organism-wide response to sepsis

Affiliations

A pairwise cytokine code explains the organism-wide response to sepsis

Michihiro Takahama et al. Nat Immunol. 2024 Feb.

Abstract

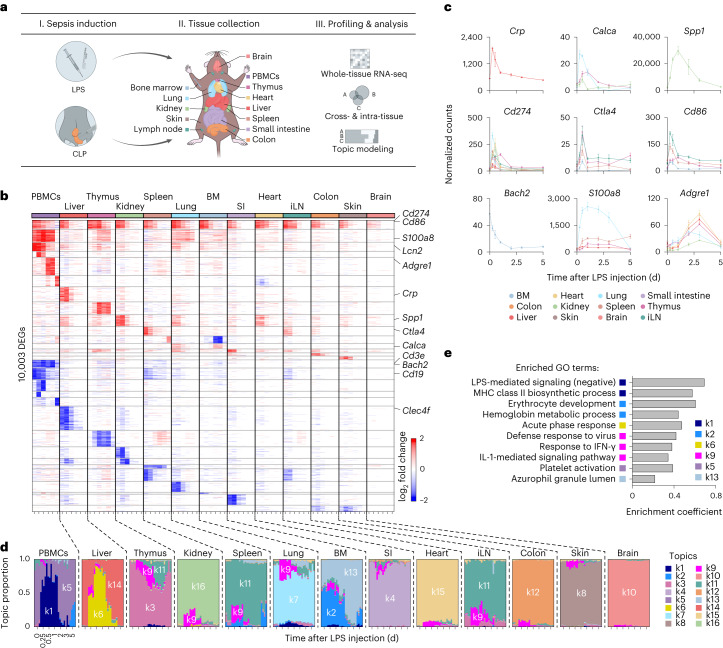
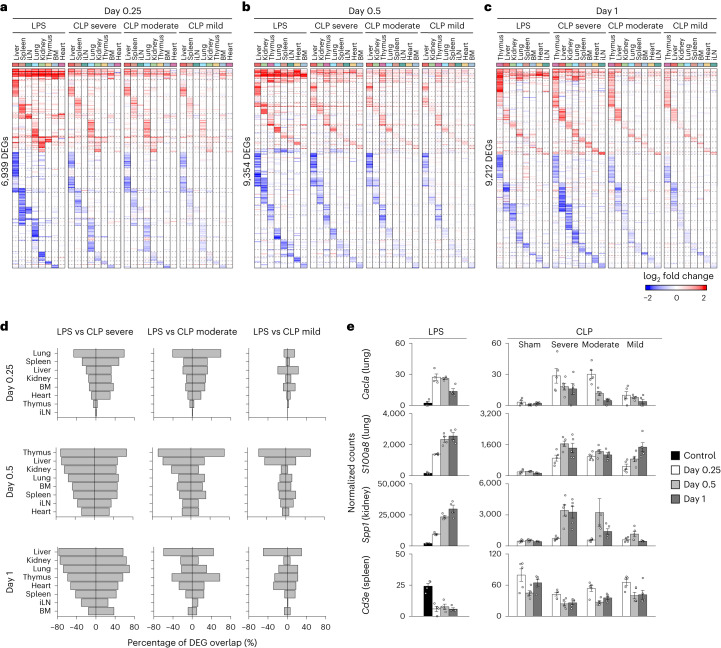
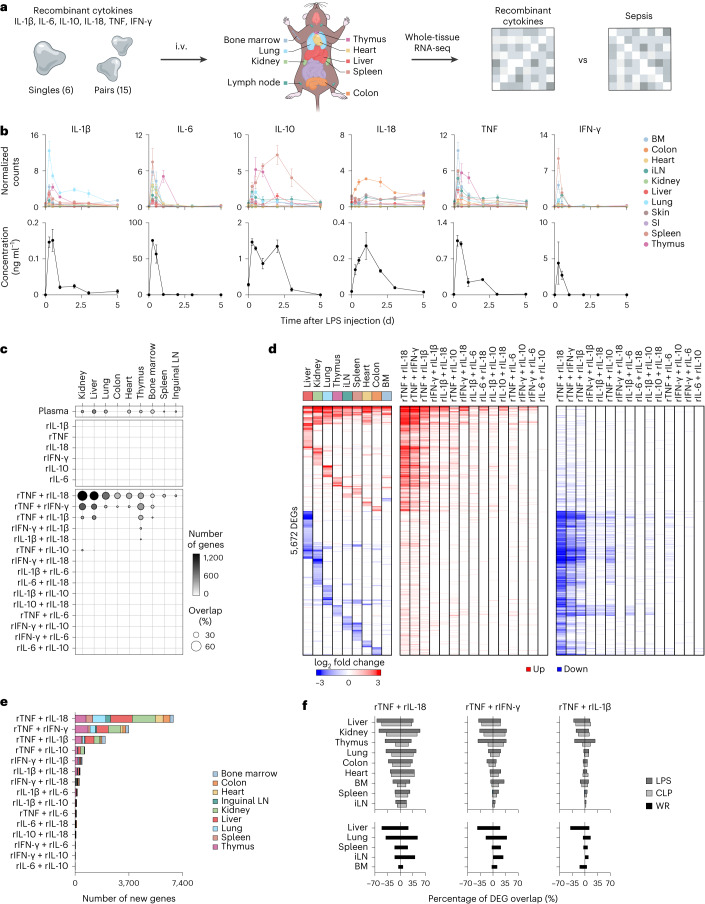
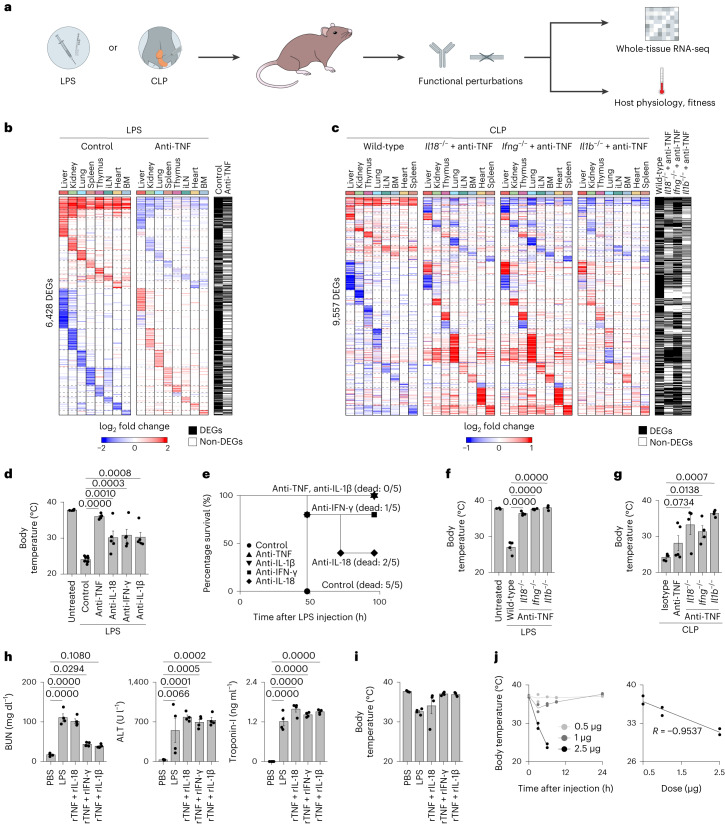
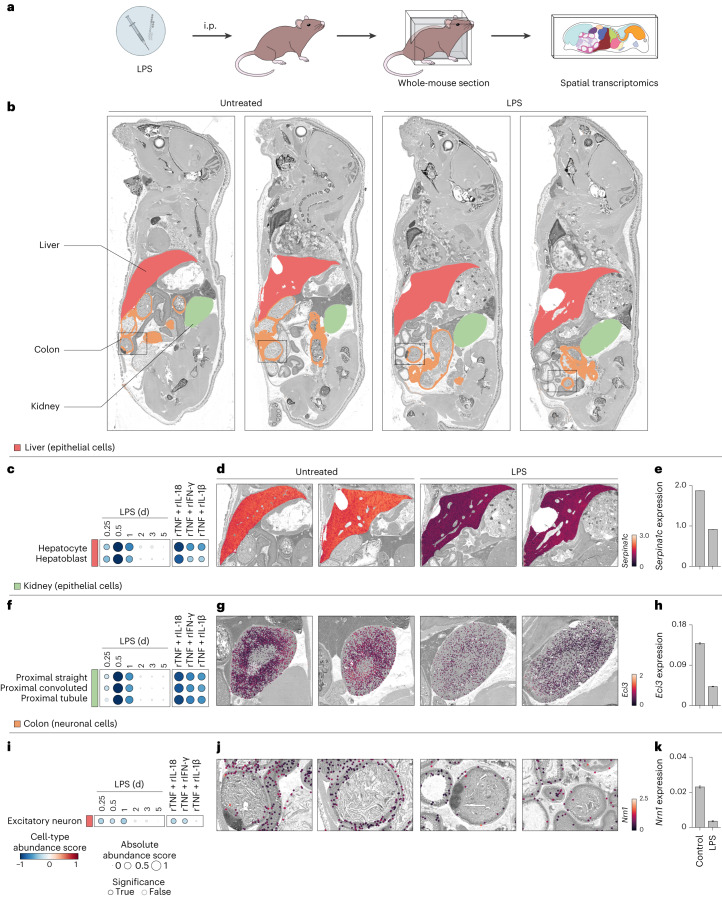
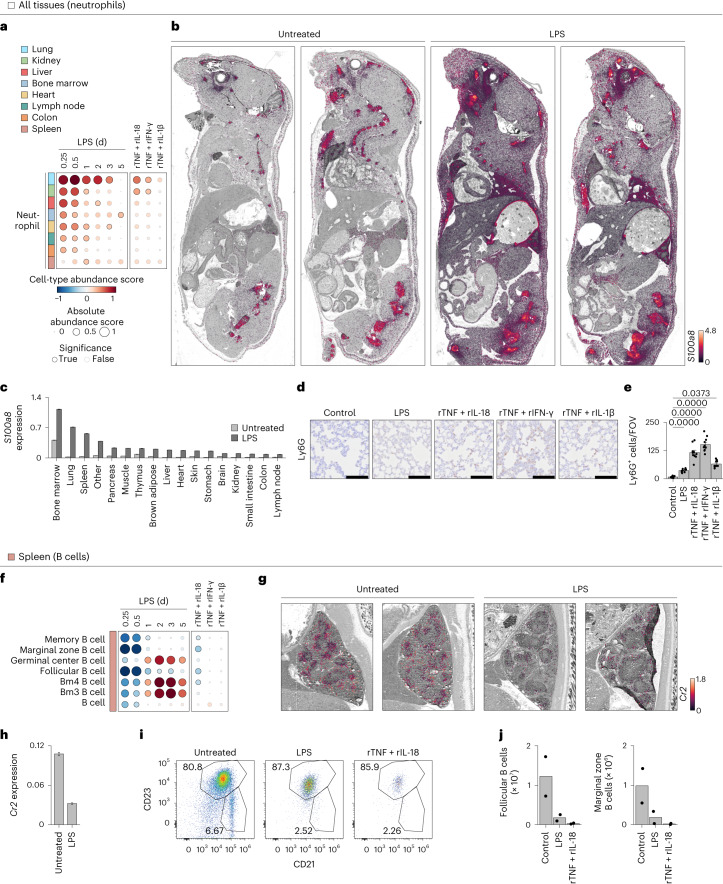
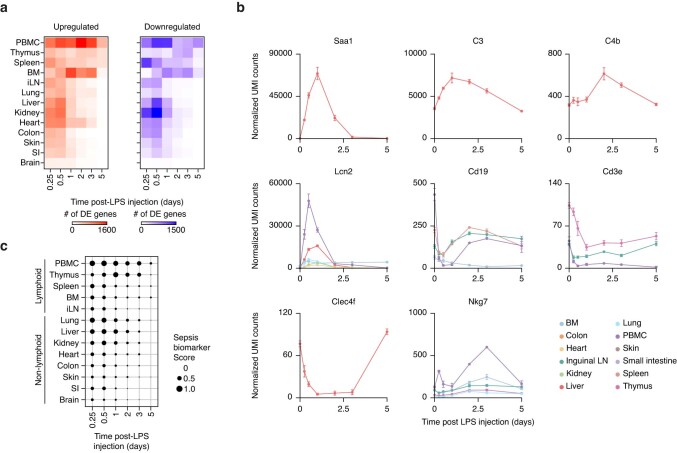
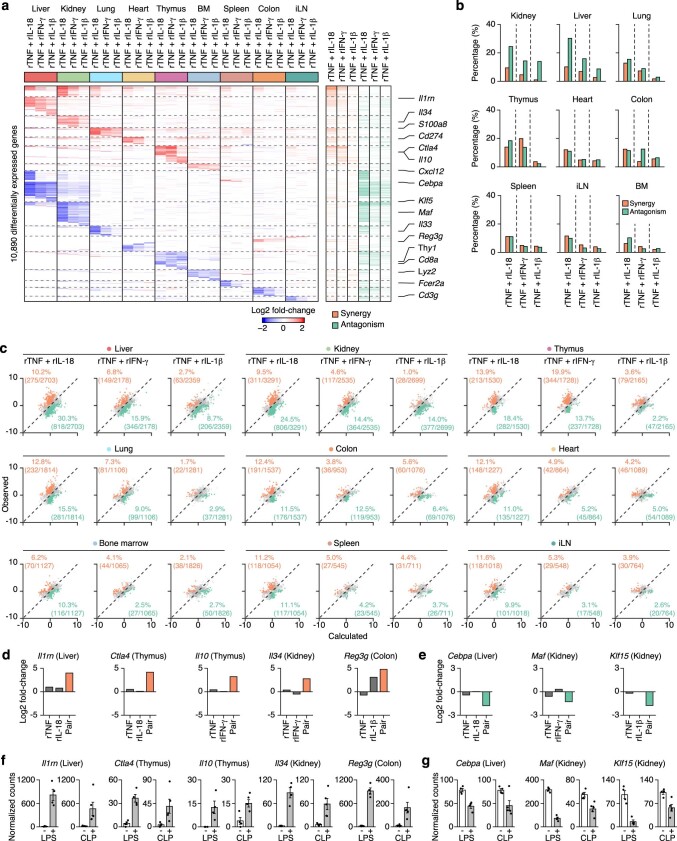
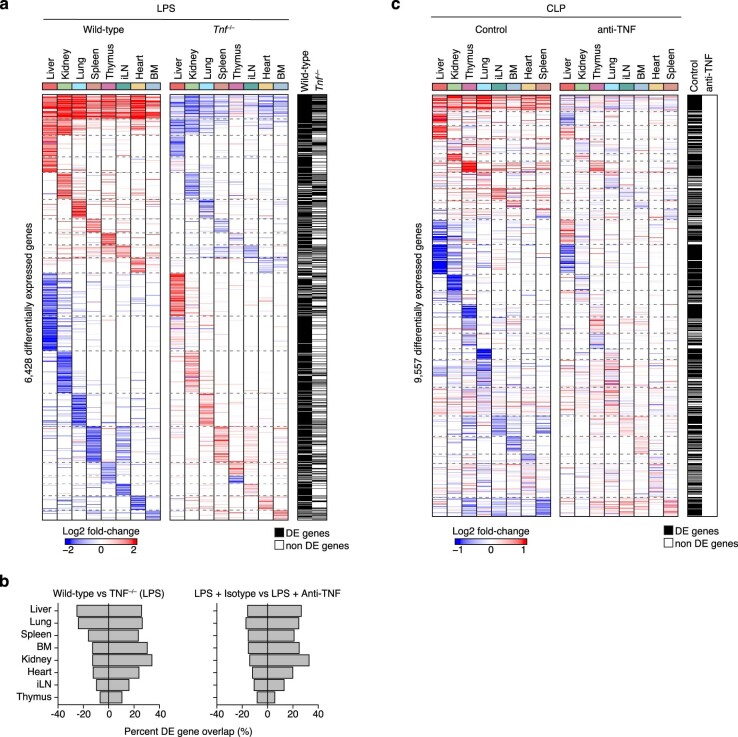
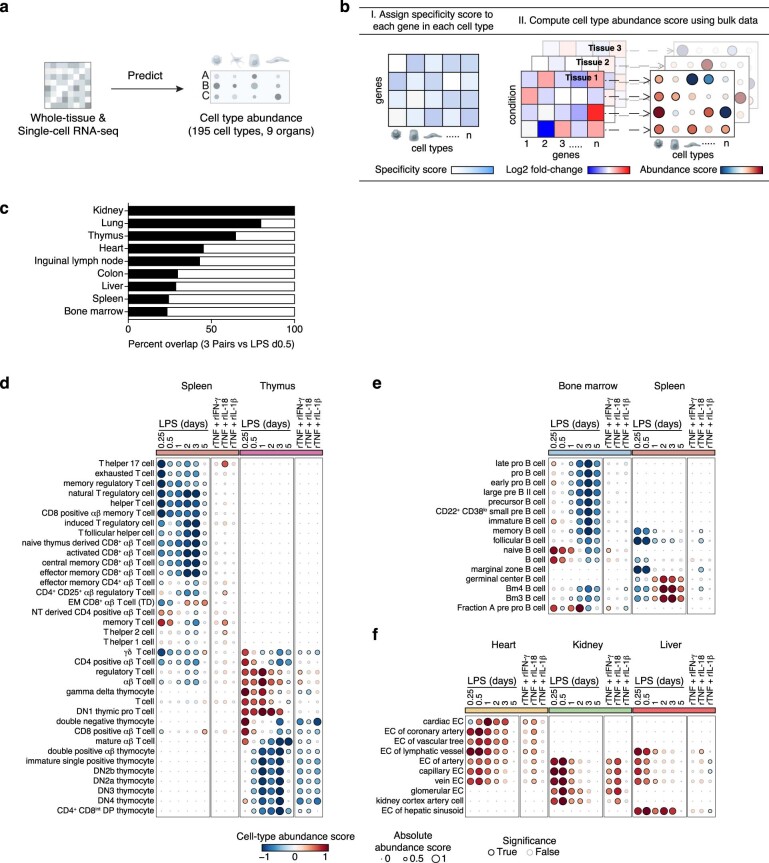
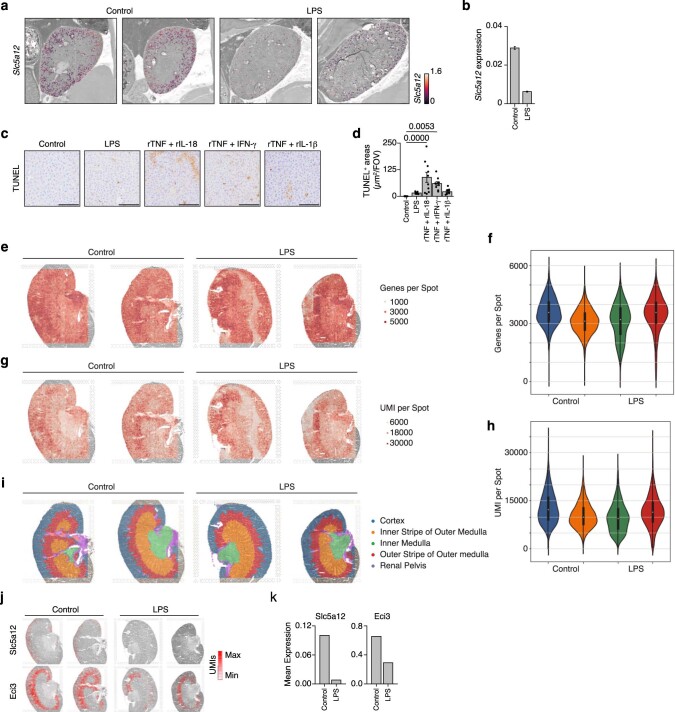
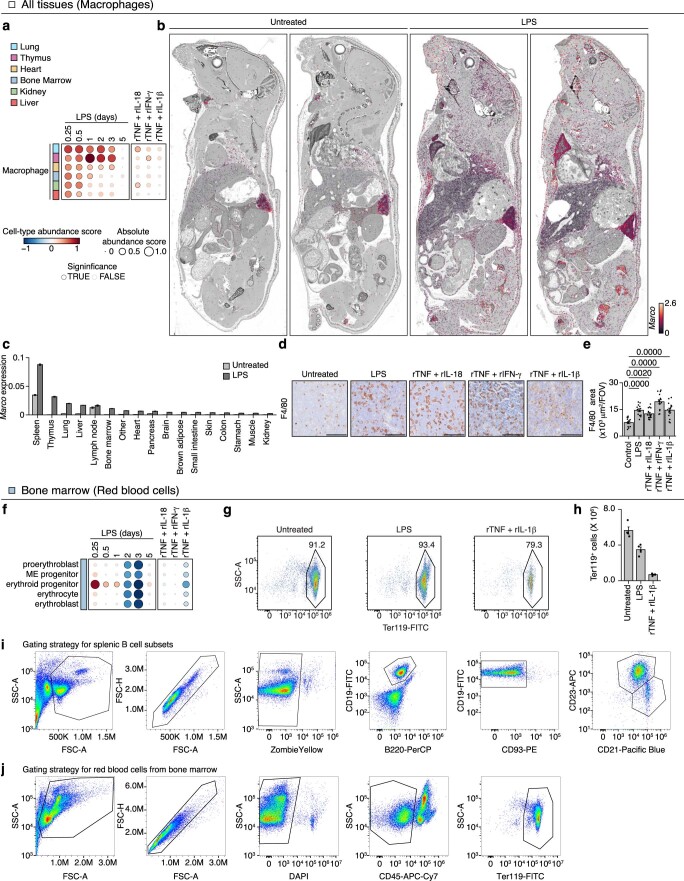
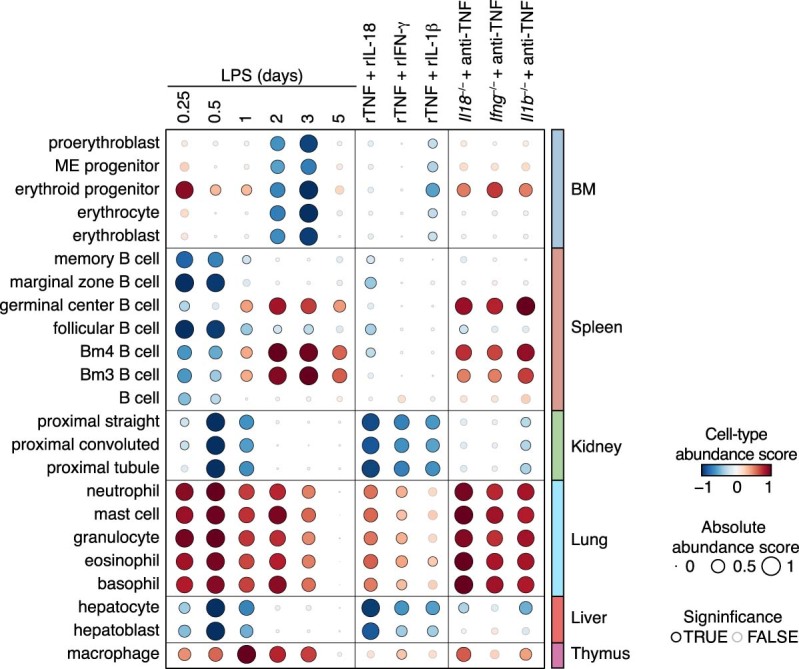
Sepsis is a systemic response to infection with life-threatening consequences. Our understanding of the molecular and cellular impact of sepsis across organs remains rudimentary. Here, we characterize the pathogenesis of sepsis by measuring dynamic changes in gene expression across organs. To pinpoint molecules controlling organ states in sepsis, we compare the effects of sepsis on organ gene expression to those of 6 singles and 15 pairs of recombinant cytokines. Strikingly, we find that the pairwise effects of tumor necrosis factor plus interleukin (IL)-18, interferon-gamma or IL-1β suffice to mirror the impact of sepsis across tissues. Mechanistically, we map the cellular effects of sepsis and cytokines by computing changes in the abundance of 195 cell types across 9 organs, which we validate by whole-mouse spatial profiling. Our work decodes the cytokine cacophony in sepsis into a pairwise cytokine message capturing the gene, cell and tissue responses of the host to the disease.


Conflict of interest statement

A.P. is the founder and CEO of Combinatics. All other authors declare no competing interests.

Figures

Fig. 1
Fig. 1. Whole-tissue gene expression reveals the molecular effects of sepsis and endotoxemia across organs.
a, Schematic overview of the experimental workflow. b, Heat map of DEGs (rows) from whole-tissue mRNA profiles ordered by k-means clustering (horizontal lines), organ types (top; colors) and time periods (bottom; tick marks for 0.25, 0.5, 1, 2, 3, and 5 d) after sublethal LPS injection. Values are log2 fold changes relative to matching, untreated organ. Statistical analyses were performed with limma (false discovery rate (FDR)-adjusted P value < 0.01; absolute fold change > 2). BM, bone marrow; SI, small intestine; iLN, inguinal lymph node. c, Normalized counts for indicated genes, cohorts and organs (color). Error bars indicate the s.e.m. (n = 3 biologically independent samples for BM 5 d, colon 0.25 d, iLN 2 d, liver 1 d or lung 3 d; n = 4 for other groups). d, Structure plot of the estimated membership proportions for a topic model with k = 16 topics (colors) fit to 364 tissue samples across 13 organ types (top) from LPS-injected mice (Methods). Each vertical bar shows the cluster membership proportions for a single tissue sample ordered over time (bottom, tick marks for 0, 0.25, 0.5, 1, 2, 3 and 5 d after sublethal LPS injection) for each organ type. e, Pathway enrichment analysis using DEGs in each topic from d. Shown are enrichment coefficients (x axis) for indicated Gene Ontology (GO) terms (y axis). MHC, major histocompatibility complex.
Fig. 2
Fig. 2. Comparative, multi-tissue expression analysis of endotoxomia and bacterial sepsis.
ac, Heat maps of DEGs (rows) from whole-tissue mRNA profiles ordered by k-means clustering and organ types (top, colors) at 0.25 (a), 0.5 (b) or 1 (c) day after sublethal LPS injection or severe, moderate or mild CLP surgeries. Values are log2 fold changes relative to matching organs from untreated mice for LPS or mice after sham surgeries for CLP. Statistical analyses were performed with limma (FDR-adjusted P value < 0.1). Shown are all the genes found to be differentially regulated in at least one of the LPS or CLP conditions for each time point. BM, bone marrow; iLN, inguinal lymph node. d, Percentages (x axis) of genes differentially expressed in tissues (rows) upon severe, moderate or mild CLP that match the genes regulated by sublethal LPS at 0.25, 0.5 and 1 d after LPS or CLP. Positive and negative percentages indicate overlaps of upregulated and downregulated genes, respectively. e, Normalized counts for indicated genes, cohorts and organs (y axes) in LPS and CLP sepsis. Error bars indicate the s.e.m. (n = 4 biologically independent samples for LPS samples; n = 5 biologically independent samples for CLP samples).
Fig. 3
Fig. 3. The pairwise effects of TNF plus IL-18, IFN-γ or IL-1β recapitulate the transcriptional responses of organs to sepsis.
a, Schematic overview of the experimental workflow. Mice were intravenously injected with 6 singles, or 15 pairs of recombinant cytokines followed by RNA-seq on indicated organs. b, Normalized counts (top) and blood concentration (bottom) for indicated cytokine genes and proteins upon sublethal LPS injection at indicated time points. Error bars indicate the s.e.m. (n = 3 biologically independent samples for normalized counts in BM 5 d, colon 0.25 d, iLNs 2 d, liver 1 d or lung 3 d; n = 4 for other groups). BM, bone marrow; iLN, inguinal lymph node; SI, small intestine. c, Percentages (circle) and numbers (color scale) of genes differentially expressed upon injection with indicated recombinant cytokines (rows) across organs (columns) that match the genes regulated by sublethal LPS at 12 h after sepsis induction. ‘Plasma’ indicates naive mice injected with plasma from LPS-injected mice. d, Heat map (left) of DEGs (rows) from whole-tissue mRNA profiles ordered by k-means clustering and organ types (top, colors) at 12 h after sublethal LPS injection. Values are log2 fold changes relative to matching, untreated organs. Statistical analyses were performed with limma (FDR-adjusted P value < 0.01; absolute fold change > 2; n = 4). Genes upregulated and downregulated by indicated recombinant cytokine pairs in at least one of the nine tissues profiled are indicated in red and blue, respectively. e, Numbers of genes (x axis) differentially regulated by indicated cytokine pairs (rows) but not by matching single cytokines. Statistical analyses were performed with limma (FDR-adjusted P value < 0.01; absolute fold change > 2; n = 4). f, Percentages (x axis) of genes differentially expressed in tissues (rows) upon injection of the indicated three cytokine pairs that match the genes regulated by bacterial (LPS, CLP; top) or viral (WR; bottom) sepsis. WR, vaccinia virus strain Western Reserve.
Fig. 4
Fig. 4. Cytokine pairs explain the physiological and fitness effects of sepsis.
a, Schematic overview of the experimental workflow. The impact of cytokine perturbations using neutralizing antibodies and genetic deletions during LPS or CLP sepsis was assessed by measuring tissue gene expression and host physiological parameters. b, Heat maps of DEGs (rows) from whole-tissue mRNA profiles ordered by k-means clustering and organ types (top; colors) at 12 h after sublethal LPS injection with or without (control) anti-TNF pretreatment. Values are log2 fold changes relative to matching organs from untreated mice for LPS without anti-TNF. Statistical analyses were performed with limma (FDR-adjusted P value < 0.01–0.05, absolute fold change > 2). Shown are all the genes found to be differentially regulated in at least one of the indicated conditions (row annotations in black). BM, bone marrow; iLN, inguinal lymph node. c, Heat maps of DEGs (rows) from whole-tissue mRNA profiles ordered by k-means clustering and organ types (top, colors) at 0.5 d after CLP (severe grade) in wild-type mice injected with isotype control antibodies or Il18−/−, Ifng−/− or Il1b−/− mice injected with anti-TNF (left to right). Values are log2 fold changes relative to matching organs from sham-operated mice for wild-type, or wild-type mice after severe CLP surgeries for Ifng−/−, Il18−/− and Il1b−/− mice. Statistical analyses were performed with limma (FDR-adjusted P value < 0.1). Shown are all the genes found to be differentially regulated in at least one of the indicated conditions (row annotations in black). d, Measurements of rectal temperature in mice of indicated genotypes with or without indicated neutralizing antibody pretreatment at 24 h after lethal LPS injection. Statistical differences were determined by one-way analysis of variance (ANOVA) with Tukey–Kramer test. Error bars indicate the s.e.m. (n = 10 biologically independent samples for LPS control; n = 5 biologically independent samples for other groups). e, Survival curves of mice injected with a lethal dose of LPS with or without indicated neutralizing antibody pretreatment (n = 5 biologically independent samples). f,g, Measurements of rectal temperature in mice of indicated genotypes with or without indicated neutralizing antibody pretreatment at 0.5 d after lethal LPS injection (f) or severe CLP surgery (g). Statistical differences were determined by one-way ANOVA with Tukey–Kramer test. Error bars indicate the s.e.m. (n = 4 biologically independent samples). h, Serum levels of indicated organ injury markers at 24 h after injection of a sublethal LPS dose or PBS as control, or 12 h after injection of indicated recombinant cytokine pairs. Statistical differences were determined by one-way ANOVA with Tukey–Kramer test. Error bars indicate the s.e.m. (n = 4 biologically independent samples). ALT, alanine transaminase; BUN, blood urea nitrogen. i, Measurement of rectal temperature at 16 h after injection of a sublethal LPS dose, indicated cytokines or PBS as control. Error bars indicate the s.e.m. (n = 4 biologically independent samples). j, Measurements of rectal temperature (y axis; left and right) relative to time after injection (left) or varying doses (right, x axis) of recombinant (r)IL-1β in combination with rTNF (1 µg). Error bars indicate the s.d. (n = 2 biologically independent samples).
Fig. 5
Fig. 5. The pairwise effects of TNF plus IL-18, IFN-γ or IL-1β mirror the cellular effects of sepsis across organs.
Whole-tissue RNA-seq profiles were integrated with cell-type-specific gene sets (Supplementary Methods) to obtain cell-type abundance scores computed for 195 cell types (rows) across 9 tissues (colors; top) upon injection of a sublethal dose of LPS or indicated recombinant cytokine pairs (columns). Cell-type abundance score, absolute abundance score and significance (absolute value of z-score > 1) are shown as colors, circle size and outline of the circle, respectively. Individual scores can be found in Supplementary Table 6. LN, lymph node; ILC, innate lymphoid cell; NK, natural killer.
Fig. 6
Fig. 6. TNF plus IL-18, IFN-γ or IL-1β are responsible for the cellular effects of sepsis on epithelial and neuronal cells across tissues.
a, Schematic overview of the experimental workflow for whole-mouse sectioning followed by large-format spatial transcriptomics. b, Whole-mouse spatial transcriptomics analysis of indicated tissue clusters overlaid on a grayscale hematoxylin and eosin (H&E) staining. Shown are whole-mount sections and spatial transcriptomics data from 5-week-old mice injected with a sublethal dose of LPS (5 mg per kg body weight) or left untreated as control. c,f,i, Cell-type abundance scores computed for indicated cell types (rows) and tissues (colors) upon injection of a sublethal dose of LPS in wild-type (left) or injected with indicated recombinant cytokine pairs (right; columns). Black borders indicate significance (z-score > 1). d,e,g,h,j,k, Whole-mouse spatial transcriptomics data (d, g and j) from control and LPS conditions (columns) were magnified to show liver (d), kidney (g) and colon (j) tissues. Normalized expression for cell-type marker genes Serpina1c, Eci3 or Nrn1 was overlaid as on a grayscale H&E image. Bar plots (e, h and k) of average expression of indicated genes across all spatial transcriptomics array spots covering indicated tissues. Error bars indicate the s.e.m. (n > 10, the number of spatial transcriptomics array spots covering indicated tissues). i.p., intraperitoneal.
Fig. 7
Fig. 7. The impact of TNF plus IL-18, IFN-γ or IL-1β on hematopoietic cell types provides a mechanistic basis for sepsis effects on the immune system.
a,f, Cell-type abundance scores computed for indicated cell types (rows) and tissues (colors) upon injection of a sublethal dose of LPS in wild-type (left) or injected with indicated recombinant cytokine pairs (right; columns). Black borders indicate significance (z-score > 1). b,c, Whole-mouse spatial transcriptomics analysis (b) of S100a8 mRNA levels overlaid on a grayscale H&E staining. Shown are whole-mount sections and spatial transcriptomics data from 5-week-old mice injected with a sublethal dose of LPS (5 mg per kg body weight) or left untreated as control. Bar plot (c) of average expression of S100a8 across all spatial transcriptomics array spots covering indicated tissues from Fig. 7b. Error bars indicate the s.e.m. (n > 10, the number of spatial transcriptomics array spots covering indicated tissues). d,e, Images (×40 magnification; d) from Ly6G immunohistochemistry in lungs from mice injected with LPS, indicated cytokines or left untreated as controls. Bar graph (e) shows quantifications of Ly6G+ cells per field of view. Scale bars, 100 µm. Error bars indicate the s.e.m. (n = 10 independent field of view). g,h, Whole-mouse spatial transcriptomics data (g) from control and LPS conditions (columns) were magnified to only show spleen tissue. Cr2 normalized expression was overlaid as cell-type markers on a grayscale H&E image. Bar plot (h) of average expression of Cr2 across all spatial transcriptomics array spots covering indicated tissues. Error bars indicate the s.e.m. (n > 10, the number of spatial transcriptomics array spots covering indicated tissues). i,j, Flow cytometry analysis (i) of splenic B cells from mice injected with a sublethal dose of LPS or indicated cytokines. Bar graphs (j) show quantifications in absolute count per tissue. Error bars indicate the s.e.m. (n = 2 biologically independent samples).
Fig. 8
Fig. 8. A pairwise cytokine code explains the organism-wide effects of sepsis on core cell types.
Schematic, qualitative summary of the impact of the three cytokine pairs indicated (gray scale) on the indicated core cell types (columns and bottom-right legend) across tissues (rows). Red and blue arrows indicate an increase and decrease, respectively, in cell-type abundance score for each cytokine pair on each core cell type in each tissue. LN, lymph node.
Extended Data Fig. 1
Extended Data Fig. 1. Multi-Tissue Expression Analysis of LPS-Induced Sepsis.
a, Heatmaps showing the total numbers of up- (left) and down-regulated (right) genes across time post-LPS (columns) for each organ (rows). b, Normalized counts for indicated genes and organs (color). BM, bone marrow; iLN, inguinal lymph node; PBMCs, peripheral blood mononuclear cells; SI, small intestine. n = 2 biologically independent samples for PBMC 2 days, or 3 days; n = 3 for BM 5 days, colon 0.25 day, iLN. 2 days, liver 1 day, lung 3 days; n = 4 for other groups. c, Expression of sepsis biomarker genes (score) in each organ (rows) at each time point post-sublethal LPS injection (columns). Rows are ordered from top to bottom by high to low scores and by lymphoid and non-lymphoid tissues.
Extended Data Fig. 2
Extended Data Fig. 2. Comparative, Multi-Tissue Expression Analysis across Bacterial Sepsis Models.
a, b, Measurements of rectal temperature (a) and survival (b) after LPS injection at sublethal (5 mg/kg) or lethal (15 mg/kg) doses (left, n = 4 biologically independent samples), or cecal ligation and puncture (CLP) surgeries leading to severe sepsis and sham control (Methods) (right, n = 5 biologically independent samples). c, Dot plots showing log2 fold-change in gene expression in tissues collected at 0.5 day after sublethal LPS injection (x-axis) or severe CLP (y-axis) relative to matching organs from untreated mice for LPS and mice after sham surgery for CLP. Colored dots represent genes regulated in LPS only with FDR < 0.01 and absolute fold change > 2 (LPS-specific; blue), CLP only with FDR < 0.1 (CLP-specific; green), and LPS and CLP (both; orange). BM, bone marrow; iLN, inguinal lymph node.
Extended Data Fig. 3
Extended Data Fig. 3. Recombinant Cytokines Injected Alone or in Pairwise Combinations Impact Tissue Transcriptional States.
ac, Heatmaps of differentially expressed genes (rows) from whole-tissue mRNA profiles ordered by k-means clustering and organ types (top, colors) at 16 hours after injection with indicated recombinant cytokines used alone (a), in three pairwise combinations (b), or in other pairwise combinations (c). Values are log2 fold-changes relative to matching organs from untreated, control mice. Statistical analyses were performed with limma (FDR-adjusted p-value < 0.05, absolute fold change > 2). BM, bone marrow; iLN, inguinal lymph node. d, Sepsis biomarker score average (scaled by condition) across all 9 organs profiled in a, b, and c in indicated recombinant cytokine conditions (x axis). Dashed line indicates one standard deviation. Sepsis biomarker score is the average, absolute log2 fold-change values for all 258 genes identified as sepsis biomarker in the literature. e, Numbers of genes (y axis) regulated in each tissue type by indicated cytokine pairs and composite singles.
Extended Data Fig. 4
Extended Data Fig. 4. The Cytokine PairsComposed of TNF plus IL-18, IFN-γ, or IL-1β Yield Nonlinear Effects on Tissue Transcriptional States.
a, Heatmap (left) of differentially expressed genes (rows) from whole-tissue mRNA profiles ordered by k-means clustering and organ types (top, colors) at 16 hours after injection of indicated recombinant cytokine pairs. Values are log2 fold-changes relative to matching, untreated organs. Statistical analyses were performed with limma (FDR-adjusted p-value < 0.1). Genes synergistically or antagonistically regulated by the indicated recombinant cytokine pairs relative to matching single cytokines in at least of one of the 9 tissues profiled are indicated in orange and green, respectively (right). BM, bone marrow; iLN, inguinal lymph node. b, Percentages (y axis) of differentially expressed genes in each tissue type displaying synergistic (orange) or antagonistic (green) in indicated cytokine pairs relative to matching single cytokines. c, Dot plots of the observed (y axis) and calculated (x axis) pairwise cytokine interaction effects relative to matching single cytokines on DEGs (dots) in indicated organs (top). Percentages and absolute counts of DEGs classified as synergistic (orange) or antagonistic (green) upon pairwise cytokine injection relative to matching singles. dg, Log2 fold-changes (d-e) or normalized counts (f-g) for indicated tissues and genes with nonlinear regulation (orange, synergistic; green, antagonistic) in mice injected with indicated cytokines (d-e) or upon LPS or CLP sepsis (f-g). Error bars, SEM (n = 3 biologically independent samples for liver: rTNF plus rIL-18, thymus: rTNF, rTNF plus rIL-18, rTNF plus IFN-γ and colon: rTNF; n = 5 for CLP; n = 4 for other groups).
Extended Data Fig. 5
Extended Data Fig. 5. The Cytokine Pairs Composed of TNF plus IL-18, IFN-γ, or IL-1β Yield Nonlinear Interactions at the Gene Expression Level across Organs.
Heatmaps of differentially expressed genes (rows) from whole-tissue mRNA profiles for each indicated organ ordered by k-means clustering at 16 hours after injection of indicated recombinant cytokines. Values are log2 fold-changes relative to matching, untreated organs. Statistical analyses were performed with limma (FDR-adjusted p-value < 0.05; absolute fold change > 2). Genes synergistically or antagonistically regulated by the indicated recombinant cytokine pairs relative to matching single cytokines are indicated in orange and green, respectively. LN, lymph node.
Extended Data Fig. 6
Extended Data Fig. 6. The Effect of TNF on the Transcriptional Responses of Organs across Bacterial Sepsis.
a, Heatmaps of differentially expressed genes (rows) from whole-tissue mRNA profiles ordered by k-means clustering and organ types (top, colors) at 0.5 day after sublethal LPS injection in wild-type (left) or Tnf− /− mice (right). Values are log2 fold-changes relative to matching organs from untreated mice for wild-type, or LPS-treated wild-type mice for Tnf− /−. Statistical analyses were performed with limma (FDR-adjusted p-value < 0.01, absolute fold change > 2, or FDR-adjusted p-value < 0.05, absolute fold change > 2). Shown are all the genes found to be differentially regulated in at least one of the indicated conditions (row annotations in black). BM, bone marrow; iLN, inguinal lymph node. b, Percentages (x axis) of genes differentially expressed in tissues (rows) upon sublethal LPS injection in Tnf− /− mice (left) or mice treated with anti-TNF antibodies (1 h prior to LPS; right) that match the genes regulated by LPS in wild-type mice. c, Heatmaps of differentially expressed genes (rows) from whole-tissue mRNA profiles ordered by k-means clustering and organ types (top, colors) at 0.5 day after cecal ligation and puncture (CLP) with pre-treatment with anti-TNF (right) or isotype control (left) antibodies. Values are log2 fold-changes relative to matching organs from sham operated mice for CLP with isotype control antibodies, or CLP operated mice for CLP with anti-TNF antibodies. Statistical analyses were performed with limma (FDR-adjusted p-value < 0.1, or FDR-adjusted p-value < 0.1). Shown are all the genes found to be differentially regulated in at least one of the indicated conditions (row annotations in black).
Extended Data Fig. 7
Extended Data Fig. 7. The Pairwise Effects of TNF plus IL-18, IFN-γ, or IL-1β Lead to Well-Known Sepsis Effects on Cells from Lymphoid and Non-Lymphoid Tissues.
a, Schematic overview of the analytical workflow to predict changes in cell type abundances during sepsis or upon recombinant cytokine injections from bulk, whole-tissue gene expression data. b, Schematic overview of the method to computationally estimate the relative abundance of cell types in organs from treated (LPS, recombinant cytokines) versus untreated, control mice by combining cell type-specific gene sets and whole-tissue gene expression measurements. c, Percentages (black bars; x axis) of the effects of LPS on cell type abundance scores across tissues (y axis) mirrored by at least one of the three cytokine pairs tested: TNF plus IL-18, IFN-γ, or IL-1β. df, Cell type abundance scores computed for indicated cell types (rows) and tissues (colors; top) upon injection of a sublethal dose of LPS in wild-type (left) or injection of indicated recombinant cytokine pairs (right) (columns). Black borders indicate significance (z-score > 1). EM, effector memory; TD, terminally differentiated; NT, naive thymus; DP, double positive; EC, epithelial cell.
Extended Data Fig. 8
Extended Data Fig. 8. Experimental Validation of Changes in Cell Type Abundance Scores Computed from Whole-Tissue Gene Expression Profiles in Kidney and Liver.
a, b, Whole-mouse spatial transcriptomics (ST) data (a) from control and LPS conditions (columns) were magnified to only show kidney tissues. Slc5a12 normalized expression was overlaid as cell type markers on a greyscale H&E image. Bar plot (b) of average expression of indicated genes across all ST array spots covering indicated tissues. Error bars, SEM (n > 10, the number of ST array spots covering kidney). c, d, Images (40X magnification; c) from TUNEL staining in liver from mice injected with LPS, indicated cytokines, or left untreated as controls. Bar graph (d) shows quantifications of TUNEL+ areas (µm2) per field of view. Scale bars, 100 µm; Error bar, SEM (n = 10 independent field of view). ek, Grey-scale H&E images from mouse kidney sections (n = 2) from PBS- (control) or LPS-treated mice processed for commercial spatial transcriptomics platform and overlaid with the numbers of genes (e) or UMIs (g) detected per spot, or with spatial clusters annotated with known kidney histological regions (i). Violin plots show the matching distributions of the numbers of genes (f) and UMIs (h) per spot. Overlayed box plots (f, h) show the median, 25th and 75th percentiles. Spatial gene expression analysis (j) of indicated genes (rows) from control or LPS-treated mice (columns) overlaid on grey-scale H&E images from mouse kidney sections. Bar graphs (k) show the mean expression of each gene (top) across spatial transcriptomics spots and replicate sections (n = 2 biologically independent samples).
Extended Data Fig. 9
Extended Data Fig. 9. Experimental Validation of Changes in Cell Type Abundance Scores Computed from Whole-Tissue Gene Expression Profiles in Lung, Spleen, and Thymus.
a, Cell type abundance scores computed for macrophages upon injection of a sublethal dose of LPS in wild-type (left) or injected with indicated recombinant cytokine pairs (right) (columns). b, c, Whole-mouse spatial transcriptomics (ST) analysis (b) of Marco mRNA levels overlaid on a greyscale H&E staining. Shown are whole-mount sections and ST data from 5-weeks old mice injected with a sublethal dose of LPS (5 mg/kg) or left untreated as control. Bar plot (c) of average expression of Marco across all ST array spots covering indicated tissues. Error bar, SEM (n > 10, the number of ST array spots covering indicated tissues). d, e, Images (40X magnification; d) from F4/80 immunohistochemistry in thymus tissues from mice injected with LPS, indicated cytokines, or left untreated as controls. Bar graph (e) shows quantifications of F4/80+ areas per field of view (FOV) from (d). Scale bars, 100 µm; Error bar, SEM (n = 15 independent field of view). f, Cell type abundance scores computed for red blood cells upon injection of a sublethal dose of LPS in wild-type (left) or injected with indicated recombinant cytokine pairs (right) (columns). g, h, Flow cytometry analysis (g) of bone marrow erythrocytes from mice injected with a sublethal dose of LPS or indicated cytokines. Bar graph (h) shows quantifications in absolute count per tissue (n = 4 biologically independent samples). i, j, Flow cytometry plots of gating strategy used for splenic B cells (i) and erythrocytes (j).
Extended Data Fig. 10
Extended Data Fig. 10. The Effects of perturbation on Cell Type Abundance Scores Computed from Whole-Tissue Gene Expression Profiles.
Cell type abundance scores computed for indicated cell types (row) upon injection of a sublethal dose of LPS in wild-type (left) or indicated knockout animals pre-treated with indicated neutralizing antibodies (right) or injected with indicated recombinant cytokine pairs (center) (columns). BM, bone marrow.

Update of

References

    1. Singer M, et al. The Third International Consensus Definitions for Sepsis and Septic Shock (Sepsis-3) JAMA. 2016;315:801–810. doi: 10.1001/jama.2016.0287. - DOI - PMC - PubMed
    1. Marshall JC. Why have clinical trials in sepsis failed? Trends Mol. Med. 2014;20:195–203. doi: 10.1016/j.molmed.2014.01.007. - DOI - PubMed
    1. Reinhart K, et al. Recognizing sepsis as a global health priority—a WHO resolution. N. Engl. J. Med. 2017;377:414–417. doi: 10.1056/NEJMp1707170. - DOI - PubMed
    1. Cavaillon J-M, Singer M, Skirecki T. Sepsis therapies: learning from 30 years of failure of translational research to propose new leads. EMBO Mol. Med. 2020;12:e10128. doi: 10.15252/emmm.201810128. - DOI - PMC - PubMed
    1. Rubio I, et al. Current gaps in sepsis immunology: new opportunities for translational research. Lancet Infect. Dis. 2019;19:e422–e436. doi: 10.1016/S1473-3099(19)30567-5. - DOI - PubMed