. 2024 Apr;45(4):714-727.
doi: 10.1038/s41401-023-01218-z. Epub 2024 Jan 8.

O-GlcNAcylation mediates H2O2-induced apoptosis through regulation of STAT3 and FOXO1

Affiliations

O-GlcNAcylation mediates H2O2-induced apoptosis through regulation of STAT3 and FOXO1

Chen-Chun Zhang et al. Acta Pharmacol Sin. 2024 Apr.

Abstract

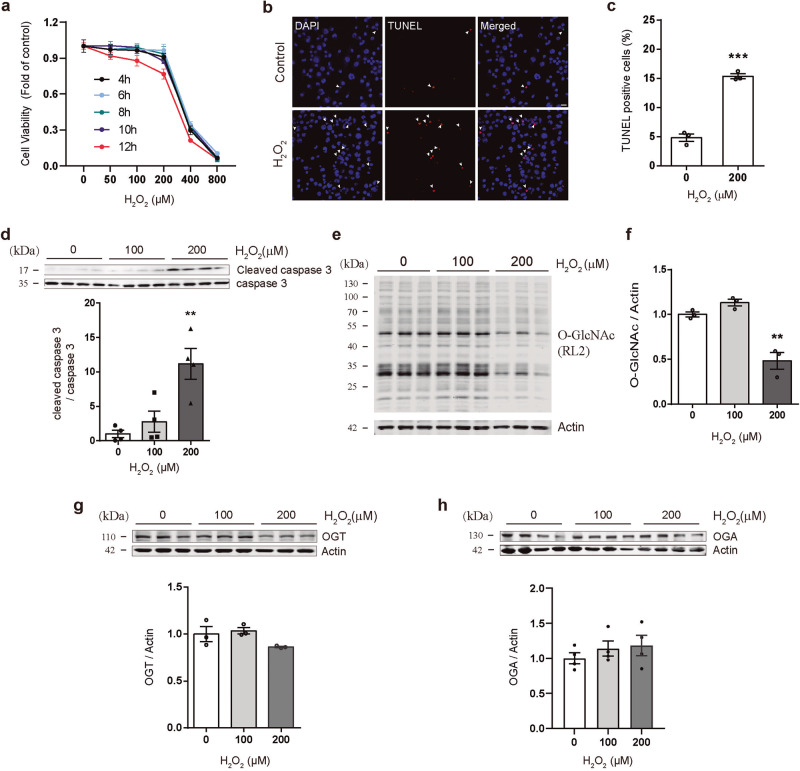
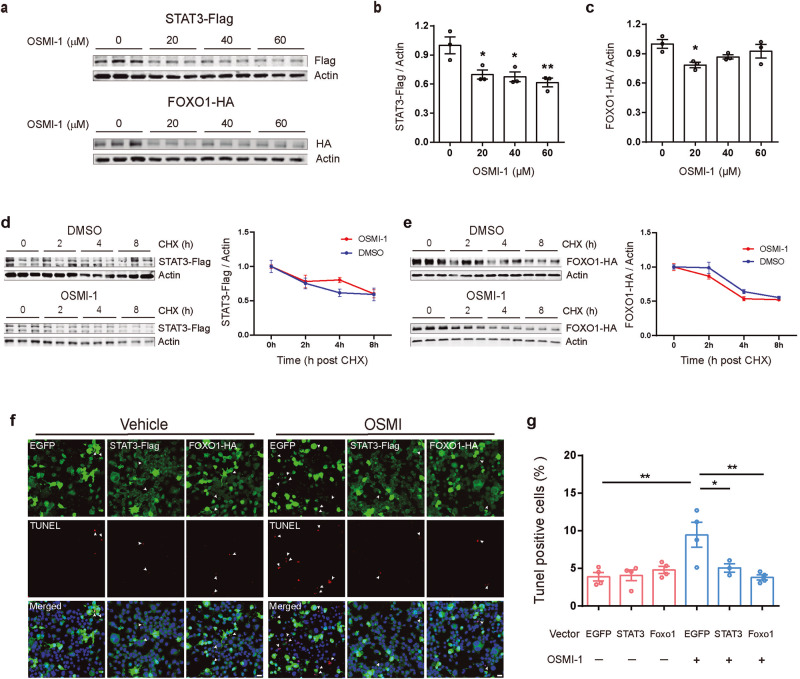
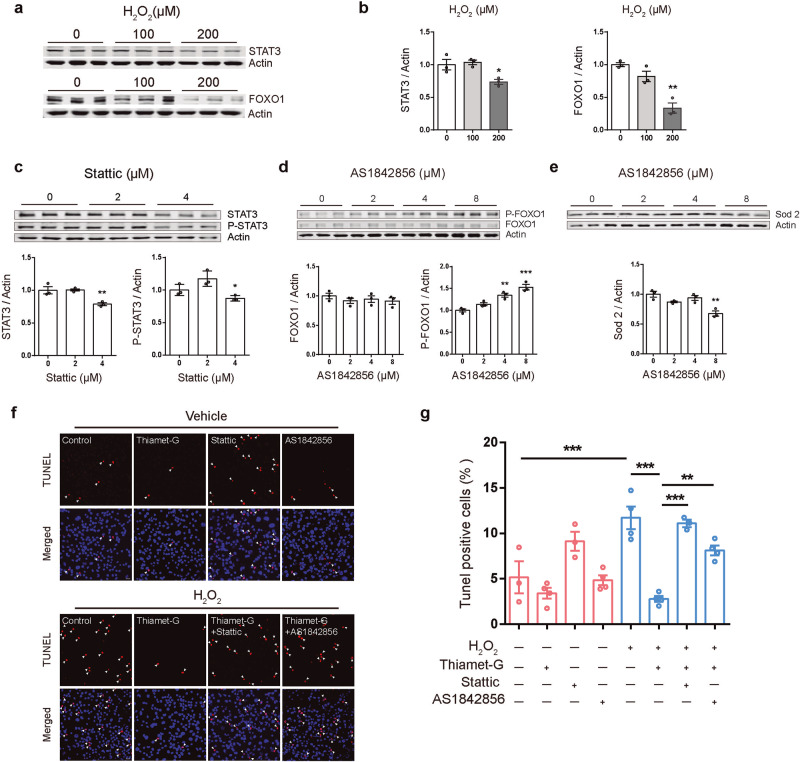
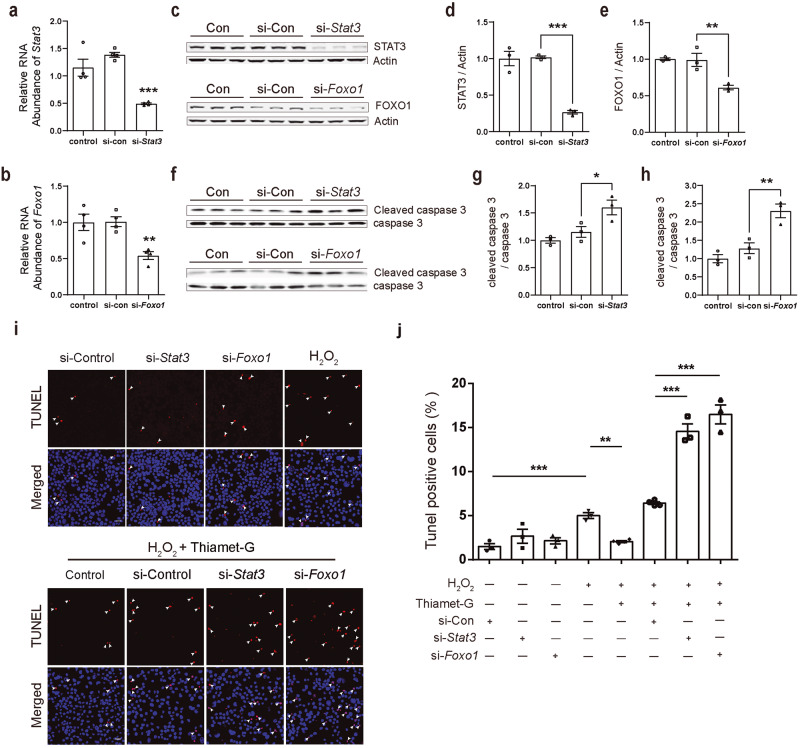
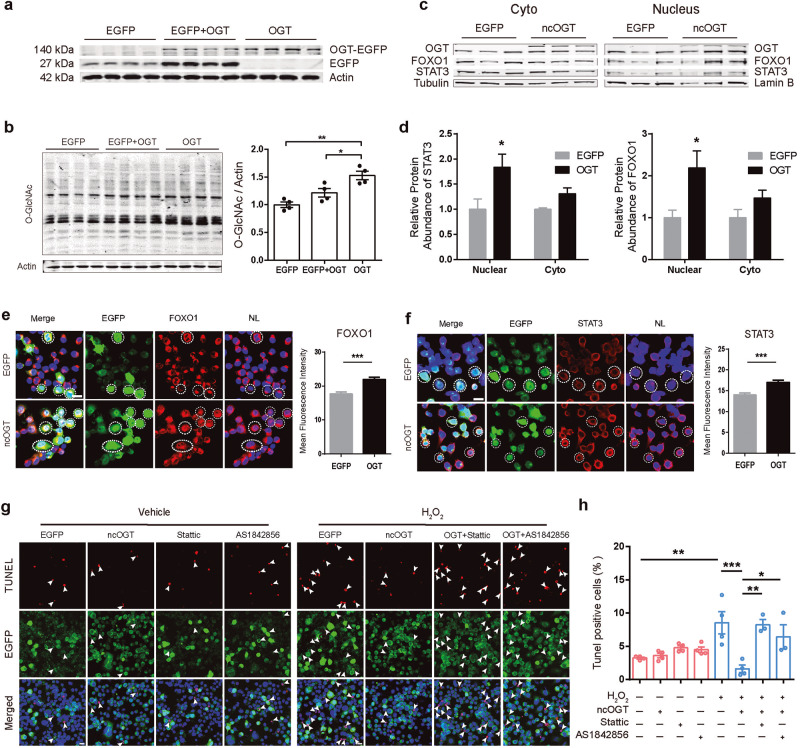
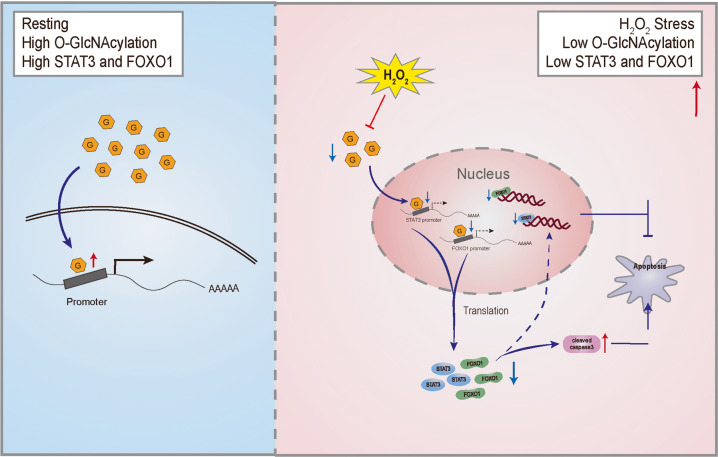
The O-linked-β-N-acetylglucosamine (O-GlcNAc) glycosylation (O-GlcNAcylation) is a critical post-translational modification that couples the external stimuli to intracellular signal transduction networks. However, the critical protein targets of O-GlcNAcylation in oxidative stress-induced apoptosis remain to be elucidated. Here, we show that treatment with H2O2 inhibited O-GlcNAcylation, impaired cell viability, increased the cleaved caspase 3 and accelerated apoptosis of neuroblastoma N2a cells. The O-GlcNAc transferase (OGT) inhibitor OSMI-1 or the O-GlcNAcase (OGA) inhibitor Thiamet-G enhanced or inhibited H2O2-induced apoptosis, respectively. The total and phosphorylated protein levels, as well as the promoter activities of signal transducer and activator of transcription factor 3 (STAT3) and Forkhead box protein O 1 (FOXO1) were suppressed by OSMI-1. In contrast, overexpressing OGT or treating with Thiamet-G increased the total protein levels of STAT3 and FOXO1. Overexpression of STAT3 or FOXO1 abolished OSMI-1-induced apoptosis. Whereas the anti-apoptotic effect of OGT and Thiamet-G in H2O2-treated cells was abolished by either downregulating the expression or activity of endogenous STAT3 or FOXO1. These results suggest that STAT3 or FOXO1 are the potential targets of O-GlcNAcylation involved in the H2O2-induced apoptosis of N2a cells.

Keywords: FOXO1; O-GlcNAcylation; STAT3; apoptosis; oxidative stress.


Conflict of interest statement

The authors declare no competing interests.

Figures

Fig. 1
Fig. 1. H2O2 induces cell apoptosis and decreases O-GlcNAcylation in N2a cells.
a The cell counting assay showed that H2O2 inhibited the viability of N2a cells in a time- and dose-dependent manner. b Representative images of confocal microscopy combined with TUNEL assays (Scale bar = 20 μm). c, d 200 μM H2O2 treatment increased cell apoptosis and cleaved caspase 3 expression. e, f Western blotting (4%–20% SDS-PAGE) revealed that H2O2 treatment induced a reduction in O-GlcNAc levels. g, h Western blotting showed H2O2 treatment had no significant change on OGT and OGA levels. The values are expressed as the means ± SEMs (n = 3 per group). *P < 0.05; **P < 0.01; ***P < 0.001.
Fig. 2
Fig. 2. Inhibition of O-GlcNAcylation by OSMI-1 enhances cell apoptosis in N2a cells.
a N2a cells were treated with varying concentrations of OSMI-1 (0–100 μM) for 12 h. Global O-GlcNAcylation was examined via Western blot (10% SDS-PAGE), β-actin was used as an internal control. b OSMI-1 treatment led to a dose-dependent decrease of O-GlcNAc levels (n = 3). c Cell counting assay showed that OSMI-1 inhibited the viability of N2a cells in a dose-dependent manner after incubation for 12 h (n = 4). d N2a cells were treated with variant concentrations of TG (0-10 μM) for 12 h. Global O-GlcNAc were examined via Western blot (10% SDS-PAGE), β-actin was used as an internal control. e TG treatment led to a dose-dependent increase of O-GlcNAc levels (n = 4). f Cell counting assay showed that TG has no significant effect on the viability of N2a cells after incubation for 12 h (n = 5). g, h Representative images and quantification analyses of the TUNEL assays detecting the effect of OSMI-1 (60 μM) and TG (5 μM) on the apoptosis of N2a cells treated with either vehicle or H2O2 (n = 4). Scale bar: 20 μm. DATA are expressed as the means ± SEM. *P < 0.05; **P < 0.01; ***P < 0.001.
Fig. 3
Fig. 3. The total and phosphorylated protein level of STAT3 and FOXO1 in N2A cells were bidirectionally regulated by OSMI-1 or TG.
a, b Western blotting showed that OSMI-1 (60 μM) treatment inhibited STAT3 expression and phosphorylation (n = 3). c, d Western blotting showed that OSMI-1 (60 μM) treatment inhibited FOXO1 expression and phosphorylation (n = 3). e, f Western blotting showed that TG (5 and 50 μM) treatment promoted the total and phosphorylated STAT3 protein level (n = 3). g, h Western blotting showed that TG (5 and 50 μM) treatment promoted the total and phosphorylated FOXO1 protein level (n = 3). Data are presented as mean ± SEM (n = 3 per group). *P < 0.05, **P < 0.01, ***P < 0.001.
Fig. 4
Fig. 4. The promoter activities of STAT3 and FOXO1 were decreased by OSMI-1, while the promoter activities of STAT3 was increased by OGT overexpression.
a Schematic of different truncated fragments of the promoter. Green squares: possible transcription factor binding sequences on the STAT3 and FOXO1 promoters. b OSMI-1 (60 μM) treatment markedly reduced the reporter signal containing different fragments with promoters of Stat3 or Foxo1 (n = 3/4). c qPCR showed that OSMI-1 treatment did not affect mRNA stability of both Stat3 and Foxo1 (n = 3). d OSMI-1 treatment affected mRNA level of both Stat3 and Foxo1 (n = 3). e OGT overexpression increased mRNA levels of ogt (n = 3). f OGT overexpression elevated the promoter activity of Stat3 but had no effect on Foxo1 (n = 3). g qPCR showed that OGT overexpression did not affect mRNA stability of both Stat3 and Foxo1 (n = 3). h OGT overexpression increased mRNA levels of Stat3 without effect on Foxo1 (n = 3). Data are presented as mean ± SEM. **P < 0.01; ***P < 0.001.
Fig. 5
Fig. 5. Overexpression of exogenous STAT3 or FOXO1 resists apoptosis induced by OSMI-1.
ac N2a cells were transfected with STAT3-Flag or FOXO1-HA plasmid for 36 h and subsequently treated with the indicated concentrations of OSMI-1 for 12 h. Western blotting showed that OSMI-1 (20, 40 and 60 μM) treatment inhibited STAT3 and FOXO1 overexpression (n = 3). d, e Western blotting showed that OSMI-1 did not affect the degradation of exogenous protein level of STAT3-Flag (d) and FOXO1-HA (e). f Representative immunofluorescence images showing the co-labeling of TUNEL and anti-HA or anti-Flag antibodies in the N2a cells under DMSO or OSMI-1 treatment. Green, EGFP/ Flag/ HA; red, TUNEL; blue, DAPI; White arrows, co-labeled cells; scale bars, 20 μm. g Overexpression of STAT3 or FOXO1 protein significantly attenuated the apoptosis induced by OSMI-1 treatment without causing any changes in basal apoptosis levels. Data are presented as mean ± SEM (n = 3–4 per group). *P < 0.05; **P < 0.01.
Fig. 6
Fig. 6. The protective effect of thiamet-G (TG) against H2O2-induced apoptosis was alleviated by STAT3 or FOXO1 inhibitors.
a, b Western blot showing that STAT3 and FOXO1 protein levels were both significantly downregulated when cells were treated with 200 μM H2O2 (n = 3). c N2a cells were treated with the indicated concentrations of Stattic (0, 2 and 4 μM) for 12 h. Whole-cell extracts were then prepared and the levels of P-STAT3 (S727) and STAT3 were examined by Western blot analysis. β-actin was used as internal control. Stattic 4 μM treatment significantly inhibited the expression of STAT3 (n = 3). d, e N2a cells were treated with the indicated concentrations of AS1842856 (0, 2, 4 and 8 μM) for 12 h. Whole-cell extracts were then prepared and the levels of P-FOXO1 (S256), Foxo1 and Sod2 were examined by Western blot analysis. β-actin was used as internal control. AS1842856 8 μM treatment significantly promoted the phosphorylation of FOXO1 and reduced the protein level of Sod2 (n = 3). f Cells pre-treated with 5 μM Thiamet-G were incubated with 4 μM Stattic or 8 μM AS1842856 for 12 h, then stimulated of 200 μM H2O2 for 12 h. Representative immunofluorescence images showing the apoptosis rate in the N2a cells under different treatment (Red, TUNEL; Blue, DAPI; White arrows indicate TUNEL positive cells; scale bars, 20 μm). g TG resisted H2O2-induced apoptosis, whereas the anti-apoptotic effect of TG is blocked when the specific inhibitors were presented (n = 3/4). Data are presented as mean ± SEM. *P < 0.05; **P < 0.01; ***P < 0.001.
Fig. 7
Fig. 7. Knockdown of Stat3 or Foxo1 promotes caspase 3 activation and abolishes the protective effect of Thiamet-G against H2O2-induced apoptosis.
a, b qPCR showed that specific siRNA inhibits mRNA level ofStat3 and Foxo1 (n = 3). ce Western blotting showed that Stat3- or Foxo1- siRNA treatment inhibited endogenous STAT3 or FOXO1 protein level (n = 3). fh Western blotting showed that si-Stat3 or si-Foxo1 treatment promoted caspase 3 activation (n = 3). i, j Representative immunofluorescence images showing the labeling of TUNEL in the N2a cells under different treatment. (red, TUNEL; blue, DAPI; white arrows, co-labeled cells; scale bars, 50 μm). Data are presented as mean ± SEM (n = 3–5 per group). *P < 0.05, **P < 0.01, ***P < 0.001.
Fig. 8
Fig. 8. STAT3 and FOXO1 are involved in the protective effect of OGT against H2O2-induced apoptosis.
a, b N2a cells were transfected with pEGFP-ncOGT or EGFP plasmid for 48 h. Whole-cell extracts were then prepared and the levels of EGFP and O-GlcNAc were examined by Western blot analysis, β-actin was used as internal control. c, d Western blotting showed that ncOGT overexpression increased the STAT3 and FOXO1 protein level in the nucleus extracts (n = 3) e, f Left: Representative immunofluorescence images showing STAT3 and FOXO1 protein level in the N2a cells under different transfections (green, ncOGT/EGFP; red, STAT3/FOXO1; blue, DAPI; white dashed circles, co-labeled cells; scale bars, 20 μm). Right: ncOGT overexpression increased the overall STAT3 and FOXO1 protein level (n = 254 cells). g N2a cells were transfected with pEGFP-ncOGT or EGFP plasmid for 36 h and 4 μM Stattic or 8 μM AS1842856 was added for 12 h, then stimulated with 200 μM H2O2 for another 12 h. Representative immunofluorescence images showing the apoptosis rate in the N2a cells under different treatment (Green, ncOGT/EGFP; Red, TUNEL; Blue, DAPI; White arrows indicate TUNEL positive cells; scale bars, 20 μm). h ncOGT overexpression was able to resist apoptosis promoted by H2O2, and this protective effect against oxidative stress is also blocked when acting in parallel with STAT3 or FOXO1 inhibitors. Data are presented as mean ± SEM (n = 3–4 per group). *P < 0.05; **P < 0.01; ***P < 0.001.
Fig. 9
Fig. 9. O-GlcNAcylation-regulated expression of STAT3 and FOXO1 is involved in H2O2-induced apoptosis in N2a cells.
Left (blue): Intracellular protein O-GlcNAcylation level is stable and involved in the regulation of gene expression and signal transduction which is necessary to maintain cellular physiological processes. Right (red): After chronic H2O2 induced oxidative stress, intracellular level of O-GlcNAcylation is downregulated, resulting in decreased promoter activity of STAT3 and FOXO1, which inhibits their protein expression, increases the activation of caspase 3, and thereby exacerbating the redox imbalance and driving apoptosis.

References

    1. Apel K, Hirt H. Reactive oxygen species: metabolism, oxidative stress, and signal transduction. Annu Rev Plant Biol. 2004;55:373–99. doi: 10.1146/annurev.arplant.55.031903.141701. - DOI - PubMed
    1. Alpay M, Backman LR, Cheng X, Dukel M, Kim WJ, Ai L, et al. Oxidative stress shapes breast cancer phenotype through chronic activation of ATM-dependent signaling. Breast Cancer Res Treat. 2015;151:75–87. doi: 10.1007/s10549-015-3368-5. - DOI - PubMed
    1. Harris IS, Denicola GM. The complex interplay between antioxidants and ROS in cancer. Trends Cell Biol. 2020;30:440–51. doi: 10.1016/j.tcb.2020.03.002. - DOI - PubMed
    1. Bai R, Guo J, Ye XY, Xie Y, Xie T. Oxidative stress: the core pathogenesis and mechanism of Alzheimer’s disease. Ageing Res Rev. 2022;77:101619. doi: 10.1016/j.arr.2022.101619. - DOI - PubMed
    1. Chu CS, Lo PW, Yeh YH, Hsu PH, Peng SH, Teng YC, et al. O-GlcNAcylation regulates EZH2 protein stability and function. Proc Natl Acad Sci USA. 2014;111:1355–60. doi: 10.1073/pnas.1323226111. - DOI - PMC - PubMed

Substances

LinkOut - more resources