. 2024 Feb;21(2):217-227.
doi: 10.1038/s41592-023-02139-9. Epub 2024 Jan 8.

A fast, scalable and versatile tool for analysis of single-cell omics data

Affiliations

A fast, scalable and versatile tool for analysis of single-cell omics data

Kai Zhang et al. Nat Methods. 2024 Feb.

Abstract

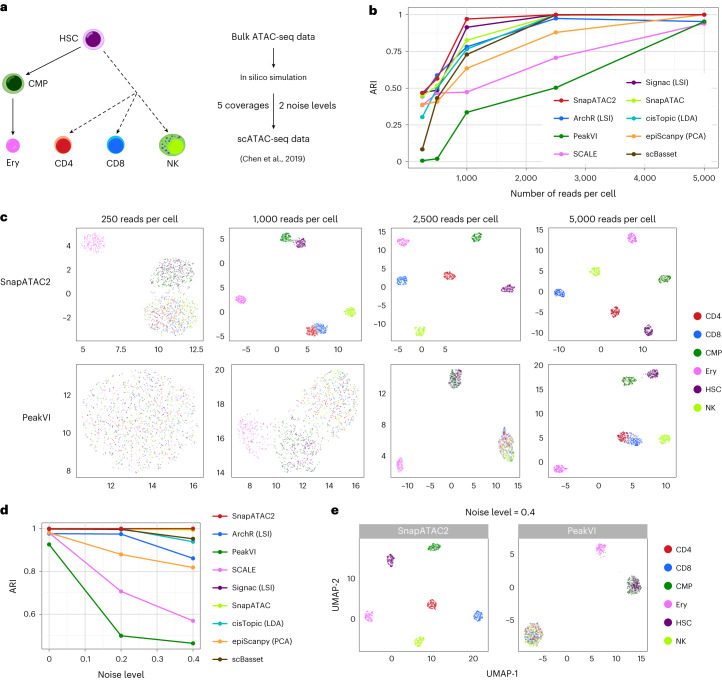
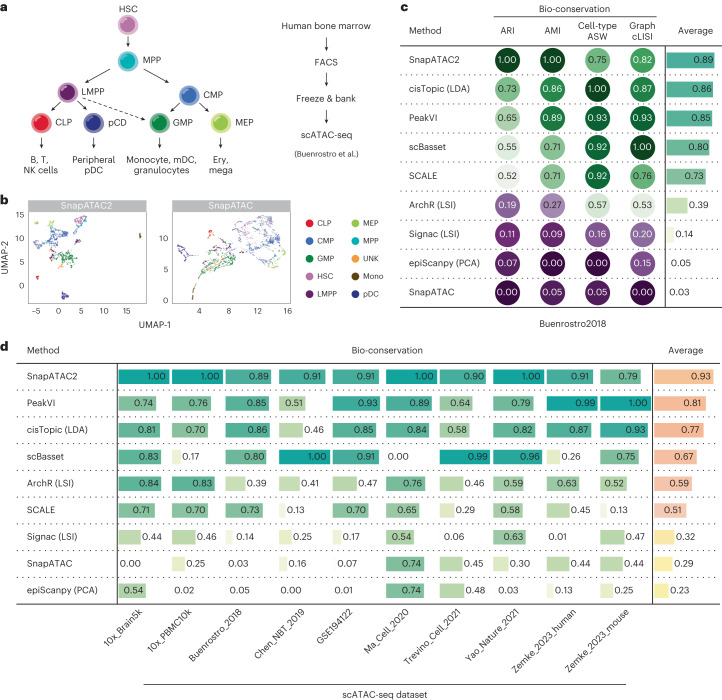
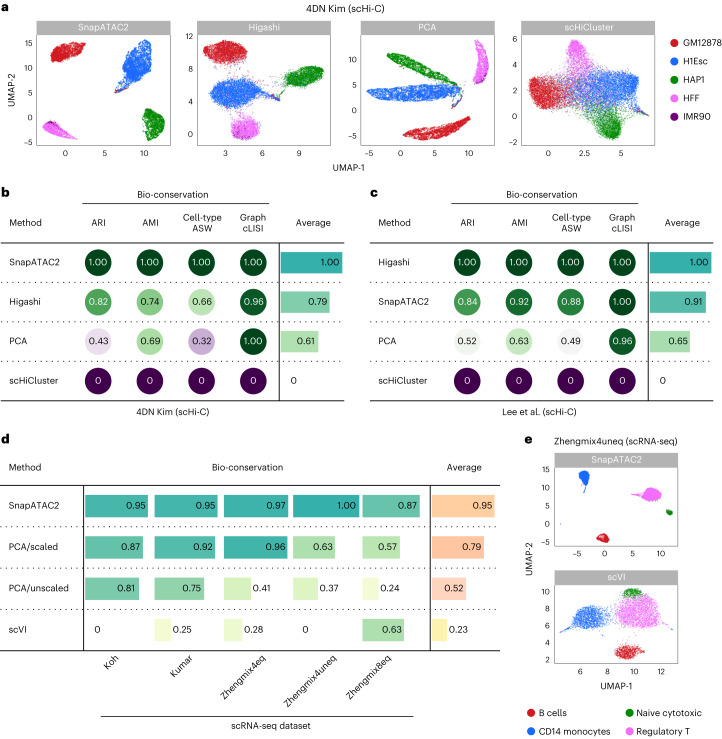
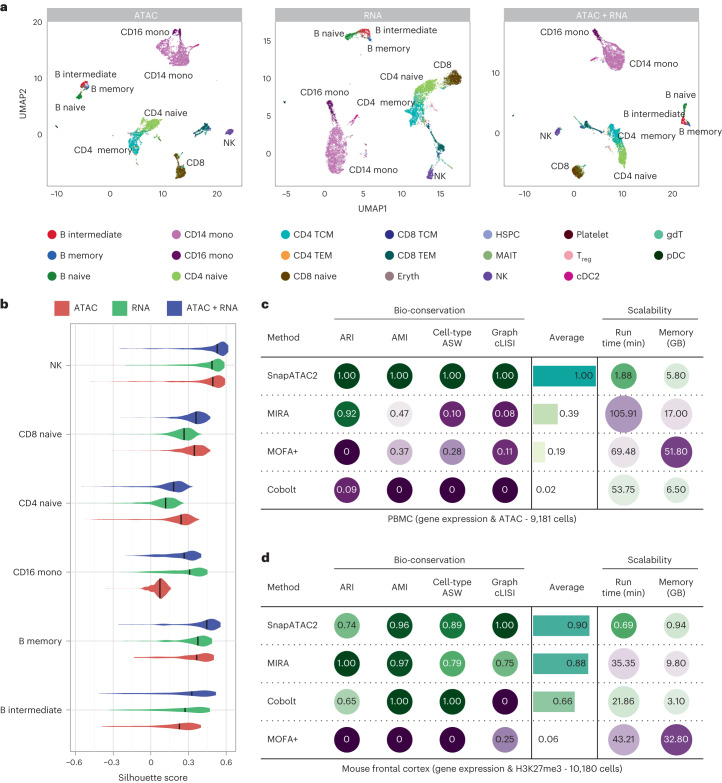
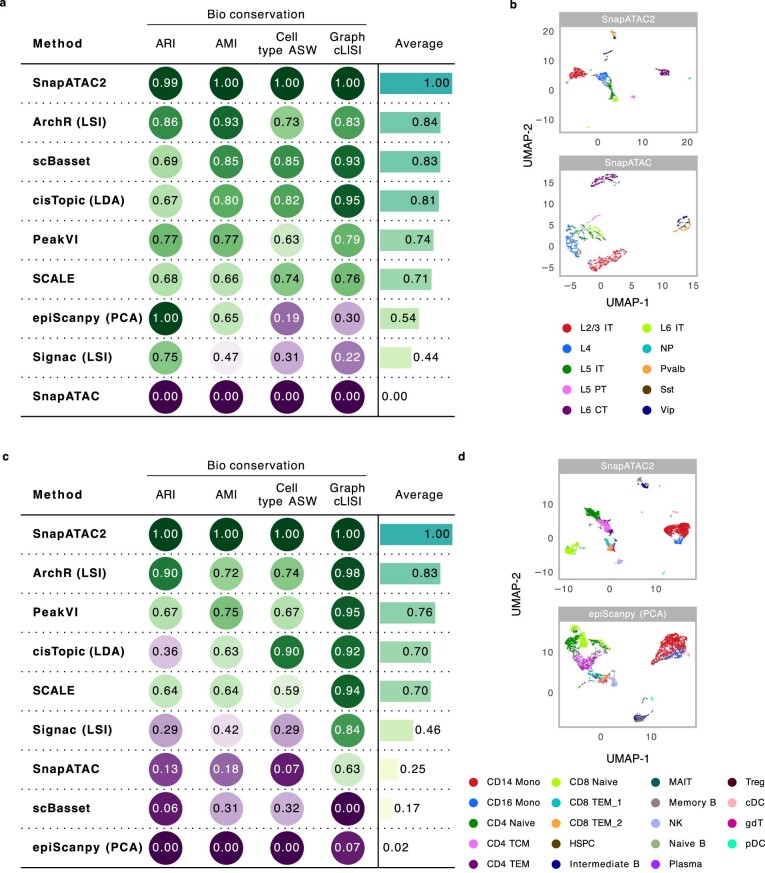
Single-cell omics technologies have revolutionized the study of gene regulation in complex tissues. A major computational challenge in analyzing these datasets is to project the large-scale and high-dimensional data into low-dimensional space while retaining the relative relationships between cells. This low dimension embedding is necessary to decompose cellular heterogeneity and reconstruct cell-type-specific gene regulatory programs. Traditional dimensionality reduction techniques, however, face challenges in computational efficiency and in comprehensively addressing cellular diversity across varied molecular modalities. Here we introduce a nonlinear dimensionality reduction algorithm, embodied in the Python package SnapATAC2, which not only achieves a more precise capture of single-cell omics data heterogeneities but also ensures efficient runtime and memory usage, scaling linearly with the number of cells. Our algorithm demonstrates exceptional performance, scalability and versatility across diverse single-cell omics datasets, including single-cell assay for transposase-accessible chromatin using sequencing, single-cell RNA sequencing, single-cell Hi-C and single-cell multi-omics datasets, underscoring its utility in advancing single-cell analysis.


Conflict of interest statement

B.R. is a cofounder of Epigenome Technologies, and a cofounder and consultant of Arima Genomics. The remaining authors declare no competing interests.

Figures

Fig. 1
Fig. 1. SnapATAC2 enables comprehensive and scalable analysis of scATAC-seq data.
a, Overview of the SnapATAC2 Python package, featuring four primary modules: preprocessing, embedding/clustering, functional enrichment analysis and multimodal analysis. b, Schematic representation of the matrix-free spectral embedding algorithm in SnapATAC2, consisting of four main steps: feature scaling with inverse term frequency, row-wise L2 norm normalization, normalization using the degree matrix and eigenvector calculation through the Lanczos algorithm. c, Line plots comparing running times of various dimensionality reduction algorithms for scATAC-seq data. d, Line plots comparing memory usage of various dimensionality reduction algorithms for scATAC-seq data. Neural network-based methods were excluded from this comparison because their memory usage does not scale with the number of cells (Methods). e, Runtime comparison between ArchR and SnapATAC2 for end-to-end analysis of 92 raw BAM files produced by scATAC-seq experiments. TSS, transcription start site; QC, quality control. Source data
Fig. 2
Fig. 2. SnapATAC2’s dimensionality reduction algorithm is robust to various noise levels and sequencing depths.
a, Schema of the synthetic scATAC-seq datasets used in the present study. b, Line plot showing the ARI (y axis) as a function of the number of reads per cell (x axis) for nine dimensionality reduction methods. c, UMAP visualization of the embeddings generated by the best performing method (SnapATAC2) and the worst performing method (PeakVI) for the simulated dataset with varying sequencing depths. Individual cells are color coded based on the cell-type labels indicated in a. d, Line plot showing the ARI (y axis) as a function of the noise level (x axis) for nine dimensionality reduction methods. e, UMAP visualization of the embeddings generated by the best performing method (SnapATAC2) and the worst performing method (PeakVI) for the simulated dataset at a noise level of 0.4. Individual cells are color coded based on the cell-type labels indicated in a. CMP, common myeloid progenitor; Ery, erythroid; HSC, hematopoietic stem cell; NK, natural killer. Source data
Fig. 3
Fig. 3. Benchmarking of SnapATAT2 and other dimensionality reduction algorithms using real scATAC-seq data with cell labels.
a, Overview of cell types analyzed in the Buenrostro et al. scATAC-seq dataset. b, UMAP visualization of the embeddings generated by the best performing method (SnapATAC2) and the worst performing method (original SnapATAC) for the Buenrostro et al. dataset. Individual cells are color coded based on the cell-type labels indicated in a. c, Table displaying normalized scores (0–1 range) of four metrics used to evaluate each method’s bio-conservation on the Buenrostro et al. dataset. A score of 1 indicates optimal performance. See Methods for metric details. d, Table displaying the bio-conservation scores of nine dimensionality reduction methods across ten benchmark datasets (Extended Data Figs. 2–6). CLP, common lymphoid progenitor; GMP, granulocyte–macrophage progenitor; LMPP, lymphoid-primed multipotent progenitor; MEP, megakaryocyte–erythroid progenitor; mono, monocyte; MPP, multipotent progenitor; pDC, plasmacytoid dendritic cell. Source data
Fig. 4
Fig. 4. SnapATAC2 demonstrates superior performance over other methods on scHi-C and scRNA-seq datasets.
a, UMAP visualization of the embeddings generated by Higashi, SnapATAC2, scHiCluster and PCA for the 4DN dataset by Kim et al. Cells are color coded based on cell-type labels. b, Table displaying normalized scores (0–1 range) of four metrics used to evaluate each method’s bio-conservation on the 4DN dataset by Kim et al.. c, Table displaying normalized scores (0–1 range) of four metrics used to evaluate each method’s bio-conservation on the Lee et al. dataset. d, Table displaying the bio-conservation scores of four dimensionality reduction methods across five benchmark datasets (Extended Data Fig. 7). e, UMAP visualization of the embeddings produced by the best performing method (SnapATAC2) and the worst performing method (scVI) for the Zhengmix4uneq dataset. Cells are color coded according to cell-type labels. Source data
Fig. 5
Fig. 5. SnapATAC2 enables robust joint embedding of single-cell multi-omics data.
a, UMAP visualization of the embeddings generated by SnapATAC2 using ATAC modality (left), RNA modality (middle) or both modalities (right) on a 10x Genomics Multiome dataset consisting of 9,181 human PBMCs. Cells are color coded based on cell-type labels. b, Violin plot comparing the silhouette scores of selected cell types derived from embeddings produced by the ATAC modality, the RNA modality or both modalities. The black line within each curve indicates the median value. c, Table comparing bio-conservation and scalability metrics of various joint embedding methods on 10x Genomics Multiome data from human PBMCs. d, Table comparing bio-conservation and scalability metrics of various joint embedding methods on Paired-Tag data from mouse frontal cortex. Source data
Extended Data Fig. 1
Extended Data Fig. 1. SnapATAC2 excels at identifying rare cell types.
a, Line plot showing the average silhouette scores of CD8+ T cells (Y-axis) as a function of the fraction of CD8+ T cells in the dataset (X-axis) across nine dimensionality reduction methods. b, UMAP visualization of the embeddings produced by selected methods on the datasets with varying fractions (0.5%, 1%, 5%) of CD8+ T cells.
Extended Data Fig. 2
Extended Data Fig. 2. Benchmarking of dimensionality reduction methods on 10× Brain 5k and PBMC 10k datasets.
a,c, Tables displaying normalized scores (0–1 range) of four metrics used to evaluate each method’s bio-conservation on the 10× Brain 5k (a) and PBMC 10k (c) datasets. A score of 1 indicates optimal performance. See Methods for metric details. b,d, UMAP visualizations of the embeddings generated by the best performing method and the worst performing method on the 10× Brain 5k (b) and PBMC 10k (d) datasets. Cells are color-coded by cell type labels.
Extended Data Fig. 3
Extended Data Fig. 3. Benchmarking of dimensionality reduction methods on the Chen et al. and GSE194122 datasets.
a,c Tables displaying normalized scores (0–1 range) of four metrics used to evaluate each method’s bio-conservation on the Chen et al. (a) and GSE194122 (c) datasets. A score of 1 indicates optimal performance. See Methods for metric details. b,d, UMAP visualizations of the embeddings generated by the best performing method and the worst performing method on the Chen et al. (b) and GSE194122 (d) datasets. Cells are color-coded by cell type labels.
Extended Data Fig. 4
Extended Data Fig. 4. Benchmarking of dimensionality reduction methods on the Ma et al. and Trevino et al. datasets.
a,c, Tables displaying normalized scores (0–1 range) of four metrics used to evaluate each method’s bio-conservation on the Ma et al. (a) and Trevino et al. (c) datasets. A score of 1 indicates optimal performance. See Methods for metric details. b,d, UMAP visualizations of the embeddings generated by the best performing method and the worst performing method on the Ma et al. (b) and Trevino et al. (d) datasets. Cells are color-coded by cell type labels.
Extended Data Fig. 5
Extended Data Fig. 5. Benchmarking of dimensionality reduction methods on the Yao et al. and Zemke et al. human datasets.
a,c, Tables displaying normalized scores (0–1 range) of four metrics used to evaluate each method’s bio-conservation on the Yao et al. (a) and Zemke et al. human (c) datasets. A score of 1 indicates optimal performance. See Methods for metric details. b,d, UMAP visualizations of the embeddings generated by the best performing method and the worst performing method on the Yao et al. (b) and Zemke et al. human (d) datasets. Cells are color-coded by cell type labels.
Extended Data Fig. 6
Extended Data Fig. 6. Benchmarking of dimensionality reduction methods on the Zemke et al. mouse dataset.
a, Table displaying normalized scores (0–1 range) of four metrics used to evaluate each method’s bio-conservation. A score of 1 indicates optimal performance. See Methods for metric details. b, UMAP visualization of the embeddings generated by the best performing method and the worst performing method. Cells are color-coded by cell type labels.
Extended Data Fig. 7
Extended Data Fig. 7. SnapATAC2 demonstrates superior performance over other methods on scRNA-seq datasets.
Table displaying normalized scores (0–1 range) of four metrics used to evaluate each method’s bio-conservation on five datasets, including Koh (a), Kumar (b), Zhengmix4eq (c), Zhengmix4uneq (d), and Zhengmix8eq (e).
Extended Data Fig. 8
Extended Data Fig. 8. SnapATAC2 unveils fine-grained cellular heterogeneity in single-cell DNA methylation data from Ruf-Zamojski et al.
UMAP visualization of cell embedding generated by SnapATAC2. Cells are colored by cell type labels.
Extended Data Fig. 9
Extended Data Fig. 9. SnapATAC2 remains robust and reliable when processing datasets with batch effects.
Tables showing the aggregated scores for bio-conservation and batch correction metrics across different scRNA-seq datasets (a) and scATAC-seq datasets (b) for each method. For more details, see Supplementary Tables 1 and 2.
Extended Data Fig. 10
Extended Data Fig. 10. The pseudocodes of various algorithms used in this study.
a, The pseudocode of the matrix-free spectral embedding algorithm. b, The pseudocode of the Nyström algorithm for performing the out-of-sample embedding. c, The pseudocode for performing orthogonalization on the eigenvectors produced by the Nyström algorithm. d, The pseudocode of the matrix-free multi-view spectral embedding algorithm.

Update of

References

    1. Preissl S, Gaulton KJ, Ren B. Characterizing cis-regulatory elements using single-cell epigenomics. Nat. Rev. Genet. 2022;24:21–43. doi: 10.1038/s41576-022-00509-1. - DOI - PMC - PubMed
    1. Lähnemann D, et al. Eleven grand challenges in single-cell data science. Genome Biol. 2020;21:31. doi: 10.1186/s13059-020-1926-6. - DOI - PMC - PubMed
    1. Wolf FA, Angerer P, Theis FJ. SCANPY: large-scale single-cell gene expression data analysis. Genome Biol. 2018;19:15. doi: 10.1186/s13059-017-1382-0. - DOI - PMC - PubMed
    1. Hao Y, et al. Integrated analysis of multimodal single-cell data. Cell. 2021;184:3573–3587. doi: 10.1016/j.cell.2021.04.048. - DOI - PMC - PubMed
    1. Granja JM, et al. ArchR is a scalable software package for integrative single-cell chromatin accessibility analysis. Nat. Genet. 2021;53:403–411. doi: 10.1038/s41588-021-00790-6. - DOI - PMC - PubMed