. 2024 Mar;11(11):e2306824.
doi: 10.1002/advs.202306824. Epub 2024 Jan 8.

Native Capillary Electrophoresis-Mass Spectrometry of Near 1 MDa Non-Covalent GroEL/GroES/Substrate Protein Complexes

Affiliations

Native Capillary Electrophoresis-Mass Spectrometry of Near 1 MDa Non-Covalent GroEL/GroES/Substrate Protein Complexes

Anne-Lise Marie et al. Adv Sci (Weinh). 2024 Mar.

Abstract

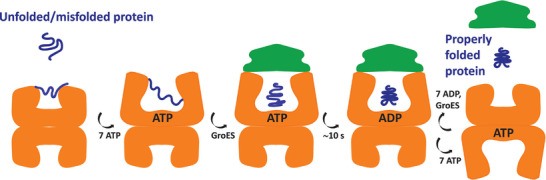
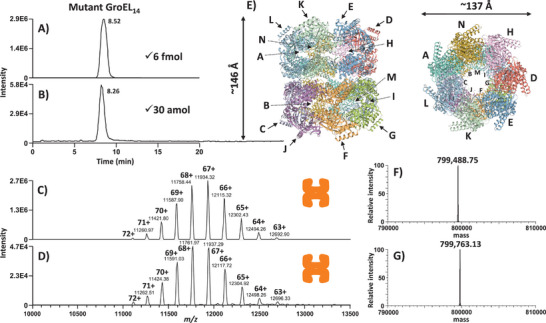
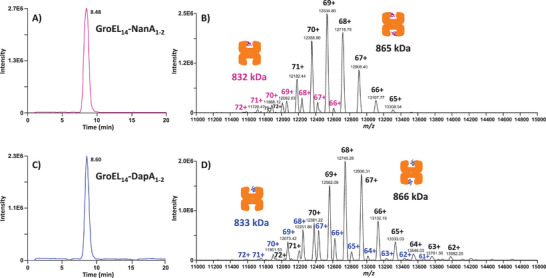
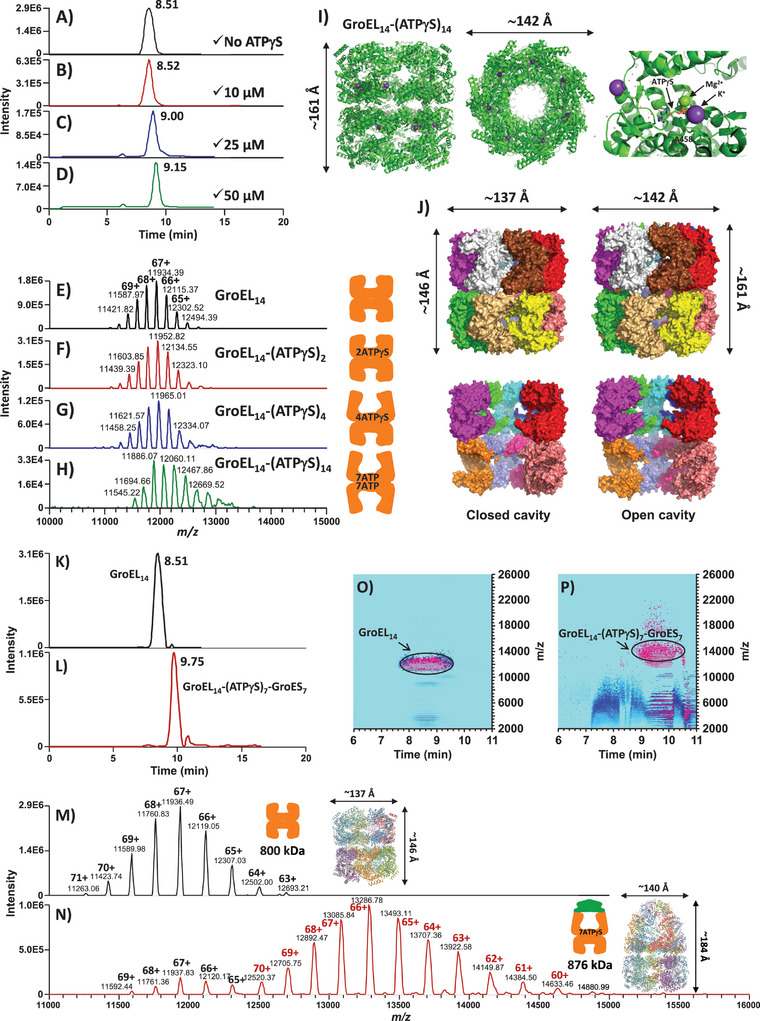
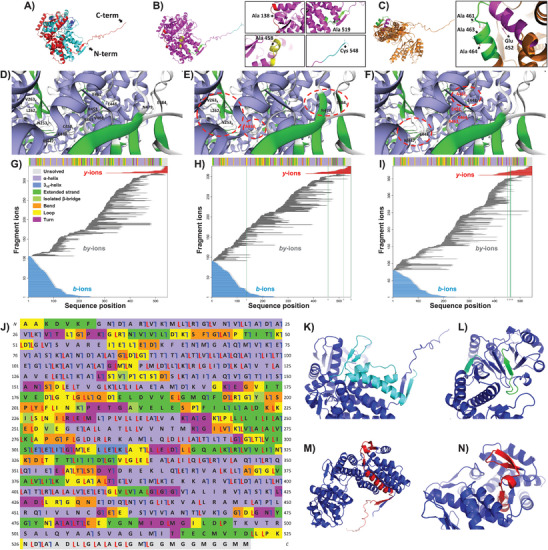
Protein complexes are essential for proteins' folding and biological function. Currently, native analysis of large multimeric protein complexes remains challenging. Structural biology techniques are time-consuming and often cannot monitor the proteins' dynamics in solution. Here, a capillary electrophoresis-mass spectrometry (CE-MS) method is reported to characterize, under near-physiological conditions, the conformational rearrangements of ∽1 MDa GroEL upon complexation with binding partners involved in a protein folding cycle. The developed CE-MS method is fast (30 min per run), highly sensitive (low-amol level), and requires ∽10 000-fold fewer samples compared to biochemical/biophysical techniques. The method successfully separates GroEL14 (∽800 kDa), GroEL7 (∽400 kDa), GroES7 (∽73 kDa), and NanA4 (∽130 kDa) oligomers. The non-covalent binding of natural substrate proteins with GroEL14 can be detected and quantified. The technique allows monitoring of GroEL14 conformational changes upon complexation with (ATPγS)4-14 and GroES7 (∽876 kDa). Native CE-pseudo-MS3 analyses of wild-type (WT) GroEL and two GroEL mutants result in up to 60% sequence coverage and highlight subtle structural differences between WT and mutated GroEL. The presented results demonstrate the superior CE-MS performance for multimeric complexes' characterization versus direct infusion ESI-MS. This study shows the CE-MS potential to provide information on binding stoichiometry and kinetics for various protein complexes.

Keywords: ATP-induced conformational rearrangement; GroEL; GroES; chaperones; native capillary electrophoresis-mass spectrometry.


Conflict of interest statement

The authors declare no conflict of interest.

Figures

Figure 1
Figure 1
Schematic representation of GroEL‐assisted protein folding cycle. The functional protein folding cycle involves the cooperative binding of ATP and GroES to GroEL. One unfolded or partially folded substrate protein is encapsulated for ≈10 s in the nano‐cage formed by the chaperonin GroEL–GroES assembly for folding or refolding to occur in isolation.
Figure 2
Figure 2
Native CE–MS analysis of 1 MDa multimeric protein assemblies. Base peak electropherograms (BPEs) were recorded in the CE–MS analysis of A) 6 fmol and B) 30 amol of 14‐mer mutant GroEL. The mass spectra presented in panels (C) and (D) were integrated across the BPE peaks shown in (A) and (B), respectively. F, G) Deconvolution of the CE–MS signal acquired during the migration time range of GroEL14 (i.e., between 8 and 9 min) using injected quantities equivalent to 6 fmol and 30 amol, respectively. The 3D higher‐order structure of the 14‐mer mutant GroEL is presented in panel E (side and top views are shown on the left‐ and right‐hand corners, respectively). The 14 subunit chains of the tetradecamer are labeled with letters A–N. (See Experimental Section for more details about the computational modeling of the GroEL14 3D structure).
Figure 3
Figure 3
Separation performance of the developed CE–MS method. A–C) CE–MS analysis of GroEL14 and GroEL7 mutants under native conditions. A) BPE profile obtained from the co‐injection of 6 fmol of GroEL14 and 24 fmol of GroEL7. Two peaks are partially separated. The mass spectra integrated across the first and later migrating species are depicted in panels B) and C), respectively. Based on the detected charge state distributions, the first peak corresponds to the double‐ring GroEL14 and the second one to the single‐ring GroEL7. The 3D structures presented in panels B and C correspond to the computationally predicted higher‐order structures of the DR and SR mutant GroEL, where the N‐ and C‐termini of the monomeric subunits are colored in dark blue and red, respectively. D–F) CE–MS analysis of GroEL14 and NanA4 under native conditions. D) BPE profile obtained from the co‐injection of 6 fmol of GroEL14 and 2.5 fmol of NanA4. The integrated mass spectra of the first and later migrating species are depicted in panels E) and F), respectively. Based on the detected charge state distributions, the first peak corresponds to GroEL14 and the second one to the tetrameric NanA4 enzyme. G–I) CE–MS analysis of GroEL14 and GroES7 under native conditions. G) BPE recorded in the CE–MS analysis of equimolar quantities of GroEL14 and GroES7 (3 fmol of each chaperonin were co‐injected). H) Mass spectrum integrated across the first separated peak showing the characteristic charge state distribution of GroEL14. I) Mass spectrum of the later migrating species. The predominant charge state distribution centered around the 17+ ion corresponds to GroES7. Small amounts of GroES6 and GroES5 derived from ESI‐ and/or in‐source‐induced fragmentation are also observed. (See Experimental Section for the computational modeling of the protein 3D structures presented in panels B, C, E, F, H, and I).
Figure 4
Figure 4
Native CE–MS analysis of SP‐bound GroEL14 complexes. BPEs recorded in the CE–MS analysis of A) GroEL14‐NanA and C) GroEL14‐DapA complexes. In each experiment, 6 fmol of GroEL14 were injected with an equimolar ratio (or a slight excess) of SP monomers (the SPs were denatured with GuHCl before their incubation with GroEL14, as described in the Experimental Section). B and D) Mass spectra integrated across the main peaks detected in the respective BPEs. The two charge state distributions observed in the mass spectrum of GroEL14 in complexation with NanA (B) indicate the binding of one and two NanA monomers to the 14‐mer GroEL chaperonin, respectively. The same binding stoichiometries were measured for DapA, as determined with the two different charge state distributions detected in the mass spectrum of the GroEL14‐DapA sample (D). Apo‐GroEL14 was not detected in these experiments.
Figure 5
Figure 5
Native CE–MS analysis of GroEL14–(ATPγS)n and GroEL14–(ATPγS)7–GroES7 complexes. Panels A–H) Co‐injection of GroEL14 and ATPγS (6 µm and 1 mm, respectively) in a capillary filled with 50 mm ammonium acetate BGE containing increased concentrations of ATPγS (from 0 to 50 µm). A–D) Recorded BPEs in the selected CE–MS conditions. E–H) Mass spectra integrated across the BPE peaks shown in panels A–D, respectively. Panel I) Computationally predicted 3D structure of the mutant GroEL14–(ATPγS)14 complex (side and top views are presented on the left and middle of the panel, respectively), where each subunit is bound to one ATPγS molecule. One nucleotide‐binding site is shown in the zoomed‐in region presented on the right. ATPγS is coordinated with Mg2+ and K+ cations, which are represented as green and purple balls, respectively. The mutated Ala 458, circled in dotted lines, can be in the vicinity of the nucleotide. Panel J) Surface representations of the 3D structures of unliganded mutant GroEL14 (left column) and mutant GroEL14–(ATPγS)14 (right column) complexes. The structural rearrangement of the central cages is clearly seen with the 3D structures where two and three front subunits were removed from the top and bottom rings, respectively, in the apo‐GroEL14 and GroEL14–(ATPγS)14 complexes (bottom row of the panel). Panels K, L) BPEs recorded following the injection of K) apo‐GroEL14 (6 µm) and L) GroEL14 and GroES7 (equimolar ratio of 6 µm) incubated with ATPγS (1 mm) and BeF3 (1 mm). The mass spectra integrated across the respective BPE peaks show the characteristic charge state distributions of apo‐GroEL14 (M) and GroEL14–(ATPγS)7–(BeF3)7–GroES7 (N) complexes. Panels O, P) Ion density maps of the CE–MS analyses of O) apo‐GroEL14 and P) GroEL14–(ATPγS)7–(BeF3)7–GroES7 complexes. The estimated sizes of the detected complexes are indicated in the panels M, N, based on the computationally predicted 3D structures of both complexes.
Figure 6
Figure 6
3D structures and native CE‐pseudo‐MS3 analyses of WT GroEL and in vitro cloned GroEL mutants. 3D structures of the monomeric subunits of double‐ring (DR) WT GroEL (A), DR mutant GroEL (B), and single‐ring (SR) mutant GroEL (C), based on the AlphaFold predicted structure of the WT GroEL monomer (see Experimental Section). In panel A, the sequence regions that were fragmented in the N‐ and C‐termini of the WT, resulting in the detection and assignment of b‐ and y‐type terminal fragment ions, as described in Panel G, are colored in cyan and red, respectively. The inserts in panels B and C depict the position of the mutated amino acids in the structural motifs of the DR and SR mutant GroEL, respectively (regions colored in red, yellow, green, and cyan in insert B, and in green and magenta in panel C correspond to sequence regions where the mutations were introduced). For the mutant DR, one mutation (M548C) was introduced at the end of the C‐terminus that corresponds to a loose loop based on the AlphaFold predicted structure of WT GroEL. For the mutant SR, the four amino acids that were mutated (R452E, E461A, S463A, V464A) are in the same vicinity in the C‐terminus of the sequence. D–F) Selected regions of the computationally predicted 3D structures of DR WT (D), DR mutant (E), and SR mutant (F) GroEL to illustrate locus‐dependent structural differences between the WT and its two mutated counterparts. Letters J, K, and L correspond to the subunit chain name of the oligomeric assemblies. The red dotted lines circle protein regions with altered structural motifs for the DR and SR GroEL compared to the WT, as predicted with the computational modeling of the WT and mutant 3D structures. The amino acids highlighted in red correspond to mutated amino acids. See the Experimental Section for the design of the computationally predicted higher‐order 3D structures of the monomeric subunits and oligomeric assemblies of the three analyzed GroEL species. G–I) Plots of the fragment ions detected and identified in native CE‐pseudo‐MS3 analyses of DR WT (G), DR mutant (H), and SR mutant (I) GroEL, applying HCD collisional energy. b‐ and y‐type terminal fragment ions are plotted as cyan and red lines, respectively, and by‐type internal fragment ions are plotted as gray lines. The y‐axis indicates the number of each type of fragment ions that were assigned for each GroEL species. The vertical green lines delineate the position of the mutated amino acids in the sequence of the DR (H) and SR (I) mutant GroEL. The color‐coded bars at the top of the fragmentation maps are motif‐scale bars that fit the amino acids to their corresponding structural motif in the WT and the mutated GroEL variants (light grey, unresolved region; light blue, α‐helix; skyblue, 310‐helix; green, extended strand participating in β‐ladder; lime, one residue in isolated β‐bridge; orange, bend; yellow, loop; purple, hydrogen‐bonded turn; see Experimental Section and Figure S17, Supporting Information). J) Color‐coded fragmentation map showing the regions of the WT GroEL sequence covered by terminal and internal fragmentations (blue bars correspond to b‐type cleavages yielding b‐ or by‐type ions, and red bars correspond to y‐type cleavages yielding y‐ or by‐type ions) and their corresponding structural motifs (the color codes are identical to those described in panels (G–I). K–N) Computationally predicted AlphaFold structures of the WT GroEL monomers. The region highlighted in cyan in panel K corresponds to the N‐terminal sequence region from AA 2 to 73. The regions highlighted in greencyan and green in panel L correspond to the 186–191 and 208–217 AA sequence regions, respectively. The region highlighted in red in panel M corresponds to the C‐terminal sequence region from AA 477 to 548 (panel N is a top view of panel M showing the three β‐strands located in the 477–496 AA sequence region).

Similar articles

Cited by

References

    1. Tang Y.‐C., Chang H.‐C., Roeben A., Wischnewski D., Wischnewski N., Kerner M. J., Hartl F. U., Hayer‐Hartl M., Cell 2006, 125, 903. - PubMed
    1. Clare D. K., Saibil H. R., Biopolymers 2013, 99, 846. - PMC - PubMed
    1. Genest O., Wickner S., Doyle S. M., J. Biol. Chem. 2019, 294, 2109. - PMC - PubMed
    1. Taguchi H., J. Biochem. 2005, 137, 543. - PubMed
    1. Georgescauld F., Popova K., Gupta A. J., Bracher A., Engen J. R., Hayer‐Hartl M., Hartl F. U., Cell 2014, 157, 922. - PMC - PubMed

LinkOut - more resources