. 2024 Mar;11(11):e2305592.
doi: 10.1002/advs.202305592. Epub 2024 Jan 8.

Single-Cell Sequencing Reveals Functional Alterations in Tuberculosis

Affiliations

Single-Cell Sequencing Reveals Functional Alterations in Tuberculosis

Mengyuan Lyu et al. Adv Sci (Weinh). 2024 Mar.

Abstract

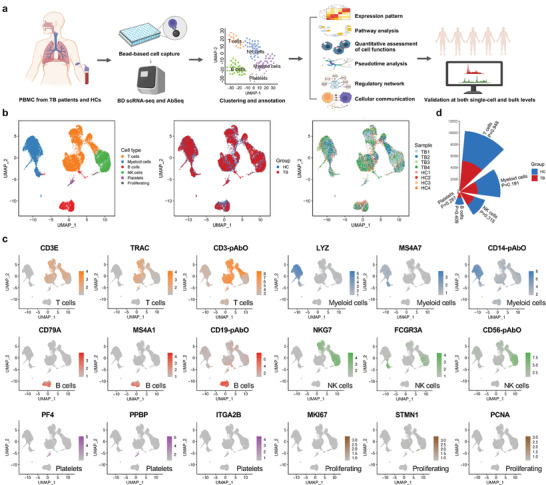
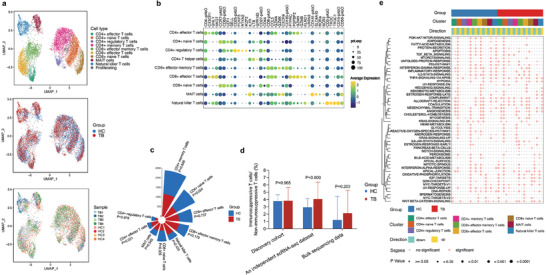
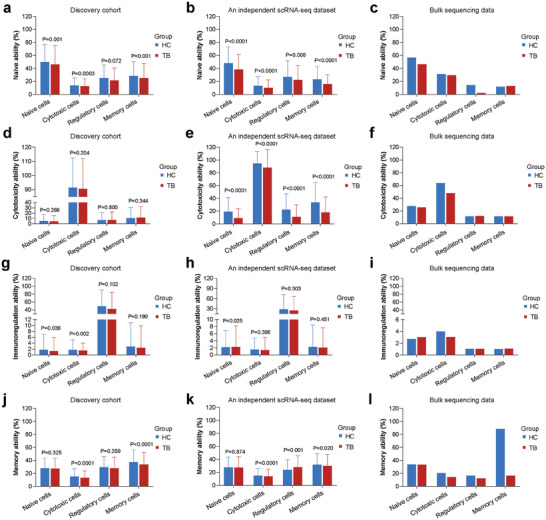
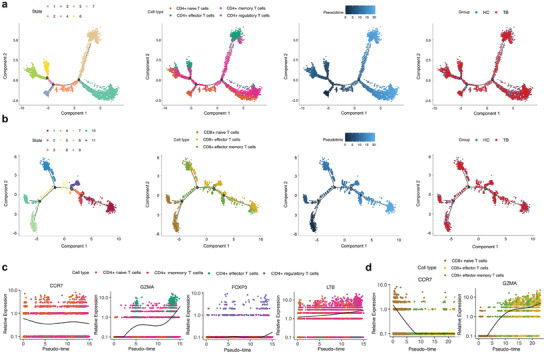
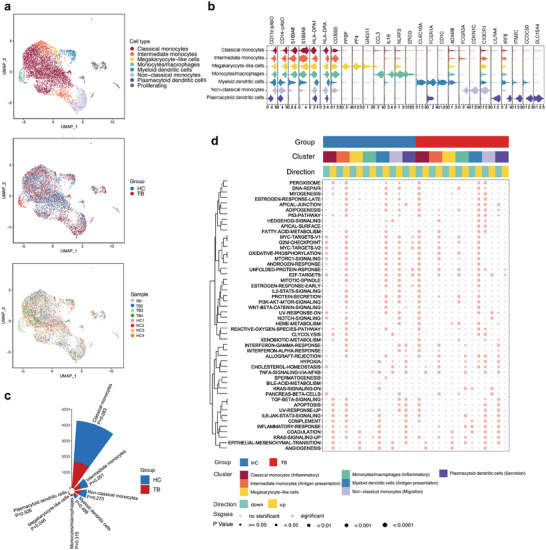
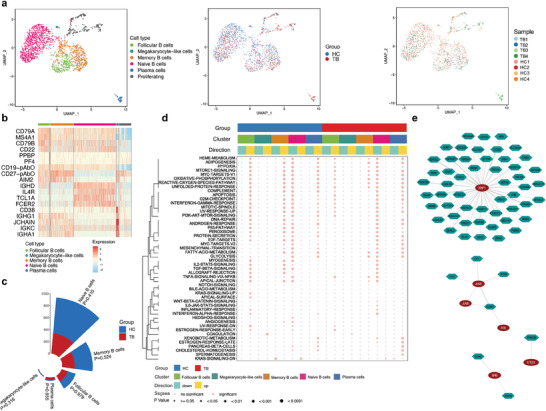
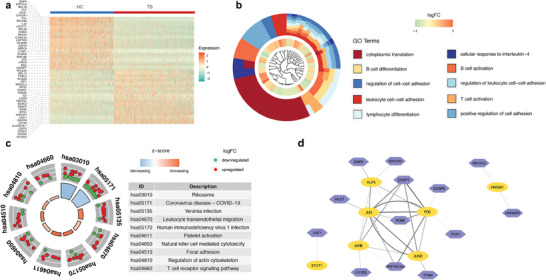
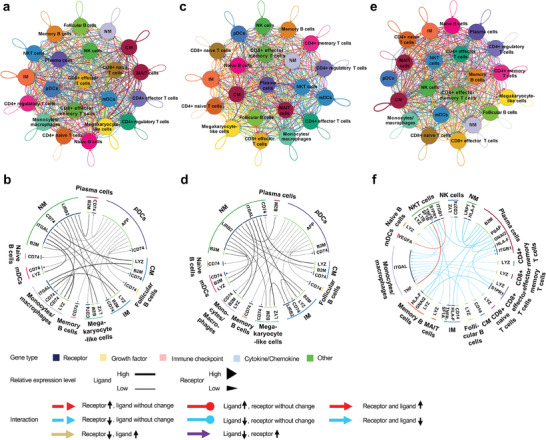
Despite its importance, the functional heterogeneity surrounding the dynamics of interactions between mycobacterium tuberculosis and human immune cells in determining host immune strength and tuberculosis (TB) outcomes, remains far from understood. This work now describes the development of a new technological platform to elucidate the immune function differences in individuals with TB, integrating single-cell RNA sequencing and cell surface antibody sequencing to provide both genomic and phenotypic information from the same samples. Single-cell analysis of 23 990 peripheral blood mononuclear cells from a new cohort of primary TB patients and healthy controls enables to not only show four distinct immune phenotypes (TB, myeloid, and natural killer (NK) cells), but also determine the dynamic changes in cell population abundance, gene expression, developmental trajectory, transcriptomic regulation, and cell-cell signaling. In doing so, TB-related changes in immune cell functions demonstrate that the immune response is mediated through host T cells, myeloid cells, and NK cells, with TB patients showing decreased naive, cytotoxicity, and memory functions of T cells, rather than their immunoregulatory function. The platform also has the potential to identify new targets for immunotherapeutic treatment strategies to restore T cells from dysfunctional or exhausted states.

Keywords: functional variation; heterogeneity; immunosuppression; single-cell sequencing; tuberculosis.


Conflict of interest statement

The authors declare no conflict of interest.

Figures

Figure 1
Figure 1
Single‐cell profiling of eight PBMC samples from four primary TB patients and four HCs based on scRNA‐seq and AbSeq. a) Experimental and analytic flow. b) UAMP plots of 23 990 individual cells from eight participants colored by cell type, group, and sample, respectively. c) Feature plots showing the expression level of marker genes for six PBMC subsets. The gray color indicated the genes were not expressed or were expressed at a relatively low level in the corresponding cells. Molecules with names ending with pAbO represent cell surface proteins. d) Nightingale rose plot showing the number of five PBMC subsets colored by the group. The height of each bar graph represented the mean number of each cell subtype across the four samples in the HC or TB group. p values are computed from a two‐sided Student's t‐test. Abbreviations: PBMC, peripheral blood mononuclear cell; TB, tuberculosis; HC, healthy control; scRNA‐seq, single‐cell RNA sequencing; AbSeq, antibody sequencing.
Figure 2
Figure 2
Cluster and cell subtype analysis of T cells. a) UMAP plots of 10 371 T cells colored by cell type, group, and sample (top to bottom). b) Dot plot for expression of marker genes for nine T cell subtypes. Molecules with names ending with pAbO represent cell surface proteins. Red boxes represented hallmark genes for each T cell subtype. c) Nightingale rose plot showing a number of nine T cell subtypes colored by the group. P values are computed from a two‐sided Student's t‐test. d) Histogram showing the ratio of immunosuppressive T cells (CD4+ regulatory T cells) and non‐immunosuppressive T cells (CD4+ naive T cells, CD8+ naive T cells, CD4+ memory T cells, CD4+ effector cells, CD8+ effector T cells, CD8+ effector memory T cells, MAIT cells, and NKT cells) in the TB and HC group. P values are computed from a two‐sided Student's t‐test. e) Differences in ssGSEA score of hallmark top 50 gene sets in T cell subtypes between TB and HC group. The color and size of the dots together indicate enrichment significance. p values are computed from the Wilcox test. Abbreviations: MAIT, mucosal‐associated invariant T; HC, healthy control; TB, tuberculosis; ssGSEA, single‐cell rank‐based gene set enrichment analysis.
Figure 3
Figure 3
Differences in functional abilities of four T cell subsets between TB and HC groups based on the discovery cohort (a, d, g, j), an independent scRNA‐seq dataset (b, e, h, k) and bulk data (c, f, j, l), in columns. Nine T cell subtypes were clustered into four categories according to their function. Naive cells included CD4+ naive T cells and CD8+ naive T cells. Cytotoxic cells included CD8+ effector T cells, CD8+ effector memory T cells, CD4+ effector T cells, MAIT cells, and NKT cells. Regulatory cells are referred to as CD4+ regulatory T cells and memory cells are referred to as CD4+ memory T cells. (in rows) Differences in naive a–c), cytotoxicity d–f), immunoregulation g–i), and memory j–l) functional ability of four T cell subsets between TB and HC groups. p values are computed from a two‐sided Student's t‐test. It should be noted that the deconvolution results in the bulk data did not support the calculation of p values.
Figure 4
Figure 4
Developmental trajectories of CD4+ and CD8+ T cell subtypes and the expression pattern of representative genes. (a, b). Pseudotime analysis of CD4+ and CD8+ T cell subtypes colored by state, cell subtypes, pseudotime, and group, respectively. c, d). Expression pattern of representative genes (CCR7, GZMA, FOXP3, and LTB) in CD4+ T cells (c) and (CCR7 and GZMA) in CD8+ T cells (d) along pseudotime development. Abbreviations: HC, healthy control; TB, tuberculosis.
Figure 5
Figure 5
Cluster and cell subtype analysis of myeloid cells. a) UMAP plots of 6855 myeloid cells colored by cell type, group, and sample. b) Violin plots showing expression level for marker genes of seven myeloid cell subtypes. Molecules with names ending with pAbO represent cell surface proteins. c) Nightingale rose plot showing a number of seven myeloid cell subtypes colored by the group. p values are computed from a two‐sided Student's t‐test. d) Differences in ssGSEA score of hallmark top 50 gene sets in myeloid cell subtypes between the TB and HC groups. The color and size of the dots together indicate enrichment significance. p values are computed from the Wilcox test.
Figure 6
Figure 6
Cluster and cell subtype analysis of B cells. a) UMAP plots of 2035 B cells colored by cell type, group, and sample. b) Heatmap showing expression of marker genes of five B cell subtypes. Molecules with names ending with pAbO represented cell surface proteins. The red color denotes high expression, while the blue color denotes low expression. c) Nightingale rose plot showing a number of five B cell subtypes colored by the group. p values are computed from a two‐sided Student's t‐test. d) Differences in ssGSEA score of hallmark top 50 gene sets in B cell subtypes between TB and HC group. The color and size of the dots together indicate enrichment significance. p values are computed from the Wilcox test. e) Regulatory network of B cells, showing the pairs of regulatory factors (red circles) and genes (gene polygons) with a correlation>0.2 and high confidence. Abbreviations: HC, healthy control; TB, tuberculosis; ssGSEA, single‐cell rank‐based gene set enrichment analysis.
Figure 7
Figure 7
The transcription atlas of NK cells. a) Heatmap showing the most upregulated 25 genes and downregulated 25 genes of NK cells in TB and HC groups. b) GO cluster plot (top ten terms). The inner dendrogram represents the clustering according to the gene expression profiling. The middle circle represents the value of logFC, while the outer circle represents the enriched GO BP terms. c) GOCircle plot showing the result of KEGG analysis. Dots in the outer circle indicate genes related to the corresponding pathways. The colors of the inner circle indicate the z‐score. d) Regulatory network of NK cells, showing the pairs of regulatory factors (yellow circles) and genes (purple polygons) with a correlation>0.1 and high confidence. Abbreviations: NK, natural killer; HC, healthy control; TB, tuberculosis; GO, Gene Ontology; logFC, log2 fold change; BP, biological processes.
Figure 8
Figure 8
The network and circos plots of cellular communication. The network plots show the number of ligand–receptor pairs between two cell subtypes. In circos plots (top 25 pairs‐b, d, f), the outside ring represents cell subtypes, while the inside ring represents ligands or receptors. a, b) HC group; c, d) TB group; e, f) Differences between TB and HC groups. Abbreviations: CM, classical monocytes; IM, intermediate monocytes; NM, nonclassical monocytes; NK, natural killer; NKT, natural killer T; MAIT, mucosal‐associated invariant T.

Similar articles

Cited by

References

    1. Ligon L. S., Hayden J. D., Braunstein M., Tuberculosis 2012, 92, 121. - PMC - PubMed
    1. Weiss G., Schaible U. E., Immunolog. Rev. 2015, 264, 182. - PMC - PubMed
    1. Zhai W., Wu F., Zhang Y., Fu Y., Liu Z., Int. J. Mol. Sci. 2019, 20, 340. - PMC - PubMed
    1. Bahuguna A., Rawat S., Rawat D. S., Med. Res. Rev. 2021, 41, 2565. - PubMed
    1. Cadena A. M., Fortune S. M., Flynn J. L., Nat. Rev. Immunol. 2017, 17, 691. - PMC - PubMed

LinkOut - more resources