. 2023 Dec 18:14:1287350.
doi: 10.3389/fmicb.2023.1287350. eCollection 2023.

Gut microbiota functional profiling in autism spectrum disorders: bacterial VOCs and related metabolic pathways acting as disease biomarkers and predictors

Affiliations

Gut microbiota functional profiling in autism spectrum disorders: bacterial VOCs and related metabolic pathways acting as disease biomarkers and predictors

Pamela Vernocchi et al. Front Microbiol. .

Abstract

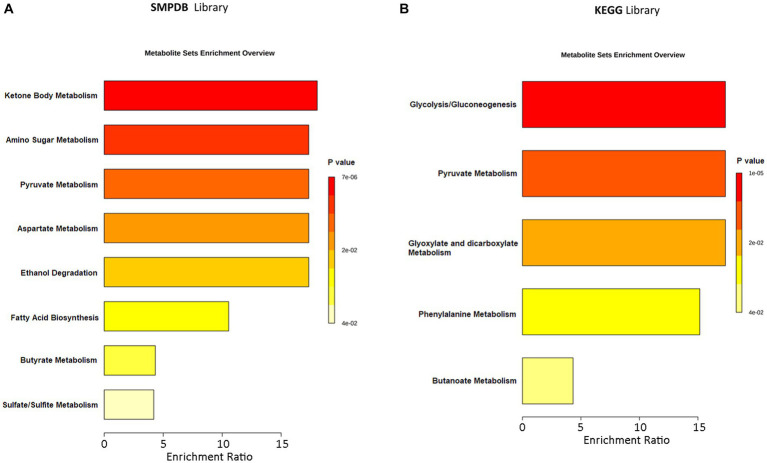
Background: Autism spectrum disorder (ASD) is a multifactorial neurodevelopmental disorder. Major interplays between the gastrointestinal (GI) tract and the central nervous system (CNS) seem to be driven by gut microbiota (GM). Herein, we provide a GM functional characterization, based on GM metabolomics, mapping of bacterial biochemical pathways, and anamnestic, clinical, and nutritional patient metadata.

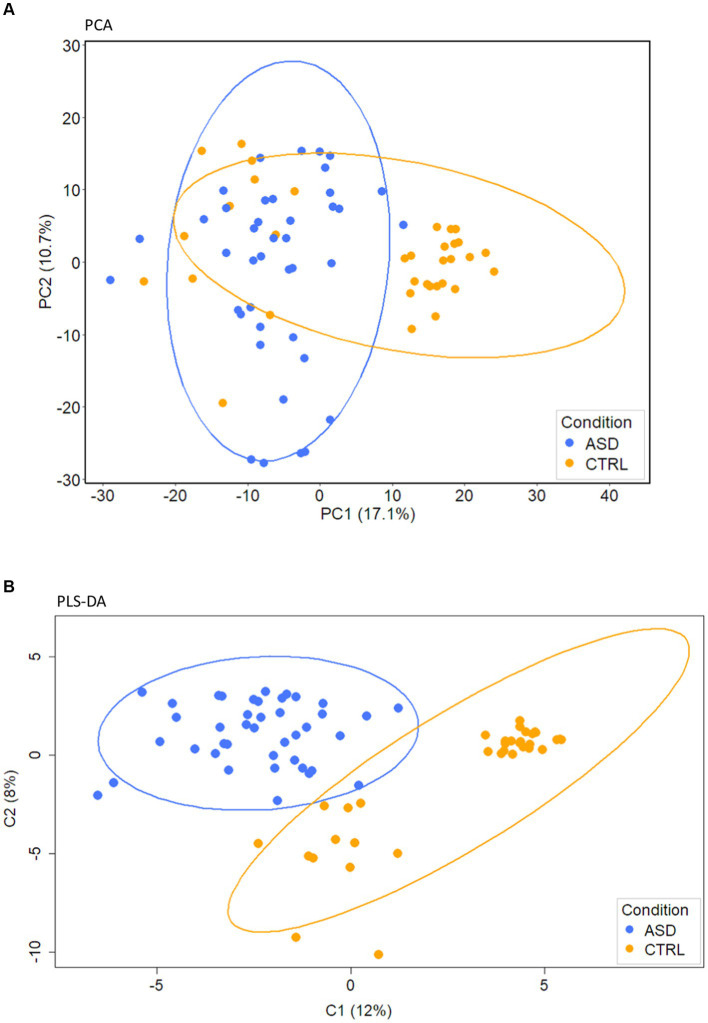
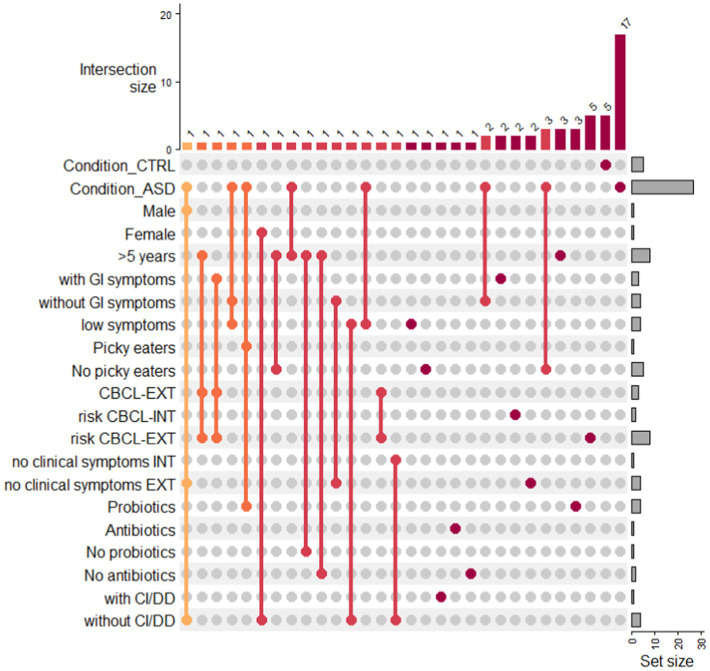
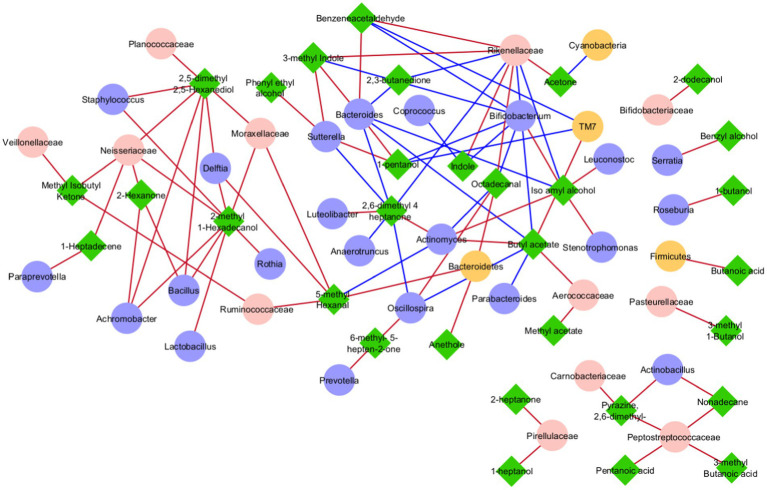
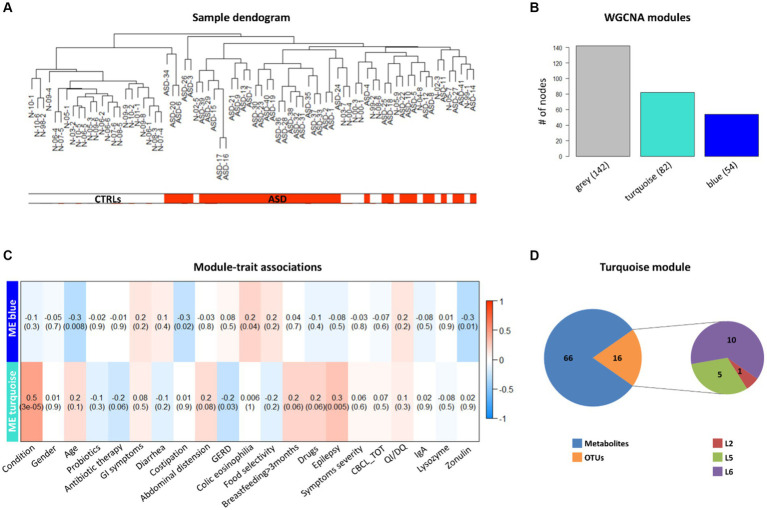
Methods: Fecal samples collected from children with ASD and neurotypical children were analyzed by gas-chromatography mass spectrometry coupled with solid phase microextraction (GC-MS/SPME) to determine volatile organic compounds (VOCs) associated with the metataxonomic approach by 16S rRNA gene sequencing. Multivariate and univariate statistical analyses assessed differential VOC profiles and relationships with ASD anamnestic and clinical features for biomarker discovery. Multiple web-based and machine learning (ML) models identified metabolic predictors of disease and network analyses correlated GM ecological and metabolic patterns.

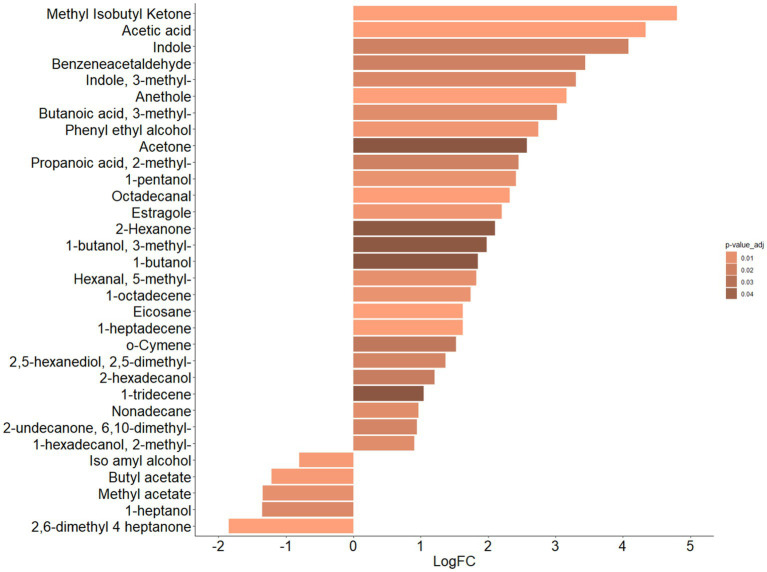
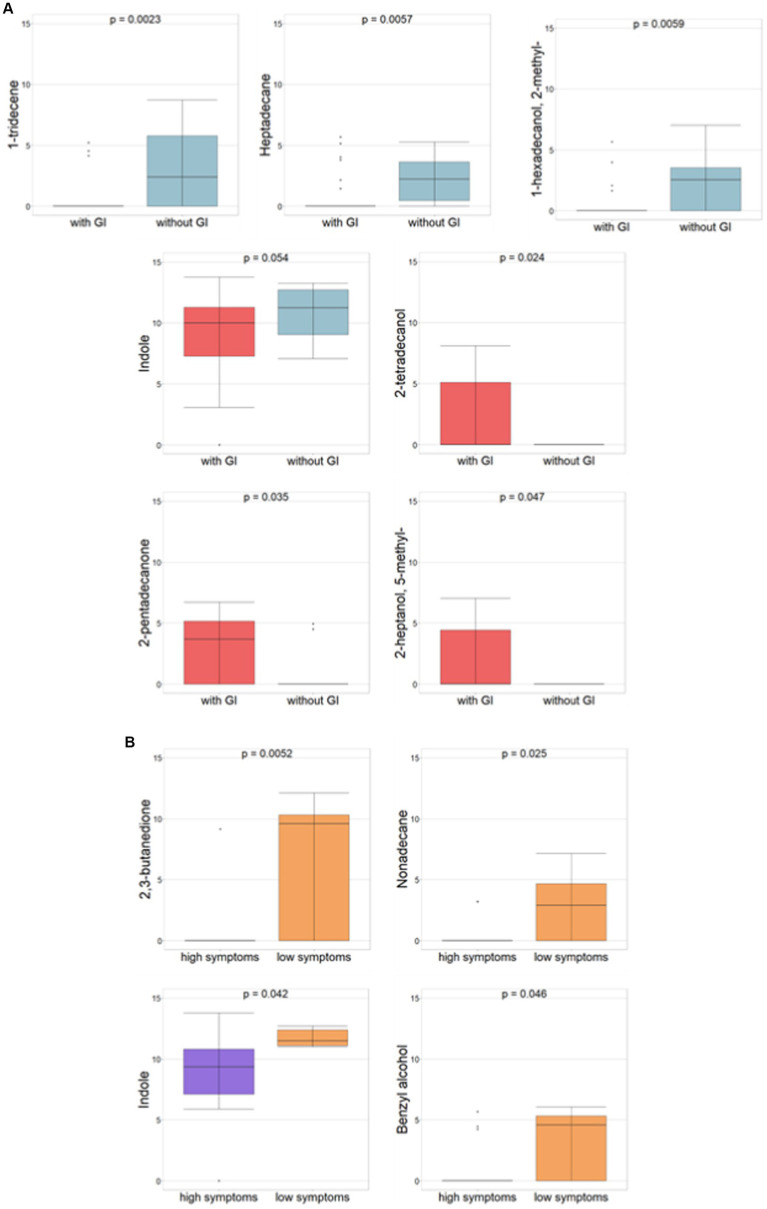
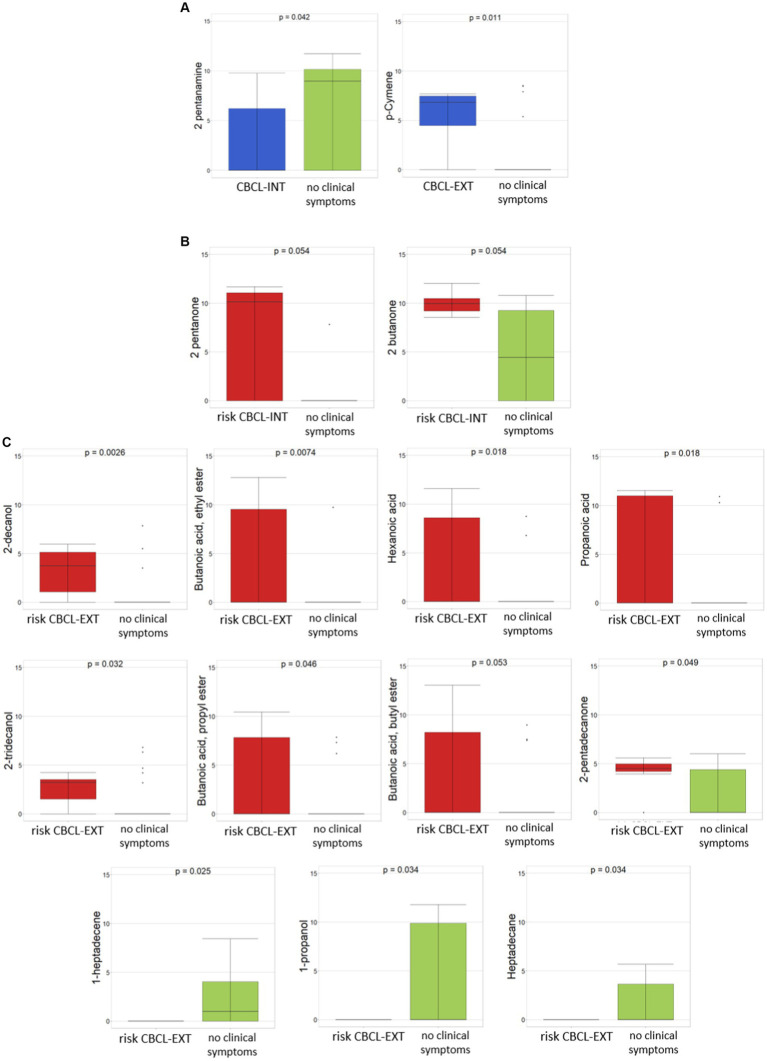
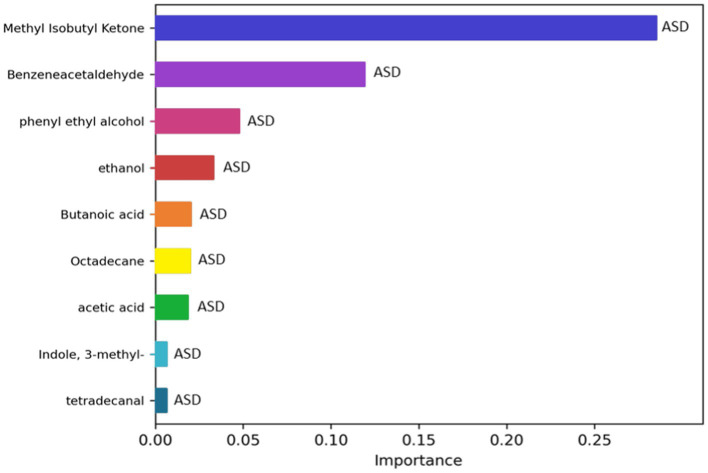
Results: The GM core volatilome for all ASD patients was characterized by a high concentration of 1-pentanol, 1-butanol, phenyl ethyl alcohol; benzeneacetaldehyde, octadecanal, tetradecanal; methyl isobutyl ketone, 2-hexanone, acetone; acetic, propanoic, 3-methyl-butanoic and 2-methyl-propanoic acids; indole and skatole; and o-cymene. Patients were stratified based on age, GI symptoms, and ASD severity symptoms. Disease risk prediction allowed us to associate butanoic acid with subjects older than 5 years, indole with the absence of GI symptoms and low disease severity, propanoic acid with the ASD risk group, and p-cymene with ASD symptoms, all based on the predictive CBCL-EXT scale. The HistGradientBoostingClassifier model classified ASD patients vs. CTRLs by an accuracy of 89%, based on methyl isobutyl ketone, benzeneacetaldehyde, phenyl ethyl alcohol, ethanol, butanoic acid, octadecane, acetic acid, skatole, and tetradecanal features. LogisticRegression models corroborated methyl isobutyl ketone, benzeneacetaldehyde, phenyl ethyl alcohol, skatole, and acetic acid as ASD predictors.

Conclusion: Our results will aid the development of advanced clinical decision support systems (CDSSs), assisted by ML models, for advanced ASD-personalized medicine, based on omics data integrated into electronic health/medical records. Furthermore, new ASD screening strategies based on GM-related predictors could be used to improve ASD risk assessment by uncovering novel ASD onset and risk predictors.

Keywords: SCFAs; autism; clinical decision support system (CDSS) algorithms; gut microbiota volatilome; machine learning; tryptophan-derived metabolism.


Conflict of interest statement

The authors declare that the research was conducted in the absence of any commercial or financial relationships that could be construed as a potential conflict of interest.

Figures

Figure 1
Figure 1
PCA and PLS-DA analyses of gut volatilome. (A) PCA. (B) PLS-DA score plot of VOCs detected in fecal samples collected from ASD patients and CTRLs.
Figure 2
Figure 2
Bar plot of differential abundance of VOCs represented by Log2 of Fold Change (FC) for ASDs e CTRLs datasets. Bar plot represents the LogFC scores of differential abundance of VOCs (p-value adjusted ≤0.05, Mann–Whitney test). Color scale represents values of adjusted p value.
Figure 3
Figure 3
Differential abundances of VOCs (p-value ≤ 0.05, Mann–Whitney test) for ASDs subgrouped for GI and severity symptoms, respectively. (A) ASD with vs. ASD without GI symptoms. Red histograms refer to ASDs with GI; light blue histograms refer to ASD without GI. (B) ASDs with high autism vs. low severity symptoms. Violet histograms refer to high ASD symptoms; orange histograms refer to low ASD symptoms.
Figure 4
Figure 4
Differential abundances of VOCs between ASDs with clinical symptoms and ASD with risk of clinical symptoms, reported as CBCL-based score, vs ASD with no clinical symptoms. (A) CBCL-INT and CBCL-EXT, both related to ASDs with presence of clinical symptoms vs ASDs with no clinical symptoms. (B) CBCL-INT risk subgroup vs ASDs with no clinical symptoms. (C) CBCL-EXT risk subgroup vs ASDs with no clinical symptoms. Colors: (A) Blue, CBCL-INT and CBCL-EXT including ASDs with clinical symptoms; green, ASDs with no clinical symptoms; (B) and (C) red, CBCL-INT and CBCL-EXT including with ASDs with risk of clinical symptoms; green, ASDs with no clinical symptoms. p ≤ 0.05 based on Mann–Whitney test.
Figure 5
Figure 5
Upset plot of VOCs distribution in ASD subgroups and condition CTRL. Upset plot shows the distribution of statistically significant VOCs in the ASD subgroups and CTRL condition. The red/orange bar charts at the top represent the intersection size in the subgroups, while the grey bar charts represent the number of VOCs included in each ASD subgroup or in the CTRL condition. Legend: with CI/DD: presence of cognitive impairment/developmental delay; without CI/DD: absence of cognitive impairment/developmental delay.
Figure 6
Figure 6
Metabolic Set Enrichment Analysis (MSEA) showing the most altered metabolic pathways in ASDs. (A) MSEA obtained by interrogation of SMPDB database. (B) MSEA obtained by interrogation of KEGG database. The length of each bar is dependent on the fold enrichment; the color intensity (from yellow to red) is proportional to statistical significance.
Figure 7
Figure 7
Correlation network analysis between OTUs and VOCs. In each network, nodes represent the OTUs (circles) and the VOCs (triangles), and an edge between two nodes occurs if they exhibit a statistically significant correlation (p ≤ 0.05). The color of the network edges indicates positive (red) and negative (blue) correlations.
Figure 8
Figure 8
Weighted correlation network analysis (WGCNA) of OTUs, VOCs, and clinical data of ASD patients and CTRLs. (A) Clustering dendrogram of ASD and CTRL samples. The horizontal bars represent how the ASD and CTRL condition relates to the sample dendrogram: white annotation refers to CTRLs (low distance values) and red to ASD patients (low distance values). (B) WGCNA modules. The bars represent the size (i.e., number of nodes) of each WGCNA-detected module, colored with different module labels (i.e., grey, turquoise, blue). (C) associations between clinical trait or feature and ME, represented by correlation heatmap. In the heat map, each row corresponds to a given ME and each column to a trait or feature of interest. Each cell contains the correlation and (within the round brackets) the associated p value between them. The heatmap’s color-coded by correlation according to the color legend. (D) WGCNA turquoise module composition. Pie charts represent the numbers of 16 OTUs (one phylum, five families and 10 genera) and 66 VOCs falling in the module.
Figure 9
Figure 9
Significant metabolites selected by the classification model HistGradientBoostingClassifier. The bar charts represent the importance scores of each VOC in the ASD prediction models compared to CTRLs.

References

    1. Adams J. B., Hahn J., Kang D. W., Krajmalnik-Brown R. (2022). "Metabolites as diagnostics for autism spectrum disorder in children with gastrointestinal symptoms." U.S. Patent Application No. 17/601,219
    1. Agus A., Planchais J., Sokol H. (2018). Gut microbiota regulation of tryptophan metabolism in health and disease. Cell Host Microbe 23, 716–724. doi: 10.1016/j.chom.2018.05.003 - DOI - PubMed
    1. Bansal T. (2012). Role for the bacterial signal indole in promoting epithelial cell barrier function. JEBP 5, 32–38. doi: 10.2174/1875044301205010032, PMID: - DOI - PubMed
    1. Bansal T., Alaniz R. C., Wood T. K., Jayaraman A. (2010). The bacterial signal indole increases epithelial-cell tight-junction resistance and attenuates indicators of inflammation. Proc. Natl. Acad. Sci. U. S. A. 107, 228–233. doi: 10.1073/pnas.0906112107, PMID: - DOI - PMC - PubMed
    1. Benjamini Y., Hochberg Y. (1995). Controlling the false discovery rate: a practical and powerful approach to multiple testing. J. Royal Stat. Soc. Series B 57, 289–300. doi: 10.1111/j.2517-6161.1995.tb02031.x - DOI