

doi: 10.1016/j.rpth.2023.102247.
eCollection 2023 Nov.
COVID-19. Comparison of D-dimer levels measured with 3 commercial platforms
Affiliations
- PMID: 38193049
- PMCID: PMC10772868
- DOI: 10.1016/j.rpth.2023.102247
Item in Clipboard
COVID-19. Comparison of D-dimer levels measured with 3 commercial platforms
Res Pract Thromb Haemost.
.
No abstract available
Figures
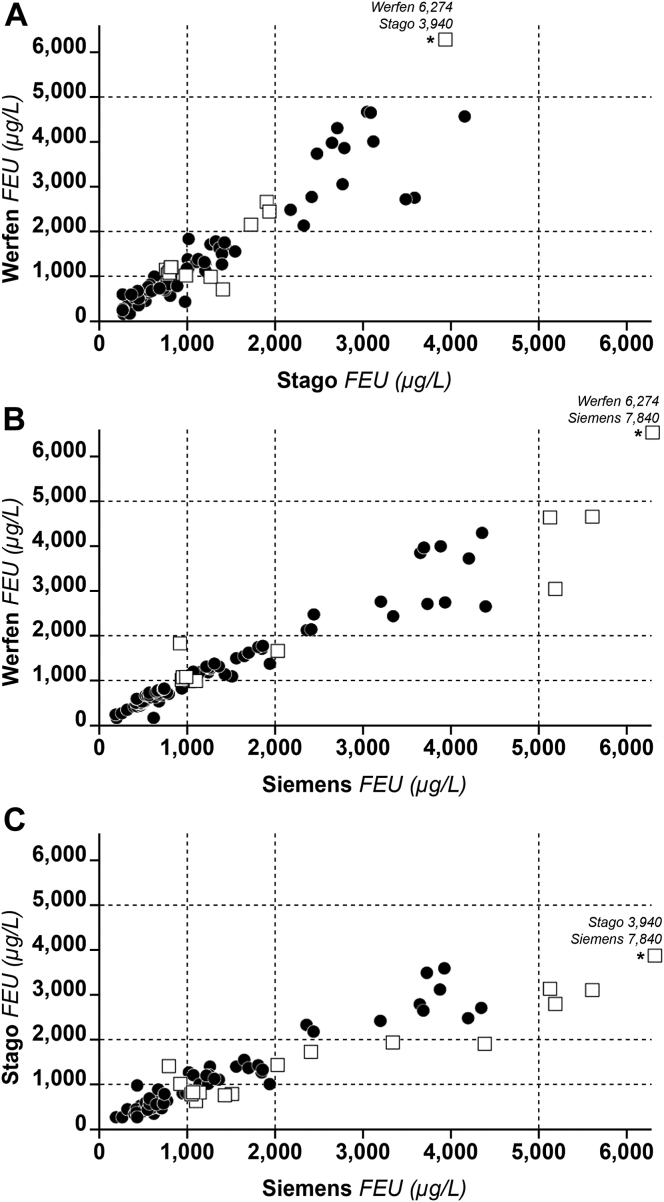
Scatterplots of D-dimer levels (micrograms per liter) obtained from patients COVID-19 using 3 commercial platforms. Open squares identify samples with discrepant results (see text for more details). Asterisks identify values that were higher than the scale of the graph. Dashed horizontal and vertical lines identify the D-dimer categories corresponding to >1000 to <2000 μg/L, >2000 to <5000 μg/L, or >5000 μg/L. To assess for equivalence of platforms, Cohen’s κ coefficient was taken as a measure of agreement. Cohen’s κ statistic was calculated for samples that were independently classified by the 3 platforms in the above a priori–defined D-dimer categories. The interagreement κ statistics showed good agreement (Stago vs Werfen: κ = 0.76; 95% CI, 0.64-0.88; P < .001; Siemens vs Werfen: κ = 0.81; 95% CI, 0.70-0.90; P < .001; Siemens vs Stago: κ = 0.70; 95% CI, 0.56-0.82; P < .001). It is common practice to consider between-method agreement as insufficient when κ statistic is <0.4, discrete when κ is 0.4 to 0.6, good when κ is 0.6 to 0.8, and excellent when κ is 0.8 to 1.0. FEU, fibrinogen equivalent unit.
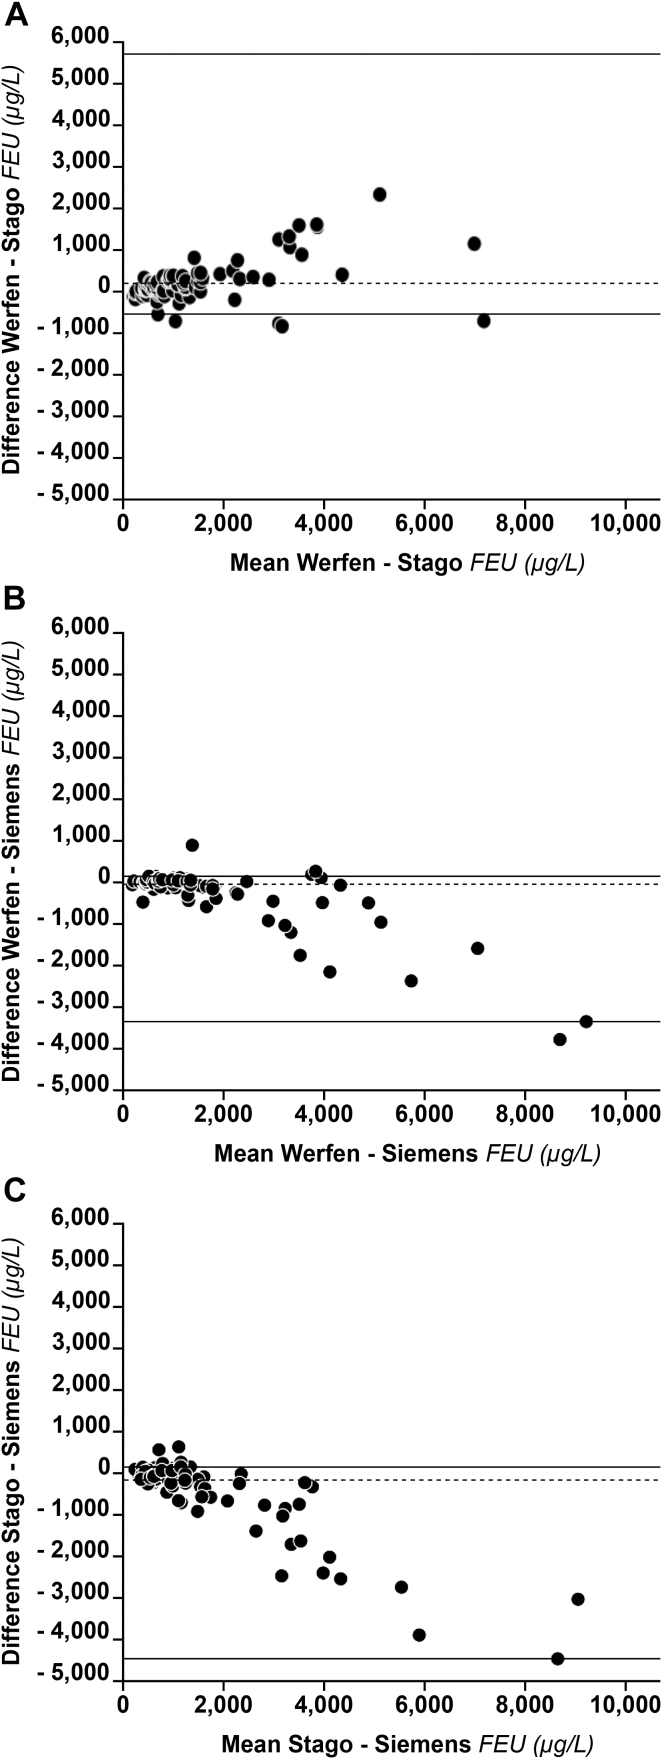
Bland-Altman plots for D-dimer levels measured with 3 commercial platforms in patients with COVID-19. A nonparametric estimation was used because of the observed highly skewed distribution of differences. Since the between-method differences do not always have a normal distribution as required by a standard Bland-Altman plot, we felt that an approach describing such data without any distribution assumption of differences was preferable. Dashed lines represent the median systematic bias. Solid lines represent the limits of agreement defined as the 5th and the 95th percentile from the distribution of differences. FEU, fibrinogen equivalent unit.
References
-
- Linkins L.A., Takach Lapner S. Review of D-dimer testing: good, bad, and ugly. Int J Lab Hematol. 2017;39:98–103. - PubMed
-
- Idell S. Extravascular coagulation and fibrin deposition in acute lung injury. New Horiz. 1994;2:566–574. - PubMed
-
- Perrier A., Desmarais S., Miron M.J., de Moerloose P., Lepage R., Slosman D., et al. Non-invasive diagnosis of venous thromboembolism in outpatients. Lancet. 1999;353:190–195. - PubMed
