. 2023 Nov 14;7(8):102262.
doi: 10.1016/j.rpth.2023.102262. eCollection 2023 Nov.

Breakthrough infections after COVID-19 vaccinations do not elicit platelet hyperactivation and are associated with high platelet-lymphocyte and low platelet-neutrophil aggregates

Affiliations

Breakthrough infections after COVID-19 vaccinations do not elicit platelet hyperactivation and are associated with high platelet-lymphocyte and low platelet-neutrophil aggregates

Francesca Maiorca et al. Res Pract Thromb Haemost. .

Abstract

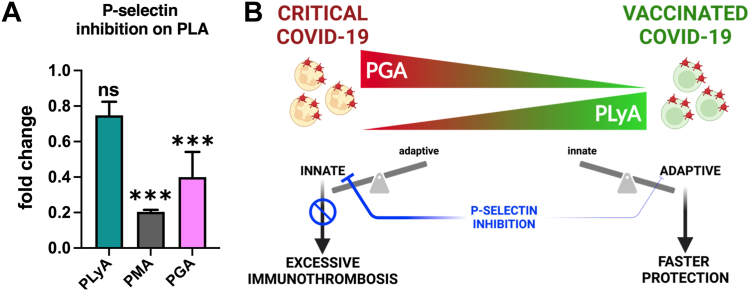
Background: Severe COVID-19 is associated with an excessive immunothrombotic response and thromboinflammatory complications. Vaccinations effectively reduce the risk of severe clinical outcomes in patients with COVID-19, but their impact on platelet activation and immunothrombosis during breakthrough infections is not known.

Objectives: To investigate how preemptive vaccinations modify the platelet-immune crosstalk during COVID-19 infections.

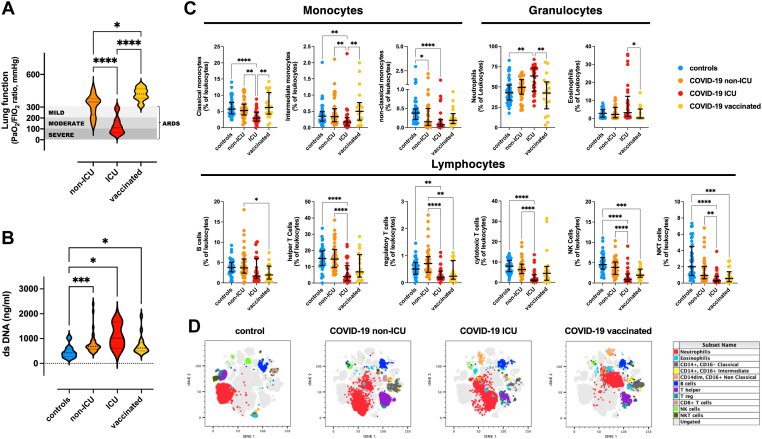
Methods: Cross-sectional flow cytometry study of the phenotype and interactions of platelets circulating in vaccinated (n = 21) and unvaccinated patients with COVID-19, either admitted to the intensive care unit (ICU, n = 36) or not (non-ICU, n = 38), in comparison to matched SARS-CoV-2-negative patients (n = 48), was performed.

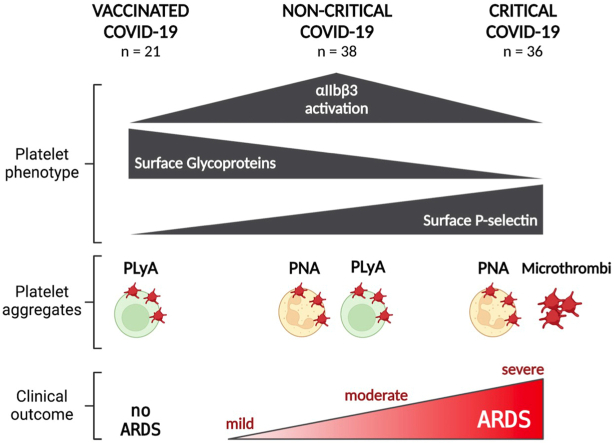
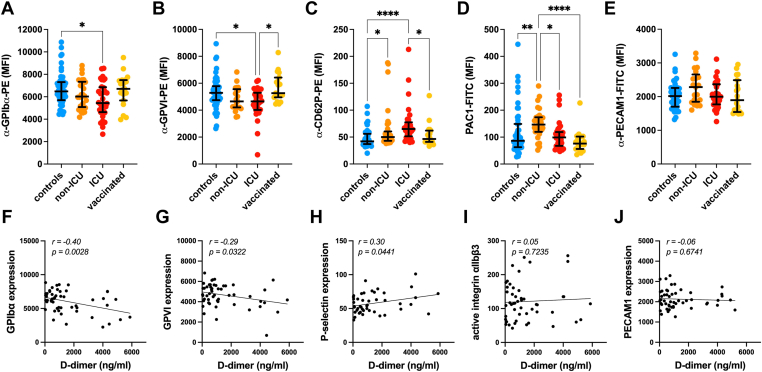
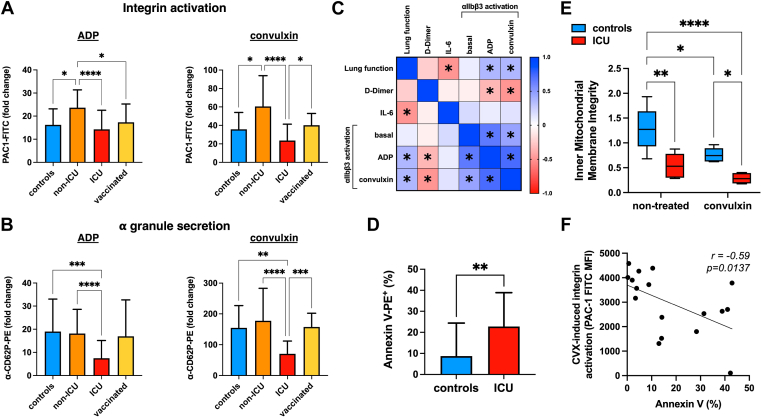
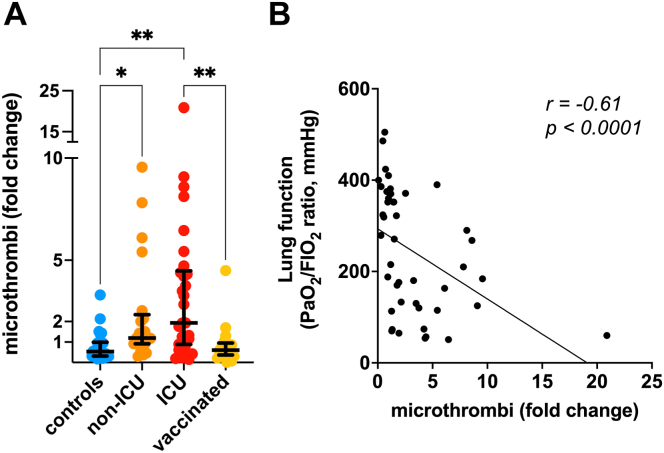
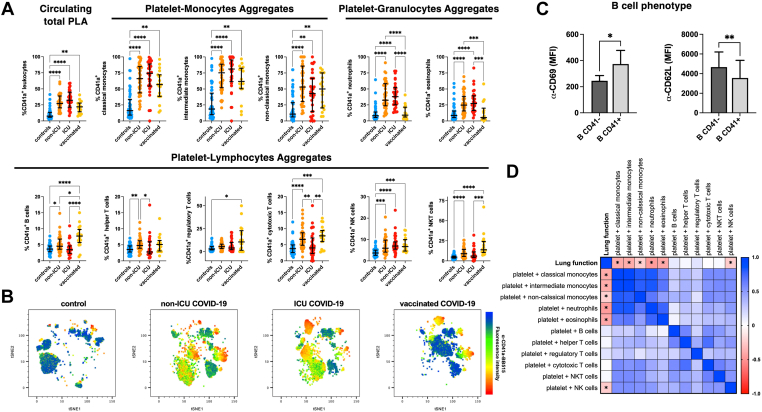
Results: In the circulation of unvaccinated non-ICU patients with COVID-19, we detected hyperactive and hyperresponsive platelets and platelet aggregates with adaptive and innate immune cells. In unvaccinated ICU patients with COVID-19, most of whom had severe acute respiratory distress syndrome, platelets had high P-selectin and phosphatidylserine exposure but low capacity to activate integrin αIIbβ3, dysfunctional mitochondria, and reduced surface glycoproteins. In addition, in the circulation of ICU patients, we detected microthrombi and platelet aggregates with innate, but not with adaptive, immune cells. In vaccinated patients with COVID-19, who had no acute respiratory distress syndrome, platelets had surface receptor levels comparable to those in controls and did not form microthrombi or platelet-granulocyte aggregates but aggregated avidly with adaptive immune cells.

Conclusion: Our study provides evidence that vaccinated patients with COVID-19 are not associated with platelet hyperactivation and are characterized by platelet-leukocyte aggregates that foster immune protection but not excessive immunothrombosis. These findings advocate for the importance of vaccination in preventing severe COVID-19.

Keywords: COVID-19; immunothrombosis; platelet aggregates; respiratory distress syndrome; vaccination.


Figures

None
Graphical abstract
Figure 1
Figure 1
Clinical, serological, and immunological markers of disease severity in vaccinated and unvaccinated patients with COVID-19. (A) Violin plot of the PaO2/FiO2 ratio of vaccinated (yellow) and unvaccinated patients with COVID-19, admitted to the intensive care unit (ICU, red) or not (non-ICU, orange). The median is shown as a black dotted line, and the upper and lower quartiles are indicated by grey dotted lines. The PaO2/FiO2 ratio is a clinical measure of lung function that is used to stratify patients with severe (<100 mmHg, dark grey area), moderate (100-200 mmHg, medium grey area), and mild (200-300 mmHg, light grey area) acute respiratory distress syndrome (ARDS). Kruskal–Wallis test and Dunn’s multiple comparison test were used for intergroup analysis. (B) Violin plot of the circulating cell-free double-stranded DNA (dsDNA) in the serum of non-ICU (orange), ICU (red), and vaccinated (yellow) patients with COVID-19 and controls (blue). Kruskal–Wallis test and Dunn’s multiple comparison test were used for intergroup analysis. (C) Immunophenotype of non-ICU, ICU vaccinated COVID-19, and control patients. Leukocyte subpopulations were identified by multiparameter flow cytometry on a BD LSRFortessa and analyzed with the FlowJo LLC software, version 10.8.1, based on the expression of surface markers: classical (CD14+CD16), intermediate (CD14+CD16+), and nonclassical (CD14dimCD16+) monocytes; neutrophils (CD66+CD16+); eosinophils (CD66+CD16); B cells (CD3CD19+); CD4+ (CD3+CD4+), regulatory (CD3+CD4+CD25high), and CD8+ (CD3+CD8+) T cells, and natural killer (NK, CD3CD56+) and natural killer T cells (NKT, CD56+CD3+). Shown are the median ± IQR of the percentage of each subset relative to all leukocytes. Kruskal-Wallis test and Dunn’s multiple comparison test were used for intergroup analysis. ∗P < .05; ∗∗P < .01; ∗∗∗P < .001; ∗∗∗∗P < .0001. (D) Representative t-distributed stochastic neighbor embedding (t-SNE) dot plot of 4 patients, 1 for each studied group, analyzed on the same day. The t-SNE plot was obtained by combining the data of the 4 patients before identifying the leukocyte subsets, which are labeled with different colors as shown in the legend.
Figure 2
Figure 2
Platelet surface receptor expression of vaccinated and unvaccinated patients with COVID-19 in relation to their D-dimer levels. Surface expression of platelet receptors of SAR-CoV-2–negative control patients (blue, controls), unvaccinated patients with COVID-19 admitted to the intensive care unit (ICU, red) or not (non-ICU, orange), and vaccinated patients with COVID-19 (yellow, vaccinated) detected by flow cytometry after staining of citrated (nonstimulated) whole blood with (A) α-CD42b-PE (GPIbα), (B) α-GPVI-PE, (C) α-CD62P-PE (P-selectin), (D) PAC1-FITC (active αIIbβ3), and (E) α-CD31-FITC (PECAM1). Samples were acquired on a BD Accuri C6 Plus and analyzed with the FlowJo LLC software, version 10.8.1. Graphs show the median fluorescence intensity (MFI) ± IQR. Kruskal–Wallis test and Dunn’s multiple comparison test were used for intergroup analysis. ∗P < .05; ∗∗P < .01; ∗∗∗∗P < .0001. Simple linear regression analysis between the surface receptor expression of (F) GPIbα, (G) GPVI, (H) P-selectin, (I) active αIIbβ3, and (J) PECAM1 with the D-dimer concentration expressed in nanograms per milliliter. On the right top corner of each graph are shown the correlation coefficient (r) and the P value.
Figure 3
Figure 3
Platelet responsiveness of vaccinated and unvaccinated patients with COVID-19 in relation to their lung function and D-dimer and interleukin 6 (IL-6) levels. Fold change of the (A) activation of integrin αIIbβ3 (PAC1-FITC binding) and of (B) α-granule secretion (α-CD62P-PE binding) in platelets stimulated with adenosine diphosphate (ADP) or convulxin (CVX) (GPVI agonist) relative to the unstimulated platelets from SAR-CoV-2–negative control patients (blue, controls), unvaccinated patients with COVID-19 admitted to the intensive care unit (ICU, red) or not (non-ICU, orange), and vaccinated patients with COVID-19 (yellow, vaccinated). Kruskal–Wallis test with Dunn’s multiple comparison test were used for intergroup analysis. (C) Spearman rank correlation analysis between integrin αIIbβ3 activation in nonstimulated (basal) and ADP- or CVX-stimulated platelets and the lung function (PaO2/FiO2 ratio), the plasmatic concentration of D-dimer, and that of IL-6. The color of each box indicates the correlation coefficient (r), that ranges from +1 (positive correlation, blue) to −1 (negative correlation, red), and the asterisks indicate significant (P < .05) correlations. (D) Phosphatidylserine exposure (expressed as percentage of platelets binding to Annexin V-PE) on the outer leaflet of platelets from SAR-CoV-2–negative controls (blue) and ICU COVID-19 patients (red), analyzed by Mann–Whitney U-test. (E) Flow cytometric analysis of the inner mitochondrial membrane integrity quantified as the ratio of the median fluorescence intensity emitted by MitoTracker Red CMXRos and MitoTracker Green FM incubated with nontreated and CVX-stimulated platelets of SAR-CoV-2–negative controls (blue) and ICU patients with COVID-19 (red). Statistical significance was computed by 2-way analysis of variance and Sidak’s multiple comparison test. (F) Simple linear regression analysis between the platelet responsiveness to CVX (CVX-induced integrin activation) and phosphatidylserine exposure (Annexin V binding). On the top right corner, the correlation coefficient (r) and the P value are shown. ∗P < .05; ∗∗P < .01; ∗∗∗P < .001; ∗∗∗∗P < .0001.
Figure 4
Figure 4
Platelet–platelet aggregates in vaccinated and unvaccinated patients with COVID-19. (A) Bar graph of the relative frequency of circulating platelet–platelet aggregates (microthrombi). Shown is the mean ± SD of the fold change relative to the negative control. Kruskal–Wallis test and Dunn’s multiple comparison test were used for intergroup analysis. ∗P < .05; ∗∗P < .01. (B) Simple linear regression analysis between the lung function (PaO2/FiO2 ratio) of the patients and the fold change of circulating microthrombi. On the top right corner, the correlation coefficient (r) and the P value are shown. ICU, intensive care unit.
Figure 5
Figure 5
Platelet–leukocyte aggregates (PLAs) in vaccinated and unvaccinated patients with COVID-19. (A) Relative frequencies of the circulating platelet aggregates with neutrophils (CD66+CD16+); eosinophils (CD66+CD16); classical (CD14+CD16), intermediate (CD14+CD16+), and nonclassical (CD14dimCD16+) monocytes; B cells (CD3CD19+); helper (CD3+CD4+), cytotoxic (CD3+CD8+), and regulatory (CD3+CD4+CD25high) T cells; and natural killer (NK, CD3CD56+) and natural killer T cells (NKT, CD56+CD3+). Flow cytometry acquisition was performed on a BD LSRFortessa and analyzed with the FlowJo LLC software. PLAs were identified based on the expression of CD41a in the individual leukocyte subpopulations and shown is the median ± IQR of the percentage of CD41a+ leukocytes of different subsets. Kruskal–Wallis test and Dunn’s multiple comparison test were used for intergroup analysis. (B) T-distributed stochastic neighbor embedding (t-SNE) plot showing the CD41a+ leukocytes in 4 representative patients. Red dots indicate higher CD41a expression. (C) B cell phenotype in vaccinated patients with COVID-19. Bar graphs of the expression (median fluorescence intensity [MFI]) of CD69 (activation marker) and CD62L (L-selectin, migration marker) on platelet-bound (B CD41+) and platelet-unbound (B CD41) B cells. Statistical significance was determined by paired t-test analysis. ∗P < .05; ∗∗P < .01; ∗∗∗P < .001; ∗∗∗∗P < .0001. (D) Spearman rank correlation analysis between the lung function (PaO2/FiO2 ratio) and the frequency of PLAs. The color of each box indicates the correlation coefficient (r) that ranges from +1 (positive correlation, blue) to −1 (negative correlation, red), and the asterisks indicate significant (P < .05) correlations. ICU, intensive care unit.
Figure 6
Figure 6
Effect of P-selectin inhibition on the frequency of platelet–leukocyte aggregates (PLAs) in unvaccinated patients with COVID-19. (A) Fold change of the frequency of platelet–lymphocyte aggregates (PLyAs), platelet–monocyte aggregate (PMAs), and platelet–granulocyte aggregates (PGAs) after incubation of whole blood of non–intensive care unit patients with COVID-19 (n = 3) with a blocking anti-CD62P antibody (clone AK4). Kruskal–Wallis test and Dunn’s multiple comparison test were used for intergroup analysis. ∗∗∗P < .001. (B) Data interpretation model. Intensive care unit and vaccinated patients represent 2 extremes of the COVID-19 spectrum. High PGAs and low PLyAs identify patients in critical conditions that fail to evoke an effective adaptive immune response and compensate with an excessive innate immune response that injures the host and contributes to the pathogenicity of the disease. Low PGAs and high PLyAs characterize vaccinated subjects that by evoking a rapid adaptive immune response are protected from the virus itself and from the pathogenic effects of a prolonged innate immune response. A P-selectin inhibitor would in principle be beneficial to reduce COVID-19 severity by reducing the pathogenic effects of innate immunity while minimally affecting the adaptive immune response. ns, nonsignificant.

Similar articles

References

    1. Stark K., Massberg S. Interplay between inflammation and thrombosis in cardiovascular pathology. Nat Rev Cardiol. 2021;18:666–682. - PMC - PubMed
    1. Middleton E.A., He X.Y., Denorme F., Campbell R.A., Ng D., Salvatore S.P., et al. Neutrophil extracellular traps contribute to immunothrombosis in COVID-19 acute respiratory distress syndrome. Blood. 2020;136:1169–1179. - PMC - PubMed
    1. Nicolai L., Leunig A., Brambs S., Kaiser R., Weinberger T., Weigand M., et al. Immunothrombotic dysregulation in COVID-19 pneumonia is associated with respiratory failure and coagulopathy. Circulation. 2020;142:1176–1189. - PMC - PubMed
    1. Dagan N., Barda N., Kepten E., Miron O., Perchik S., Katz M.A., et al. BNT162b2 mRNA COVID-19 vaccine in a nationwide mass vaccination setting. N Engl J Med. 2021;384:1412–1423. - PMC - PubMed
    1. Tartof S.Y., Slezak J.M., Fischer H., Hong V., Ackerson B.K., Ranasinghe O.N., et al. Effectiveness of mRNA BNT162b2 COVID-19 vaccine up to 6 months in a large integrated health system in the USA: a retrospective cohort study. Lancet. 2021;398:1407–1416. - PMC - PubMed

LinkOut - more resources