. 2023 Oct 28;9(1):e10599.
doi: 10.1002/btm2.10599. eCollection 2024 Jan.

Hydrophobic ion pairing and microfluidic nanoprecipitation enable efficient nanoformulation of a small molecule indolamine 2, 3-dioxygenase inhibitor immunotherapeutic

Affiliations

Hydrophobic ion pairing and microfluidic nanoprecipitation enable efficient nanoformulation of a small molecule indolamine 2, 3-dioxygenase inhibitor immunotherapeutic

Parisa Badiee et al. Bioeng Transl Med. .

Abstract

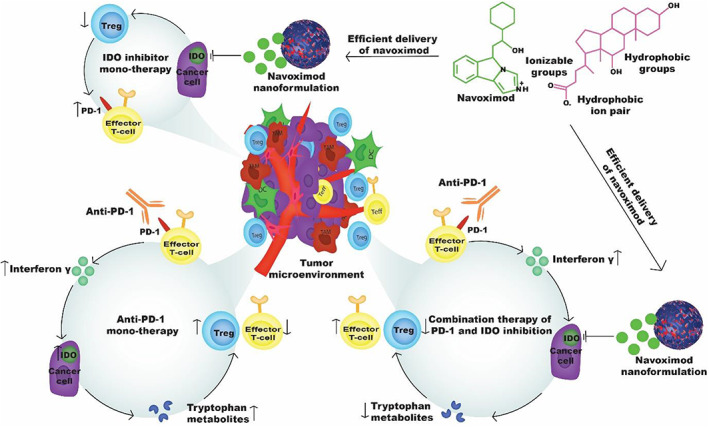
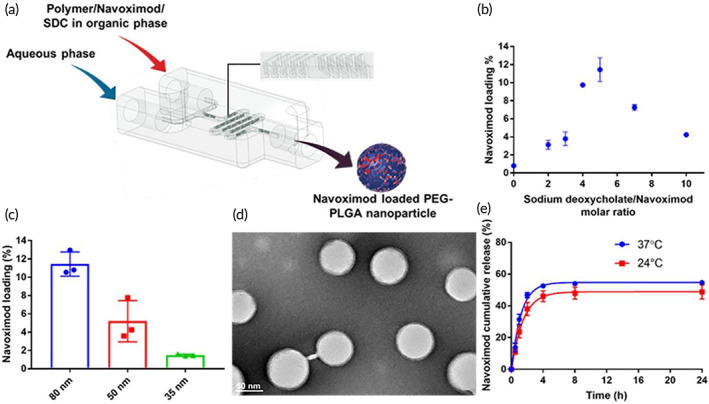
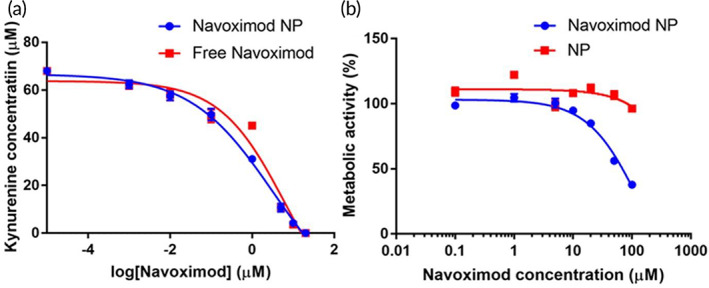
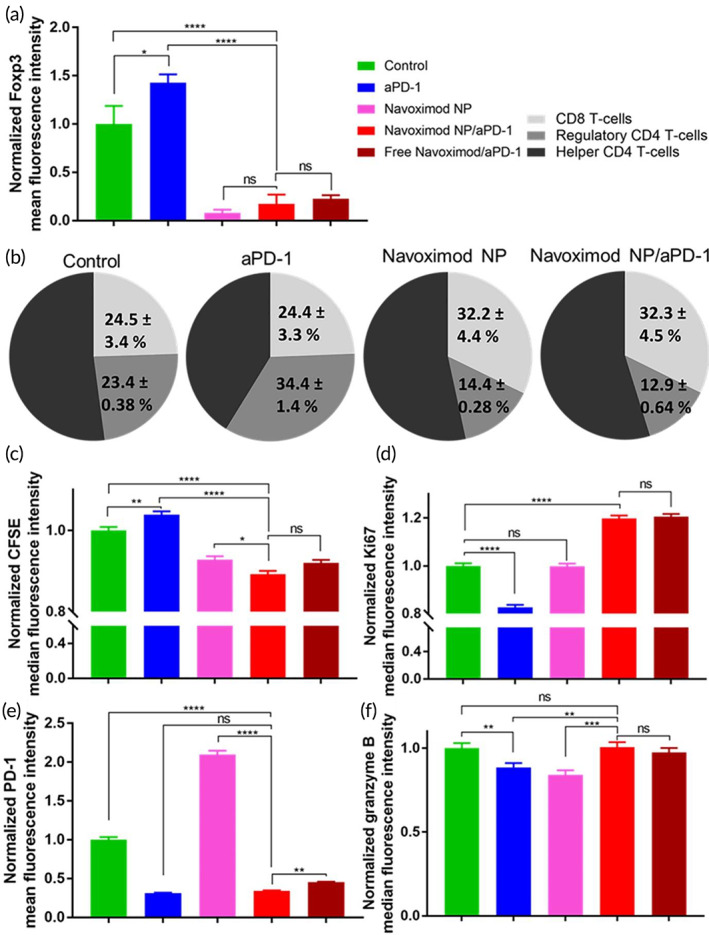
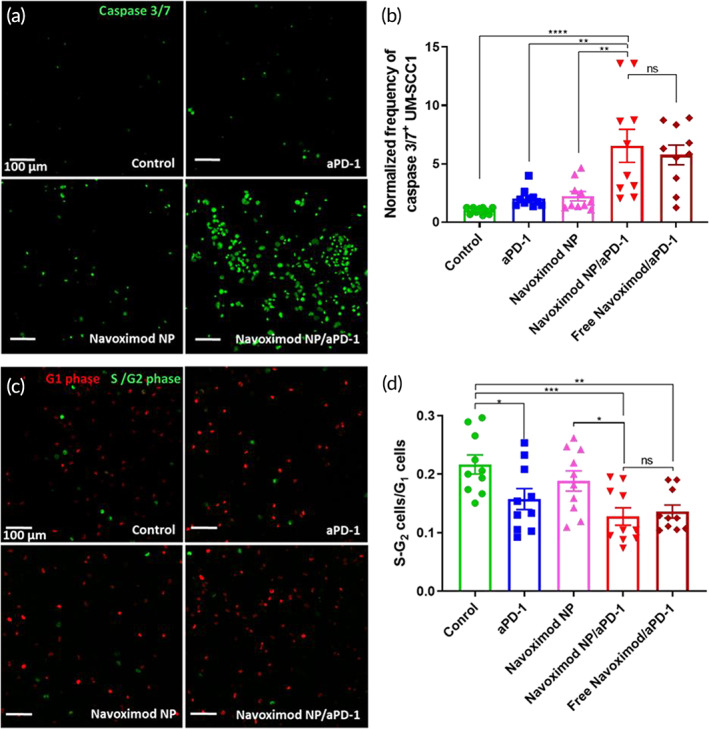
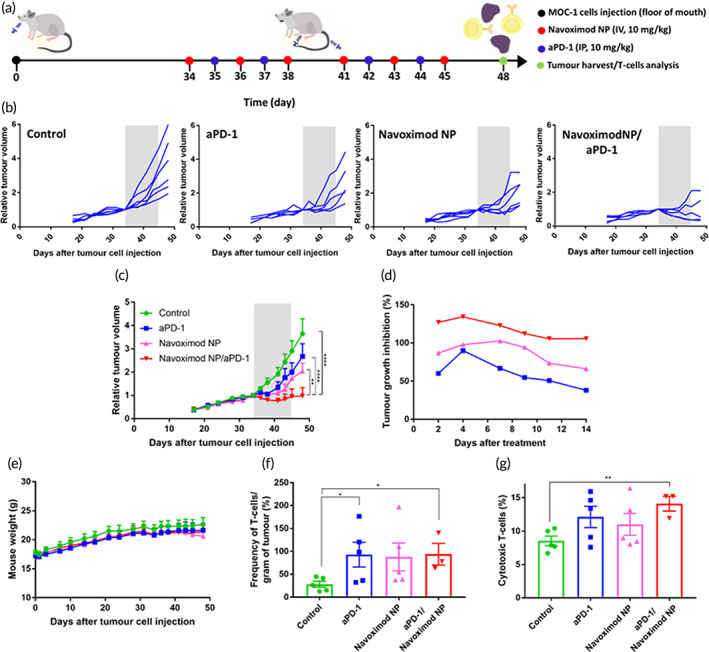
Blockade of programmed cell death-1 (PD-1) is a transformative immunotherapy. However, only a fraction of patients benefit, and there is a critical need for broad-spectrum checkpoint inhibition approaches that both enhance the recruitment of cytotoxic immune cells in cold tumors and target resistance pathways. Indoleamine 2, 3-dioxygenase (IDO) small molecule inhibitors are promising but suboptimal tumor bioavailability and dose-limiting toxicity have limited therapeutic benefits in clinical trials. This study reports on a nanoformulation of the IDO inhibitor navoximod within polymeric nanoparticles prepared using a high-throughput microfluidic mixing device. Hydrophobic ion pairing addresses the challenging physicochemical properties of navoximod, yielding remarkably high loading (>10%). The nanoformulation efficiently inhibits IDO and, in synergy with PD-1 antibodies improves the anti-cancer cytotoxicity of T-cells, in vitro and in vivo. This study provides new insight into the IDO and PD-1 inhibitors synergy and validates hydrophobic ion pairing as a simple and clinically scalable formulation approach.

Keywords: cancer immunotherapy; hydrophobic ion pairing; immune checkpoint inhibitors; indoleamine 2, 3‐dioxygenase; nanomedicine.


Conflict of interest statement

The authors have no conflicts of interest to declare.

Figures

FIGURE 1
FIGURE 1
Schematic illustration of mechanisms underpinning highly potent anti‐tumor effects for combined indoleamine 2, 3‐dioxygenase (IDO) and PD‐1 inhibition. Hydrophobic ion pairing enables efficient nanoformulation of the IDO inhibitor navoximod. However, monotherapy using navoximod nanoformulation results in overexpression of PD‐1 receptors and moderate anti‐tumor response in vivo. Conversely, monotherapy with PD‐1 antibodies (anti‐PD‐1) results in overexpression of the IDO enzyme which is thought to cause resistance to the therapy. This can be overcome by combination therapy with the navoximod nanoformulation and anti‐PD‐1 checkpoint inhibition.
FIGURE 2
FIGURE 2
Optimization and physicochemical characterization of the navoximod nanoformulation. (a) Schematic diagram of navoximod nanoformulation preparation using a 3D printed microfluidic device for nanoprecipitation; SDC, Sodium deoxycholate. Effect of (b) sodium deoxycholate/navoximod molar ratio and (c) NPs' size on drug loading. (d) Representative TEM image of the navoximod nanoformulation (scale bar is 50 nm). (e) Cumulative drug release profile of navoximod nanoformulation over 24 h at 24 and 37°C.
FIGURE 3
FIGURE 3
Inhibition of IDO enzyme and effect on UM‐SCC1 cells metabolic activity. (a) The effect of navoximod nanoformulation (Navoximod NP) and free navoximod on the inhibition of IDO enzyme in UM‐SCC1 cells (N = 5/navoximod concentration). (b) The effect of Navoximod NPs and blank NPs on the metabolic activity of UM‐SCC1 cells by MTT assay (N = 5/navoximod concentration).
FIGURE 4
FIGURE 4
Effect of the navoximod nanoformulation as single or combination therapy with aPD‐1 on immunosuppressive and cytotoxic characteristics of T‐cells. (a) Effect of treatment of co‐cultures of activated T‐cells and UM‐SCC1 cells with aPD‐1 (5 μg/mL), navoximod nanoformulation (navoximod NP) (10 μM), navoximod NP combined with aPD‐1 (10 μM and 5 μg/mL), and free navoximod combined with aPD‐1 (10 μM and 5 μg/mL) on regulatory T‐cells (CD3+CD4+FoxP3+ T‐cells), analyzed 48 h after treatment. (b) Effect of treatment on the populations of cytotoxic CD8 T‐cells (CD3+CD8+ T‐cells), regulatory T‐cells (CD3+CD4+FoxP3+ T‐cells), and helper CD4 T‐cells (CD3+CD4+FoXP3 T‐cells). (c) Proliferation of CFSE labeled T‐cells in co‐culture of activated T‐cells and UM‐SCC1 cells 48 h post treatment. (d) Ki67 expression measured 24 h after treatment. (e) Expression of PD‐1 receptors in treated T‐cells 48 h after treatment. (f) Impact of treatment on granzyme B production by T‐cells 24 h after treatment. The cellular markers were measured by imaging flow cytometry after gating for CD3+ single cells. Data were analyzed using a one‐way ANOVA with Tukey post hoc test.
FIGURE 5
FIGURE 5
Effect of the navoximod nanoformulation as a single or combination therapy with aPD‐1 on the activity of T‐cells against UM‐SCC1 cells. (a) Representative images and (b) quantification of caspase 3/7 activated UM‐SCC1 cells co‐cultured for 24 h with T‐cells after treatment with aPD‐1 (5 μg/mL), navoximod nanoformulation (Navoximod NP, 10 μM), Navoximod NPs combined with aPD‐1 (10 μM and 5 μg/mL), and free navoximod combined with aPD‐1 (10 μM and 5 μg/mL). (c) Representative images and (d) quantification of fucci‐SCC1 cell cycle after treatment. Red cells are in the G1 phase, green cells are in the S/G2 phase. In all images, the scale bar is 100 μm. Cell populations were quantified by counting 10 images/group taken from different areas of well plate.
FIGURE 6
FIGURE 6
In vivo anti‐tumor effects of navoximod nanoformulation as a single or combination therapy with aPD‐1. (a) Experimental design of the animal study in orthotopic MOC‐1 bearing C57BL/6 mice. (b) Tumor volumes relative to those at the start of treatment for control (N = 6), aPD‐1 (N = 5), navoximod nanoformulation (Navoximod NP, N = 6), navoximod nanoformulation/aPD‐1 combination therapy (N = 5) groups and (C) the average tumor volumes in each group. Gray zone indicates the treatment period. Data were analyzed using a two‐way ANOVA with Tukey post hoc test. (d) Impact of treatment on tumor growth inhibition rate. (e) Tumor bearing mice body weight during the study. Effect of treatment on (f) the frequency of tumor infiltrating T‐cells per mass of tumor tissues and (g) the population of cytotoxic T‐cells in tumor tissues. T‐cells and cytotoxic T‐cells were measured by flow cytometry after gating for CD3+ live cells and CD8+ CD3+ live cells, respectively (N = 5 for control, aPD‐1 and navoximod nanoformulation, and N = 3 for combination therapy group due to insufficient cell number in some animals in this group). Data were analyzed by two‐tailed unpaired t‐test to compare the treatment with the control.

Similar articles

References

    1. Couzin‐Frankel J. Cancer immunotherapy. Science. 1979;342(2013):1432‐1433. doi:10.1126/science.342.6165.1432 - DOI - PubMed
    1. Postow MA, Callahan MK, Wolchok JD. Immune checkpoint blockade in cancer therapy. J Clin Oncol. 2015;33:1974‐1982. doi:10.1200/JCO.2014.59.4358 - DOI - PMC - PubMed
    1. Mahoney KM, Freeman GJ, McDermott DF. The next immune‐checkpoint inhibitors: Pd‐1/pd‐l1 blockade in melanoma. Clin Ther. 2015;37:764‐782. doi:10.1016/j.clinthera.2015.02.018 - DOI - PMC - PubMed
    1. Ribas A, Wolchok JD. Cancer immunotherapy using checkpoint blockade. Science. 1979;359(2018):1350‐1355. doi:10.1126/science.aar4060 - DOI - PMC - PubMed
    1. Buchbinder EI, Desai A. CTLA‐4 and PD‐1 pathways similarities, differences, and implications of their inhibition. Am J Clin Oncol. 2016;39:98‐106. doi:10.1097/COC.0000000000000239 - DOI - PMC - PubMed