. 2024 May 3;147(5):1887-1898.
doi: 10.1093/brain/awad436.

Role of the repeat expansion size in predicting age of onset and severity in RFC1 disease

Collaborators, Affiliations

Role of the repeat expansion size in predicting age of onset and severity in RFC1 disease

Riccardo Currò et al. Brain. .

Abstract

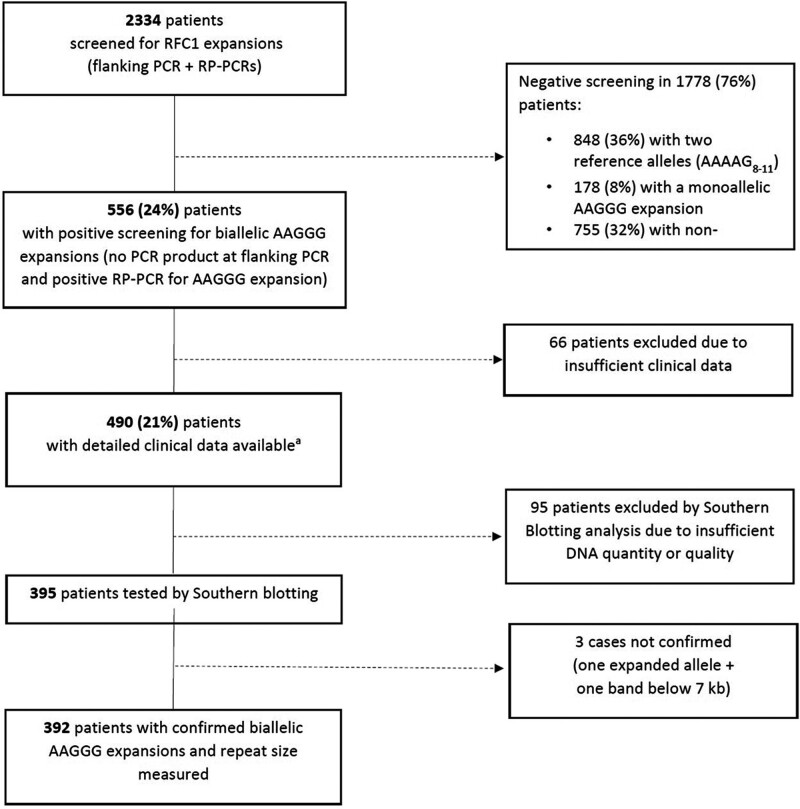
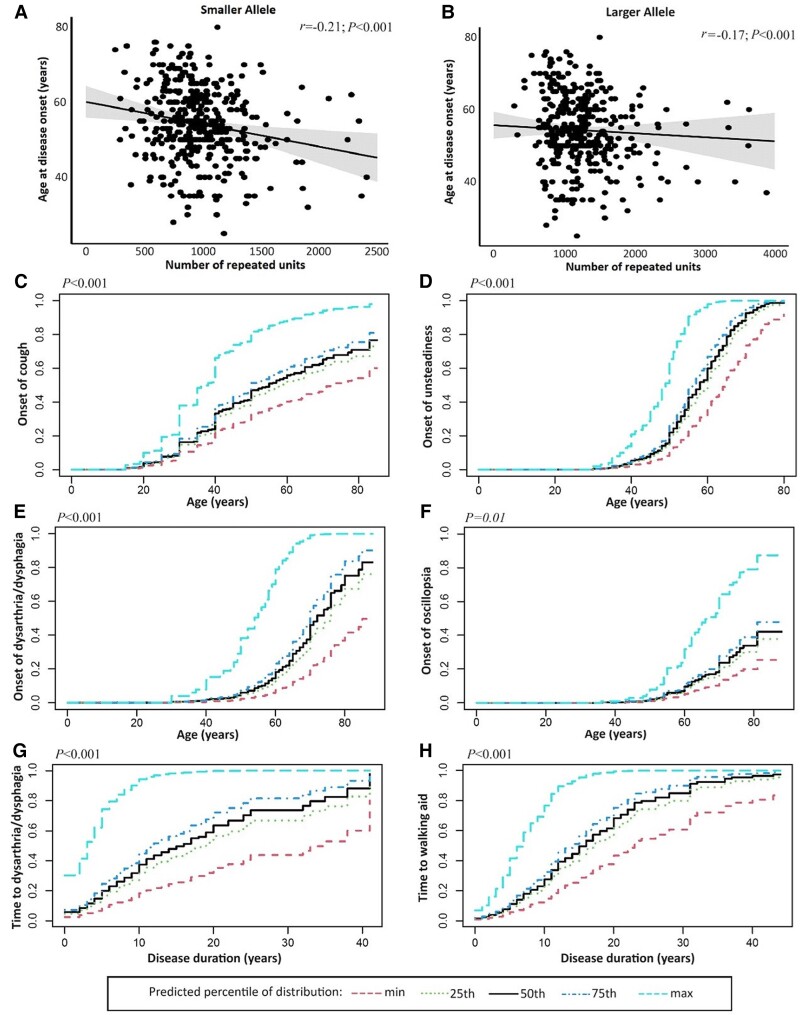
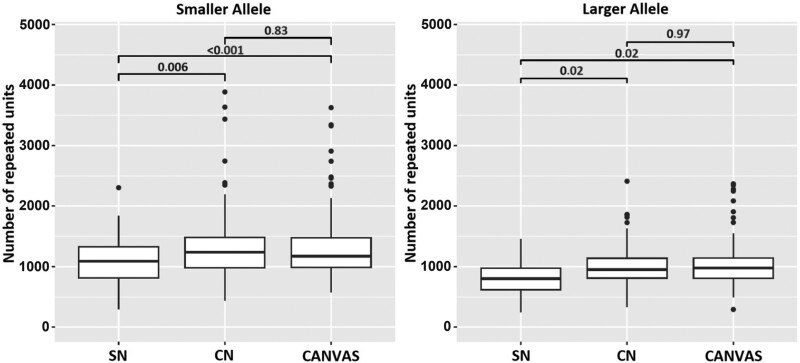
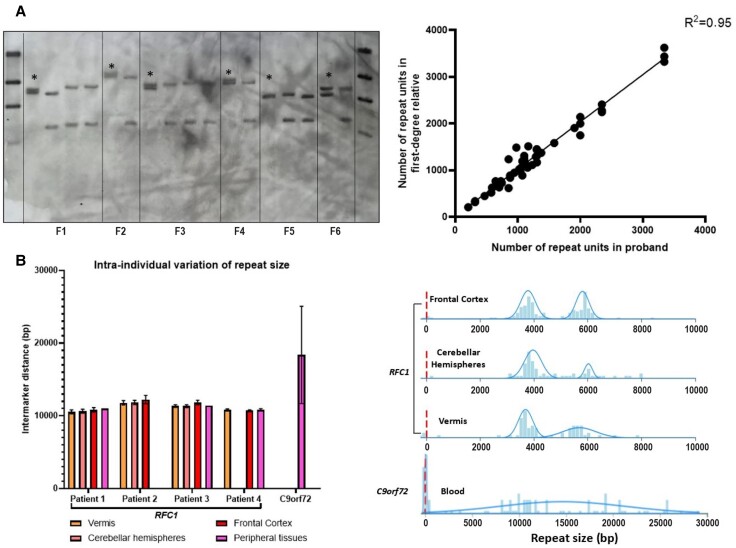
RFC1 disease, caused by biallelic repeat expansion in RFC1, is clinically heterogeneous in terms of age of onset, disease progression and phenotype. We investigated the role of the repeat size in influencing clinical variables in RFC1 disease. We also assessed the presence and role of meiotic and somatic instability of the repeat. In this study, we identified 553 patients carrying biallelic RFC1 expansions and measured the repeat expansion size in 392 cases. Pearson's coefficient was calculated to assess the correlation between the repeat size and age at disease onset. A Cox model with robust cluster standard errors was adopted to describe the effect of repeat size on age at disease onset, on age at onset of each individual symptoms, and on disease progression. A quasi-Poisson regression model was used to analyse the relationship between phenotype and repeat size. We performed multivariate linear regression to assess the association of the repeat size with the degree of cerebellar atrophy. Meiotic stability was assessed by Southern blotting on first-degree relatives of 27 probands. Finally, somatic instability was investigated by optical genome mapping on cerebellar and frontal cortex and unaffected peripheral tissue from four post-mortem cases. A larger repeat size of both smaller and larger allele was associated with an earlier age at neurological onset [smaller allele hazard ratio (HR) = 2.06, P < 0.001; larger allele HR = 1.53, P < 0.001] and with a higher hazard of developing disabling symptoms, such as dysarthria or dysphagia (smaller allele HR = 3.40, P < 0.001; larger allele HR = 1.71, P = 0.002) or loss of independent walking (smaller allele HR = 2.78, P < 0.001; larger allele HR = 1.60; P < 0.001) earlier in disease course. Patients with more complex phenotypes carried larger expansions [smaller allele: complex neuropathy rate ratio (RR) = 1.30, P = 0.003; cerebellar ataxia, neuropathy and vestibular areflexia syndrome (CANVAS) RR = 1.34, P < 0.001; larger allele: complex neuropathy RR = 1.33, P = 0.008; CANVAS RR = 1.31, P = 0.009]. Furthermore, larger repeat expansions in the smaller allele were associated with more pronounced cerebellar vermis atrophy (lobules I-V β = -1.06, P < 0.001; lobules VI-VII β = -0.34, P = 0.005). The repeat did not show significant instability during vertical transmission and across different tissues and brain regions. RFC1 repeat size, particularly of the smaller allele, is one of the determinants of variability in RFC1 disease and represents a key prognostic factor to predict disease onset, phenotype and severity. Assessing the repeat size is warranted as part of the diagnostic test for RFC1 expansion.

Keywords: CANVAS; RFC1; ataxia; neuropathy; repeat expansions; southern blotting.


Conflict of interest statement

The authors report no competing interests.

Figures

Figure 1
Figure 1
Flow chart describing the results of the genetic screening for RFC1 expansions. RP-PCR = repeat-primed polymerase chain reaction. aThree cases were subsequently excluded from the analysis because Southern blotting did not confirm the presence of biallelic expansions.
Figure 2
Figure 2
Relationship between repeat size and main symptoms of RFC1 disease. (A and B) The scatter plots illustrate the strength and the direction of the correlation between the age at neurological onset of the disease (y-axis) and the repeat size of the smaller or the larger allele (x-axis). (CF) The curves illustrate the predicted cumulative incidence function (CIF) for chronic cough, unsteadiness, dysarthria/dysphagia and oscillopsia plotted against age at onset. (G and H) Predicted CIF for dysarthria/dysphagia and need of walking aid plotted against disease duration. Curves are stratified for values of smaller allele repeat size equal to the minimum value, 25th, 50th,75th percentiles and maximum value of distribution.
Figure 3
Figure 3
Relationship between phenotype and repeat length. The box plots compare the repeat size for the smaller (left) and larger (right) alleles in patients with different phenotypes at last examination. P-values were calculated adopting Tukey’s correction. CANVAS = cerebellar ataxia, neuropathy and vestibular areflexia syndrome; CN = complex neuropathy; SN = sensory neuropathy.
Figure 4
Figure 4
Limited meiotic and somatic instability of the AAGGG repeat expansion. (A) On the left, the picture illustrates a representative example of Southern blotting including probands (asterisks) and unaffected relatives from six families (Families F1–F6). On the right, the correlation plot shows the relationship of the repeat size within members of the same family. Each dot corresponds to a meiotic event. (B) Left: The bar chart shows the dispersion of the repeat size among different brain areas and peripheral tissues of four patients with RFC1 biallelic expansions and in one patient with C9orf72 expansion. Mean intermarker distance (expressed in base pairs, bp) and standard deviations (SDs) are shown. In Patient 1 and Patient 3, repeat size from peripheral tissue was measured by Southern blotting. Right: Distribution of DNA molecules measured by genome optical mapping (Bionano Genomics) in different tissues of a patient with a biallelic expansion in RFC1 and in blood-derived DNA of a patient with C9orf72 expansion. The size of DNA molecules mapping on RFC1 or C9orf72 locus is expressed in base pairs.

References

    1. Richard G-F, Kerrest A, Dujon B. Comparative genomics and molecular dynamics of DNA repeats in eukaryotes. Microbiol Mol Biol Rev. 2008;72:686–727. - PMC - PubMed
    1. Paulson H. Repeat expansion diseases. Handb Clin Neurol. 2018;147:105–123. - PMC - PubMed
    1. Orr HT, Zoghbi HY. Trinucleotide repeat disorders. Annu Rev Neurosci. 2007;30:575–621. - PubMed
    1. Hannan AJ. Tandem repeats mediating genetic plasticity in health and disease. Nat Rev Genet. 2018;19:286–298. - PubMed
    1. Ibañez K, Polke J, Hagelstrom RT, et al. Whole genome sequencing for the diagnosis of neurological repeat expansion disorders in the UK: A retrospective diagnostic accuracy and prospective clinical validation study. Lancet Neurol. 2022;21:234–245. - PMC - PubMed

Publication types