. 2024 Jan;14(1):e1523.
doi: 10.1002/ctm2.1523.

Mutational profiling of mitochondrial DNA reveals an epithelial ovarian cancer-specific evolutionary pattern contributing to high oxidative metabolism

Affiliations

Mutational profiling of mitochondrial DNA reveals an epithelial ovarian cancer-specific evolutionary pattern contributing to high oxidative metabolism

Fanfan Xie et al. Clin Transl Med. 2024 Jan.

Abstract

Background: Epithelial ovarian cancer (EOC) heavily relies on oxidative phosphorylation (OXPHOS) and exhibits distinct mitochondrial metabolic reprogramming. Up to now, the evolutionary pattern of somatic mitochondrial DNA (mtDNA) mutations in EOC tissues and their potential roles in metabolic remodelling have not been systematically elucidated.

Methods: Based on a large somatic mtDNA mutation dataset from private and public EOC cohorts (239 and 118 patients, respectively), we most comprehensively characterised the EOC-specific evolutionary pattern of mtDNA mutations and investigated its biological implication.

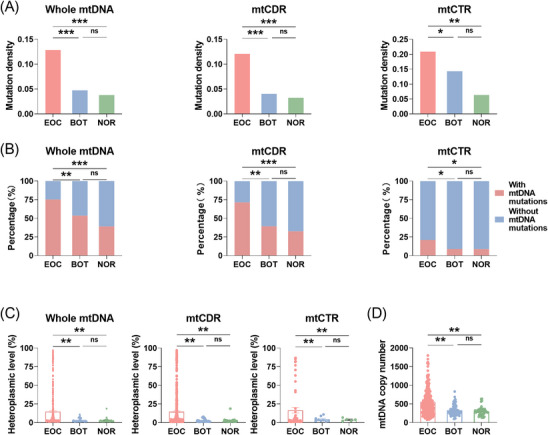
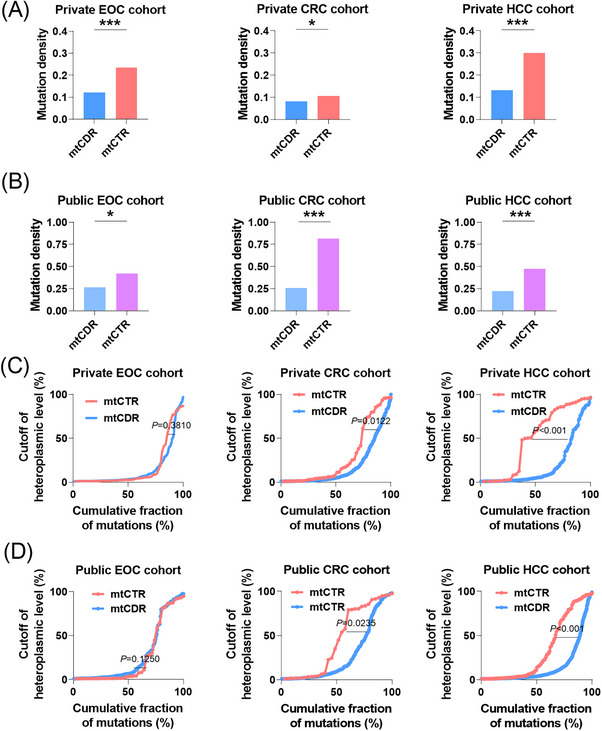
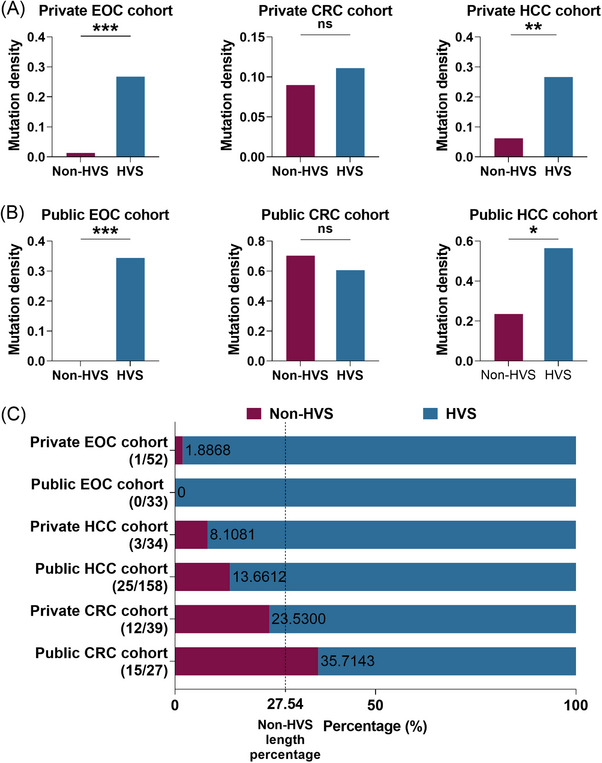
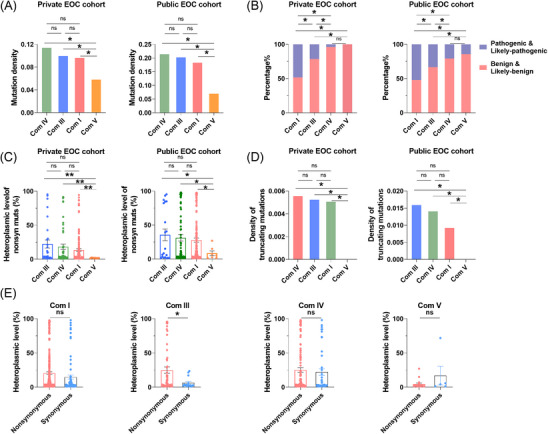
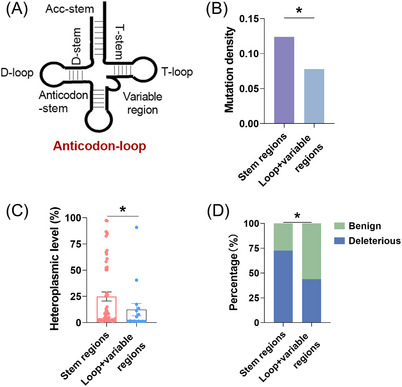
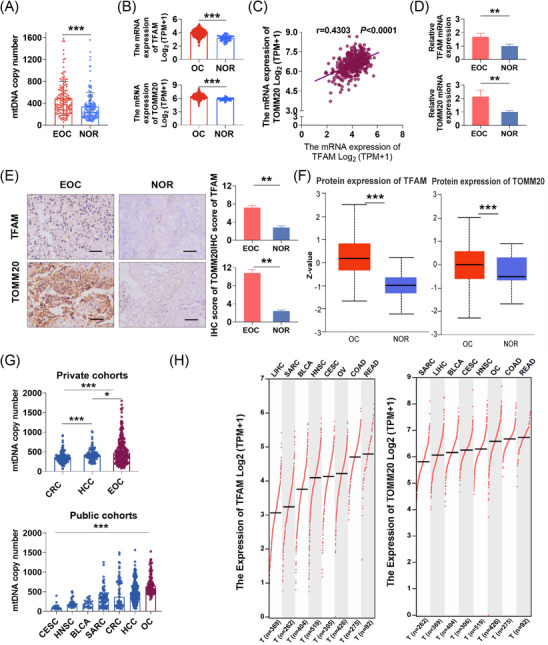
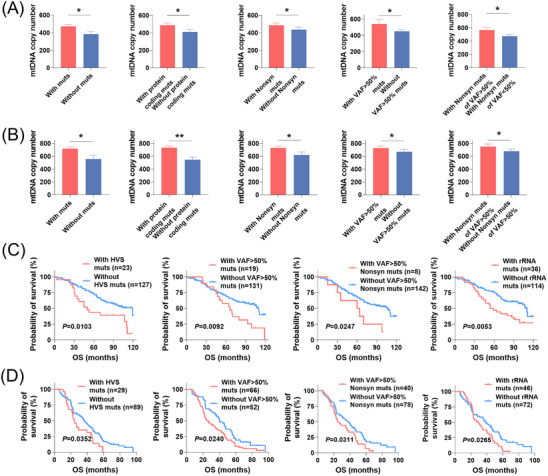
Results: Mutational profiling revealed that the mitochondrial genome of EOC tissues was highly unstable compared with non-cancerous ovary tissues. Furthermore, our data indicated the delayed heteroplasmy accumulation of mtDNA control region (mtCTR) mutations and near-complete absence of mtCTR non-hypervariable segment (non-HVS) mutations in EOC tissues, which is consistent with stringent negative selection against mtCTR mutation. Additionally, we observed a bidirectional and region-specific evolutionary pattern of mtDNA coding region mutations, manifested as significant negative selection against mutations in complex V (ATP6/ATP8) and tRNA loop regions, and potential positive selection on mutations in complex III (MT-CYB). Meanwhile, EOC tissues showed higher mitochondrial biogenesis compared with non-cancerous ovary tissues. Further analysis revealed the significant association between mtDNA mutations and both mitochondrial biogenesis and overall survival of EOC patients.

Conclusions: Our study presents a comprehensive delineation of EOC-specific evolutionary patterns of mtDNA mutations that aligned well with the specific mitochondrial metabolic remodelling, conferring novel insights into the functional roles of mtDNA mutations in EOC tumourigenesis and progression.

Keywords: epithelial ovarian cancer; evolutionary selection; metabolic remodelling; mitochondrial DNA; somatic mutations.


Conflict of interest statement

The authors declare that they have no competing interests.

Figures

FIGURE 1
FIGURE 1
EOC exhibited highly unstable mitochondrial genome. (A) The percentage of tissues with somatic mutations in mtDNA, mtCDR and mtCTR among three tissue types. (B and C) The mutation density and heteroplasmic level of somatic mutations in mtDNA, mtCDR and mtCTR among three tissue types. Mutation density was calculated as the average number of mutations per sample per kilobase (kb). (D) The mtDNA copy number among three tissue types. EOC, epithelial ovarian cancer; BOT, benign ovarian tumour; NOR, normal ovary; mtCTR, mtDNA control region; mtCDR, mtDNA coding region. Data were expressed as mean ± SEM. Chi‐square test was used for data analysis in (A). One‐way ANOVA with Bonferroni's post hoc test was used for data analysis in panels (B–D). *p < .05; **p < .01; ***p < .001.
FIGURE 2
FIGURE 2
EOC displayed cancer‐specific evolutionary pattern of mtDNA mutations. (A and B) Mutation density for somatic mutations in mtCDR and mtCTR in private and public cohorts. (C and D) Cumulative distributions of mtCDR and mtCTR mutations in private and public cohorts. EOC, epithelial ovarian cancer; CRC, colorectal cancer; HCC, hepatocellular cancer; mtCDR, mtDNA coding region; mtCTR, mtDNA control region. Chi‐square test was used for data analysis in panels (A and B). Kolmogorov–Smirnov test was used for data analysis in panels (C and D). *p < .05; **p < .01; ***p < .001.
FIGURE 3
FIGURE 3
Mutations in mtCTR non‐HVS region were subjected to much strict negative selection in EOC. (A and B) Mutation density of mtCTR non‐HVS and HVS regions in private and public cohorts. © The proportion of somatic mutations in mtCTR non‐HVS and HVS regions for private and public cohorts. The value 27.54 of vertical dashed line indicated the length percentage of non‐HVS segment in mtCTR, which was used to represent possible percentage of non‐HVS mutations in mtCTR mutations when evolutionary selection is neutral. Mutation number in non‐HVS and HVS regions was shown in brackets. EOC, epithelial ovarian cancer; CRC, colorectal cancer; HCC, hepatocellular cancer; HVS, hypervariable region; mtCTR, mtDNA control region. Chi‐square test was used for data analysis in panels (A and B). *p < .05; **p < .01; ***p < .001.
FIGURE 4
FIGURE 4
Mutations in mtDNA protein‐coding region presented complex‐specific evolutionary pattern in EOC. (A) Mutation density of mtDNA encoding‐mitochondrial respiration complexes (Com I, Com III, Com IV and Com V) in private and public EOC cohorts, presented in descending order, from the highest to the lowest. (B) The percentage of somatic mutations with different pathogenicity in mtDNA encoding‐mitochondrial complexes. (C) The heteroplasmic level of nonsynonymous somatic mutations in mtDNA encoding‐mitochondrial complexes. (D) Density of truncating mutations in mtDNA encoding‐mitochondrial respiration complexes. (E) The heteroplasmic level of nonsynonymous and synonymous somatic mutations in mtDNA encoding‐mitochondrial complexes. Mutation density of each complex was standardised based on the correlation of the mutation density of CH > TH with the DssH as previously described. Somatic mutations in mtDNA encoding‐mitochondrial complexes of private and public EOC cohorts were combined. EOC, epithelial ovarian cancer. Data were expressed as mean ± SEM. One‐way ANOVA with Bonferroni's post hoc test was used for data analysis in panels (A–C). The Mann–Whitney U test was used for data analysis in panel (E). *p < .05; **p < .01; ***p < .001.
FIGURE 5
FIGURE 5
Mutations in mtDNA tRNA were prone to region‐specific evolutionary selection in EOC. (A) Diagram of tRNA functional units. (B and C) Mutation density and heteroplasmic level of somatic mutations in mitochondrial tRNA stem (n = 55) and non‐stem regions (n = 16, loop and variable region) in combined EOC cohort. (D) Percentage of benign and deleterious mutations in mitochondrial tRNA stem and non‐stem regions. Somatic mutations in mitochondrial tRNAs coding regions of private (n = 37) and public (n = 34) EOC cohorts were combined. Data were expressed as mean ± SEM. Chi‐square test was used for data analysis in (B) and (D). The Mann–Whitney U test was used for data analysis in panel (C). *p < .05; **p < .01; ***p < .001.
FIGURE 6
FIGURE 6
EOC showed much active mitochondrial biogenesis. (A) NGS‐based analysis of mtDNA copy number in paired EOC (n = 150) and NOR (n = 150) tissues in private EOC cohort 2. (B) Expression of TFAM and TOMM20 mRNA in OC (n = 427) and NOR (n = 88) tissues based on RNA‐seq counts retrieved from TCGA and GTEx database, respectively. (C) Spearman correlation analysis between the level of TFAM and TOMM20 mRNA expression in OC (n = 427) tissues based on RNA‐seq counts retrieved from TCGA. (D) qRT‐PCR analyses for TFAM and TOMM20 mRNA expression in EOC tissues (n = 89) from private EOC cohort 1 and NOR tissues (n = 46) from private cohort without ovary disease. (E) Representative immunohistochemistry (IHC) staining images and quantification of mitochondrial TFAM and TOMM20 in EOC tissues (n = 89) from private EOC cohort 1 and NOR tissues (n = 46) from private cohort without ovary disease. Scale bars: 25 μm. (F) Protein expression of TFAM and TOMM20 in OC (n = 100) and NOR (n = 25) tissues based on mass spectrometry data from the Clinical Proteomic Tumour Analysis Consortium (CPTAC). Protein expression values downloaded from the CPTAC data portal were log2 normalised in each sample. Then a Z‐value for each sample for each protein was calculated as standard deviations from the median across samples. (G) Distributions of mtDNA copy number by cancer tissue type in private and public cohorts. (H) Expression of TFAM and TOMM20 mRNA by cancer tissue type based on RNA‐seq counts retrieved from TCGA database. EOC, epithelial ovarian cancer; NOR, normal ovary; BLCA, bladder urothelial carcinoma; CESC, cervical squamous cell carcinoma and endocervical adenocarcinoma; COAD, Colon Cancer; CRC, colorectal cancer; HCC, hepatocellular cancer; HNSC, head and neck squamous cell carcinoma; READ, Rectal Cancer; SARC, Sarcoma. Data were expressed as mean ± SEM. The Mann–Whitney U test was used for data analysis in (A), (B), (D) and (F). The Student's t‐test was used for data analysis in panel (E). One‐way ANOVA with Bonferroni's post hoc test was used for data analysis in panel (G). *p < .05; **p < .01; ***p < .001.
FIGURE 7
FIGURE 7
MtDNA mutations was notably associated with mitochondrial biogenesis and clinical outcome of EOC. (A and B) Comparison of mtDNA copy number between patients with and without mtDNA mutations, patients with and without protein‐coding mutations, patients with and without nonsynonymous mutations, patients with and without high VAF mutations, patients with and without high VAF nonsynonymous mutations, patients with and without mtCTR mutations, and patients with and without tRNA mutations in private (A) and public (B) EOC cohorts. (C and D) Kaplan–Meier curve analysis of overall survival (OS) between patients with and without HVS mutations, patients with and without high VAF mutations, patients with and without high VAF nonsynonymous mutations and patients with and without rRNA mutations in private (C) and public (D) EOC cohorts. Mutations with VAF higher than 50% were defined as high VAF mutations. VAF, variant allele frequency; Nonsyn muts, nonsynonymous mutations; mtCTR, mtDNA control region. Com I, mitochondrial complex I. The Mann–Whitney U test was used for data analysis in panel (A and B). *p < .05; **p < .01.

Similar articles

Cited by

References

    1. Sainero‐Alcolado L, Liaño‐Pons J, Ruiz‐Pérez MV, Arsenian‐Henriksson M. Targeting mitochondrial metabolism for precision medicine in cancer. Cell Death Differ. 2022;29(7):1304‐1317. doi:10.1038/s41418-022-01022-y - DOI - PMC - PubMed
    1. Hanahan D, Weinberg RA. Hallmarks of cancer: the next generation. Cell. 2011;144(5):646‐674. doi:10.1016/j.cell.2011.02.013 - DOI - PubMed
    1. Yang Y, He J, Zhang B, et al. SLC25A1 promotes tumor growth and survival by reprogramming energy metabolism in colorectal cancer. Cell Death Dis. 2021;12(12):1108. doi:10.1038/s41419-021-04411-2 - DOI - PMC - PubMed
    1. Wu Y, Zhang X, Wang Z, Zheng W, Cao H, Shen W. Targeting oxidative phosphorylation as an approach for the treatment of ovarian cancer. Front Oncol. 2022;12:971479. doi:10.3389/fonc.2022.971479 - DOI - PMC - PubMed
    1. Wang Y, Xie H, Chang X, et al. Single‐cell dissection of the multiomic landscape of high‐grade serous ovarian cancer. Cancer Res. 2022;82(21):3903‐3916. doi:10.1158/0008-5472.Can-21-3819 - DOI - PMC - PubMed

Publication types

Substances