. 2024 Feb 13;92(2):e0050423.
doi: 10.1128/iai.00504-23. Epub 2024 Jan 9.

IFN-λ3 is induced by Leishmania donovani and can inhibit parasite growth in cell line models but not in the mouse model, while it shows a significant association with leishmaniasis in humans

Affiliations

IFN-λ3 is induced by Leishmania donovani and can inhibit parasite growth in cell line models but not in the mouse model, while it shows a significant association with leishmaniasis in humans

Manjarika De et al. Infect Immun. .

Abstract

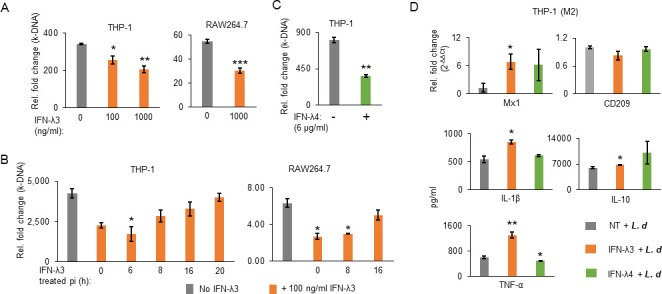
The intracellular protozoan parasite Leishmania donovani causes debilitating human diseases that involve visceral and dermal manifestations. Type 3 interferons (IFNs), also referred to as lambda IFNs (IFNL, IFN-L, or IFN-λ), are known to play protective roles against intracellular pathogens at the epithelial surfaces. Herein, we show that L. donovani induces IFN-λ3 in human as well as mouse cell line-derived macrophages. Interestingly, IFN-λ3 treatment significantly decreased parasite load in infected cells, mainly by increasing reactive oxygen species production. Microscopic examination showed that IFN-λ3 inhibited uptake but not replication, while the phagocytic ability of the cells was not affected. This was confirmed by experiments that showed that IFN-λ3 could decrease parasite load only when added to the medium at earlier time points, either during or soon after parasite uptake, but had no effect on parasite load when added at 24 h post-infection, suggesting that an early event during parasite uptake was targeted. Furthermore, the parasites could overcome the inhibitory effect of IFN-λ3, which was added at earlier time points, within 2-3 days post-infection. BALB/c mice treated with IFN-λ3 before infection led to a significant increase in expression of IL-4 and ARG1 post-infection in the spleen and liver, respectively, and to different pathological changes, especially in the liver, but not to changes in parasite load. Treatment with IFN-λ3 during infection did not decrease the parasite load in the spleen either. However, IFN-λ3 was significantly increased in the sera of visceral leishmaniasis patients, and the IFNL genetic variant rs12979860 was significantly associated with susceptibility to leishmaniasis.

Keywords: IFN-L3; Leishmania; Leishmania donovani; post-kala-azar dermal leishmaniasis; type III IFN; visceral leishmaniasis.


Conflict of interest statement

The authors declare no conflict of interest.

Figures

FIG 1
FIG 1
L. donovani stimulates IFNL3 expression. (A) Differentiated THP-1 cells or U937 cells were infected with L. donovani parasites for 24 h, and qPCR (using the SYBR green protocol with primers shown in Table S1) was performed to measure IFNL3 gene expression as described in the Materials and Methods. The data are from two experiments, showing the mean and SD. *P < 0.05; **P < 0.01. (B) IFNL3 expression was measured as in A, but using specific TaqMan primers and probes (Applied Biosystems) and at different time points after infection, as shown. The means of technical replicates are plotted with SD for each time point. pi, post-infection. (C and D) The mouse Ifnl3 expression was measured by qPCR after L. donovani infection in RAW264.7 cells using gene-specific TaqMan primers and probes (Applied Biosystems) in C and by ELISA in D. The data in C are from three experiments, and the data in D are from two experiments, showing the mean and SD. *P < 0.05; **P < 0.01. L. d, L. donovani.
FIG 2
FIG 2
A microscopic and molecular assay to measure parasite load. (A) Confocal microscopy images of THP-1 cell-derived macrophage-like cells infected or not with L. donovani promastigotes at the MOI shown at 100× magnification. The infection was carried out for 24 h before fixing and staining. DAPI stain was used to stain both the nuclear and parasite DNA (the pseudocolor red is shown instead of the blue color of DAPI for better visualization; laser wavelength: 405.0, power: 4.3). The arrow indicates an amastigote inside a cell. Images were obtained under the DAPI channel using the NIS-Elements Imaging software (version 5.20.00). (B) The images obtained in A were manually scanned to count the number of cells infected and the number of amastigotes/cell and plotted. Then, 100–200 cells were counted per condition. (C) Parasite count in THP-1-derived cells infected with L. donovani (L. d) or not (C, control). The Ct values obtained from qPCR carried out on DNA isolated from infected cells were compared with the same represented as a standard curve obtained from qPCR carried out on promastigote DNA that was isolated from serially diluted parasite cultures in M199 medium; from this standard curve, the parasite numbers were deduced and shown as mean and SD from two experiments. (D) A new method to estimate parasite load after normalizing for host DNA concentration. The kDNA was measured from DNA isolated from infected cells by qPCR and normalized to copies of GAPDH DNA. The mean is shown from three separate experiments along with SD. NC, no infection control. (E) RAW264.7 cells infected with L. donovani were stained with Geimsa stain for LD body counting. Images were obtained in a bright field using Cell D software at 100× magnification. The arrow indicates an amastigote inside a cell. The number of amastigotes in 100 macrophage cells was counted using oil immersion lenses. (F) Data obtained from counting cells in E are plotted, showing the mean and SD. (G) Parasite load was estimated as kDNA normalized to gapdh from two experiments (shown as mean and SD) that were performed simultaneously with those shown in E. L. d, L. donovani; NC, no infection control.
FIG 3
FIG 3
IFN-λ3 inhibits L. donovani growth in cells. (A) Human (left) or mouse(right) IFN-λ3 at the shown concentration was added along with parasites during infection, and kDNA was measured after 24 h. The data are from two experiments in THP-1-derived cells and four experiments from RAW264.7 cells, showing the mean and SD. *P < 0.05; **P < 0.01; ***P < 0.001. (B) Human (left) or mouse (right) IFN-λ3 at 100 ng/mL was added at different time points after L. donovani infection, and kDNA was measured after 24 h of infection. The data are from two experiments in both cell lines, shown as the mean and SD. *P < 0.05. (C) IFN-λ4 at 6 µg/mL was added, and the experiment was as in A showing data from two experiments with mean and SD (**P < 0.01). A high concentration of IFN-λ4 was required as the specific activity of the recombinant protein preparation is low, and 6 µg/mL would give a comparable activity to 100 ng/mL of IFN-λ3, as detailed in our previous work (16). (D) Effect of IFN-λ3 and IFN-λ4 on cytokine secretion in L. donovani infected M2-macrophage-like cells. M2 macrophages were differentiated for 2 days from THP-1 cells as described in our previous work (16), and IFN-λ3 at 1 µg/mL or IFN-λ4 at 6 µg/mL were added during parasite infection. After 24 h, the supernatants and cells were collected, and qPCR and ELISA were carried out. The data are from two experiments, showing the mean and SD. *P < 0.05; **P < 0.01. L. d, L. donovani; NT, no treatment control.
FIG 4
FIG 4
IFN-λ3 inhibits L. donovani by increasing ROS production in cells. (A) (Top) RAW264.7 cells infected with L. donovani for different time points as shown were subject to qPCR for kDNA (normalized to Gapdh) and Ifnl3 (normalized to Rps29). (Bottom) Immunoneutralization of secreted mIFN-λ3 increases parasite load. The experiment was similar to the one described in the top, except that a rat anti-mouse IFN-λ3 antibody (shown as α-mIFN-λ3) was added or not at 24 h pi, at increasing concentrations as shown (1.5, 3.0, and 4.5 µg/mL) in the medium, and kDNA copies in the cells were measured after an additional 12 h (i.e., 36 h pi) of incubation. The data from both the top and bottom are from two experiments, showing the mean and SD. *P < 0.05i, post-infection. (B) ROS levels are induced by IFN-λ3, as measured by the NBT assay. (Top) The indicated treatment (IFN-λ3, LPS, or L. d ± IFN-λ3) was for 2 h; IFN-λ3 was at 100 ng/mL and LPS was at 1 µg/mL. (Bottom) L. d infection was for indicated time points. The means from three experiments (top) and two experiments (bottom) are shown; error bars denote SD. NT, no treatment. *P < 0.05; **P < 0.001; L.D, L. donovani. (C) mIFN-λ3 increases ROS production in RAW264.7 cells in a dose-dependent manner, as measured by a fluorescence-based assay. RAW264.7 cells were incubated with the shown concentrations of mIFN-λ3 or LPS (1 µg/mL) or NAC (100 mM) + mIFN-λ3 (0.5 µg/mL) for 2 h before staining with DCFDA. The fluorescence intensity quantified is shown at the top (data from two experiments with mean and SD are depicted; *P < 0.05), and the bottom shows representative images taken at 20× magnification of the cells under the conditions shown. (D) IFN-λ3 can inhibit parasite load even when ROS production is inhibited. (top) L. donovani (L. d) infection was given in THP-1-derived cells as before for 24 h in the absence (NT, no treatment) or presence of IFN-λ3 and in the presence or absence of an increasing concentration of NAC added to the medium. The parasite load was estimated after 24 h pi. (Bottom) As in top, but the kDNA copies are shown after normalizing to NT and NAC at 50 mM; data are from two experiments showing the mean and SD. **P < 0.01. (E) (Top) THP-1 cells were pretreated with 50 ng/mL of IFN-λ3 for 48 h (incubated along with PMA), and then the media was removed and L. donovani (L. d) or mock infection (1:10 MOI) was given for 2 h. ROS levels were measured by the NBT assay. Data from two experiments with mean and SD are shown. *P < 0.05. NT, no treatment. (Bottom) kDNA levels shown in THP-1 cells that were pretreated with 100 ng/mL IFN-λ3 or not (incubated along with PMA for 48 h) were washed off the media and infected or not with L. donovani for 24 h, and kDNA was measured by qPCR as before. The data are from two experiments, showing the mean and SD. Similar experiments with IFN-λ4 are shown in Fig. S2B.
FIG 5
FIG 5
IFN-λ3 targets an early event in parasite uptake. (A) IFN-λ3 at the indicated doses (the color key for the doses shown is the same for A, B, and C) were incubated along with the promastigotes, and slides were stained with DAPI, and the amastigotes presence and numbers were manually counted. The data are from three (for no treatment) and four (for IFN-λ3 treatment) independent experiments, each with 100–200 individual cells shown as the mean and SD. *P < 0.05. (B) (Left) Fluorescence microscope image of THP-1-derived cells incubated with CFSE-stained heat-killed L. donovani showing different stains. The arrow indicates a parasite taken up by the cell by phagocytosis. (Right) Manual counting of the parasite inside the cells and numbers was done as above and plotted. The data are from four independent experiments, each involving 100 to 200 individual cells, showing the mean and SD. For B and C, live parasites inside the cells were observed with the DAPI channel, while heat-killed parasites were observed under the GFP channel. Images were obtained under DAPI (imparts red pseudocolor), GFP (green), and Texas Red (imparts gray pseudocolor). (C) (Top) Fluorescence microscopic image of THP-1-derived macrophage-like cells that have taken up zymosan in a phagocytosis assay as described in the Materials and Methods; images were obtained under DAPI (imparts red pseudocolor), GFP (green), and Brightfield. The arrow indicates zymosan inside a cell. (Bottom) Manual counting of the cells with zymosan was performed as in B and plotted. The data are from two separate experiments with ~250 cells in each, showing the mean and SD. For B and C, image analysis was done using Leica Application Suite X software (version 3.7.2.22383) at 100× magnification. (D) Schematic representation of an experimental design with five (I-V) strategies. L donovani (L. d) infection (downward arrow) was given at 1:20 MOI for only 6 h, after which the uninfected promastigotes were removed after rigorous washing with PBS. IFN-λ3 treatment (inverted dark triangle) was given at the depicted time points, and after the indicated incubation periods, cells were collected and quantified for kDNA copies by qPCR (downward arrow with round head). (E and F). IFN-λ3 targets an early event during parasite uptake. Experiments as designed in the schematic representation shown in D were carried out, and results are presented in E (strategies I-IV) for 24 (E, top), 48 (E, middle), or 72 h pi (E, bottom) and F (strategies I for 48 h pi and V). 1:10 MOI and continuous infection conditions as described for previous experiments were also carried out, but the incubation periods included 48 and 72 h pi along with 24 h pi (shown in E middle, bottom, and top, respectively). qPCR was performed to estimate kDNA copies and ISG expression. The kDNA copies were normalized to NT (no IFN-λ3 treatment) and shown in E, while the actual fold changes are shown in F. The data in both E and F are from two experiments showing the mean and SD. *P < 0.05; **P < 0.01. The data shown in E are also shown with actual fold changes and without normalization to NT control samples in Fig. S2E and F.
FIG 6
FIG 6
IFN-λ3 before infection fails to inhibit parasite load in the mouse model of VL. (A) and (B) Gene expression changes measured by qPCR from mice spleen (A) or liver (B) pretreated with 4 µg/mouse of mIFN-λ3 or PBS 18 h before infection with L. donovani. The infection was allowed for 6 weeks, and gene expression was quantified using primers listed in Table S1 and SYBR green (Applied Biosystems) protocol. kDNA was also measured and normalized using the 2−∆∆Ct method. Six female mice were used in each group, and 18 data points are shown for the six samples carried out in technical triplicate. The statistical significance, however, was calculated with n = 6 by considering the average of the technical triplicates for each animal as the actual value for that animal. **P < 0.01. No significant differences were observed in the body weight and organ weights for the two groups.
FIG 7
FIG 7
IFN-λ3 treatment before infection (18 h) causes distinct pathological changes in the liver of treated mice post-infection. (A) H&E-stained liver sections are shown for the 12 animals (six in each group) pretreated with PBS or 4 µg/mouse of mIFN-λ3. (B) A summary of the histopathological findings from A. Trained personnel were asked to score for each pathological feature after blinding the slide information. The data were scored first, and then the identities of the slides were revealed to the personnel, after which the summary table was made. (C) IL-10 is increased at a marginal significance level (P = 0.06) in the serum of mIFN-λ3-treated mice. The sera from mice described in Fig. 6 were subjected to ELISA for the three mouse cytokines shown.
FIG 8
FIG 8
IFN-λ3 treatment during infection fails to inhibit parasite load in the mouse model of VL. (A) Liver and spleens of the mice treated with PBS or 4 µg/mouse of mIFN-λ3 (in two doses of 2 µg/mouse in each dose given 24 h apart) at 12 weeks of infection were collected and weighed before subjecting them to qPCR for kDNA (liver and spleen) and other genes (spleen only). Each group had six animals (n = 6); 18 data points are shown for the six samples carried out in technical triplicates for qPCR data. The statistical significance, however, was calculated with n = 6 by considering the average of the technical triplicates for each animal as the actual value for that animal; for the organ weights, single measurements were taken for each organ belonging to each animal. *P < 0.01. (B) The sera from mice were subjected to ELISA for the three mouse cytokines shown.
FIG 9
FIG 9
Leishmaniasis is significantly associated with IFN-λ3 in humans. (A) Serum IFN-λ3 levels in VL patients are strongly upregulated compared to patient controls. A highly significant difference is seen between the IFN-λ3 serum levels of VL patients and healthy controls. The mean and SD values for the two groups are shown: ****P < 0.0001. A two-sample t-test gave a P-value of 1.981 × 10−05; however, the variances were significantly different between the two groups (P = 0.02, F-test), and the test for normality (Kolmogorov-Smirnov test) gave a highly significant P-value (P < 2.2 × 10⁻¹⁶), suggesting the non-normal distribution of data. Hence, we also tested the significance using the Wilcoxon rank sum test with continuity correction; this test also showed a highly significant association (P = 1.337 × 10⁻¹¹). (B) The IFNL SNP rs12979860 significantly associates with leishmaniasis (both VL, visceral leishmaniasis and PKDL, post-kala-azar dermal leishmaniasis; all PKDL patients had recovered from VL) in humans; the complete details of the patients recruited for the study are given in Suppl. Data. % data are rounded off to the closest whole number; HWE, Hardy-Weinberg equilibrium; MAF, minor allele frequency; CI, confidence interval. All tests were carried out using RStudio 4.1.0.

Similar articles

Cited by

References

    1. Torres-Guerrero E, Quintanilla-Cedillo MR, Ruiz-Esmenjaud J, Arenas R. 2017. Leishmaniasis: a review. F1000Res 6:750. doi:10.12688/f1000research.11120.1 - DOI - PMC - PubMed
    1. Muniaraj M. 2014. The lost hope of elimination of kala-Azar (visceral Leishmaniasis) by 2010 and cyclic occurrence of its outbreak in India, blame falls on vector control practices or co-infection with human immunodeficiency virus or therapeutic modalities? Trop Parasitol 4:10–19. doi:10.4103/2229-5070.129143 - DOI - PMC - PubMed
    1. Regli IB, Passelli K, Hurrell BP, Tacchini-Cottier F. 2017. Survival mechanisms used by some leishmania species to escape neutrophil killing. Front Immunol 8:1558. doi:10.3389/fimmu.2017.01558 - DOI - PMC - PubMed
    1. Liu D, Uzonna JE. 2012. The early interaction of leishmania with macrophages and dendritic cells and its influence on the host immune response. Front Cell Infect Microbiol 2:83. doi:10.3389/fcimb.2012.00083 - DOI - PMC - PubMed
    1. Loría-Cervera EN, Andrade-Narváez FJ. 2014. Animal models for the study of leishmaniasis immunology. Rev Inst Med Trop Sao Paulo 56:1–11. doi:10.1590/S0036-46652014000100001 - DOI - PMC - PubMed

Publication types

Substances