. 2024 Jan 16;121(3):e2307776121.
doi: 10.1073/pnas.2307776121. Epub 2024 Jan 9.

A structurally precise mechanism links an epilepsy-associated KCNC2 potassium channel mutation to interneuron dysfunction

Affiliations

A structurally precise mechanism links an epilepsy-associated KCNC2 potassium channel mutation to interneuron dysfunction

Jerome Clatot et al. Proc Natl Acad Sci U S A. .

Abstract

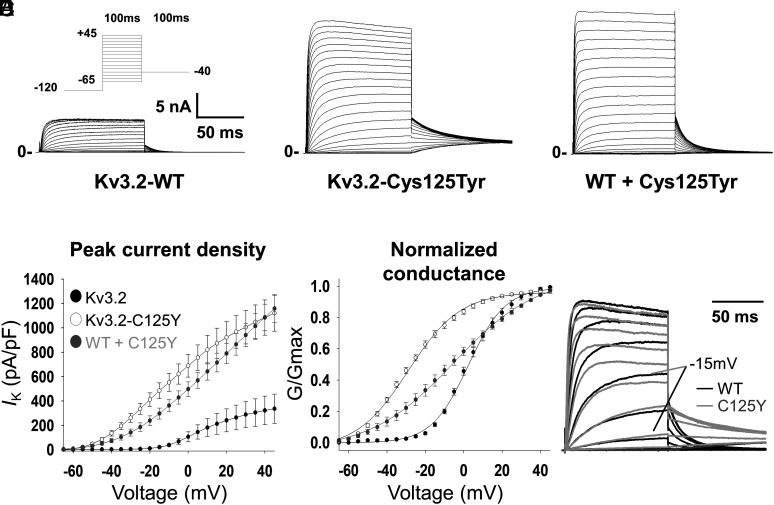
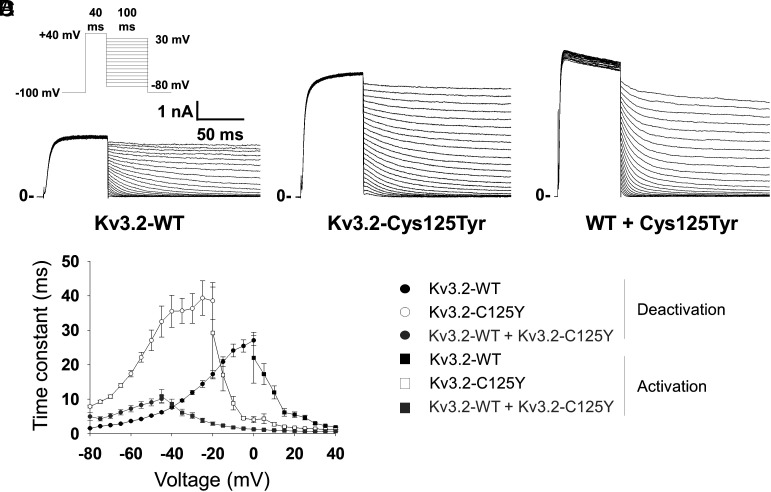
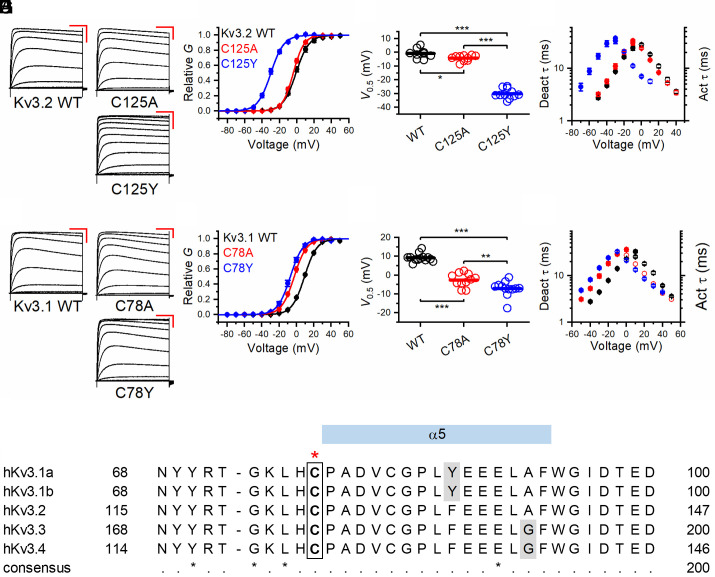
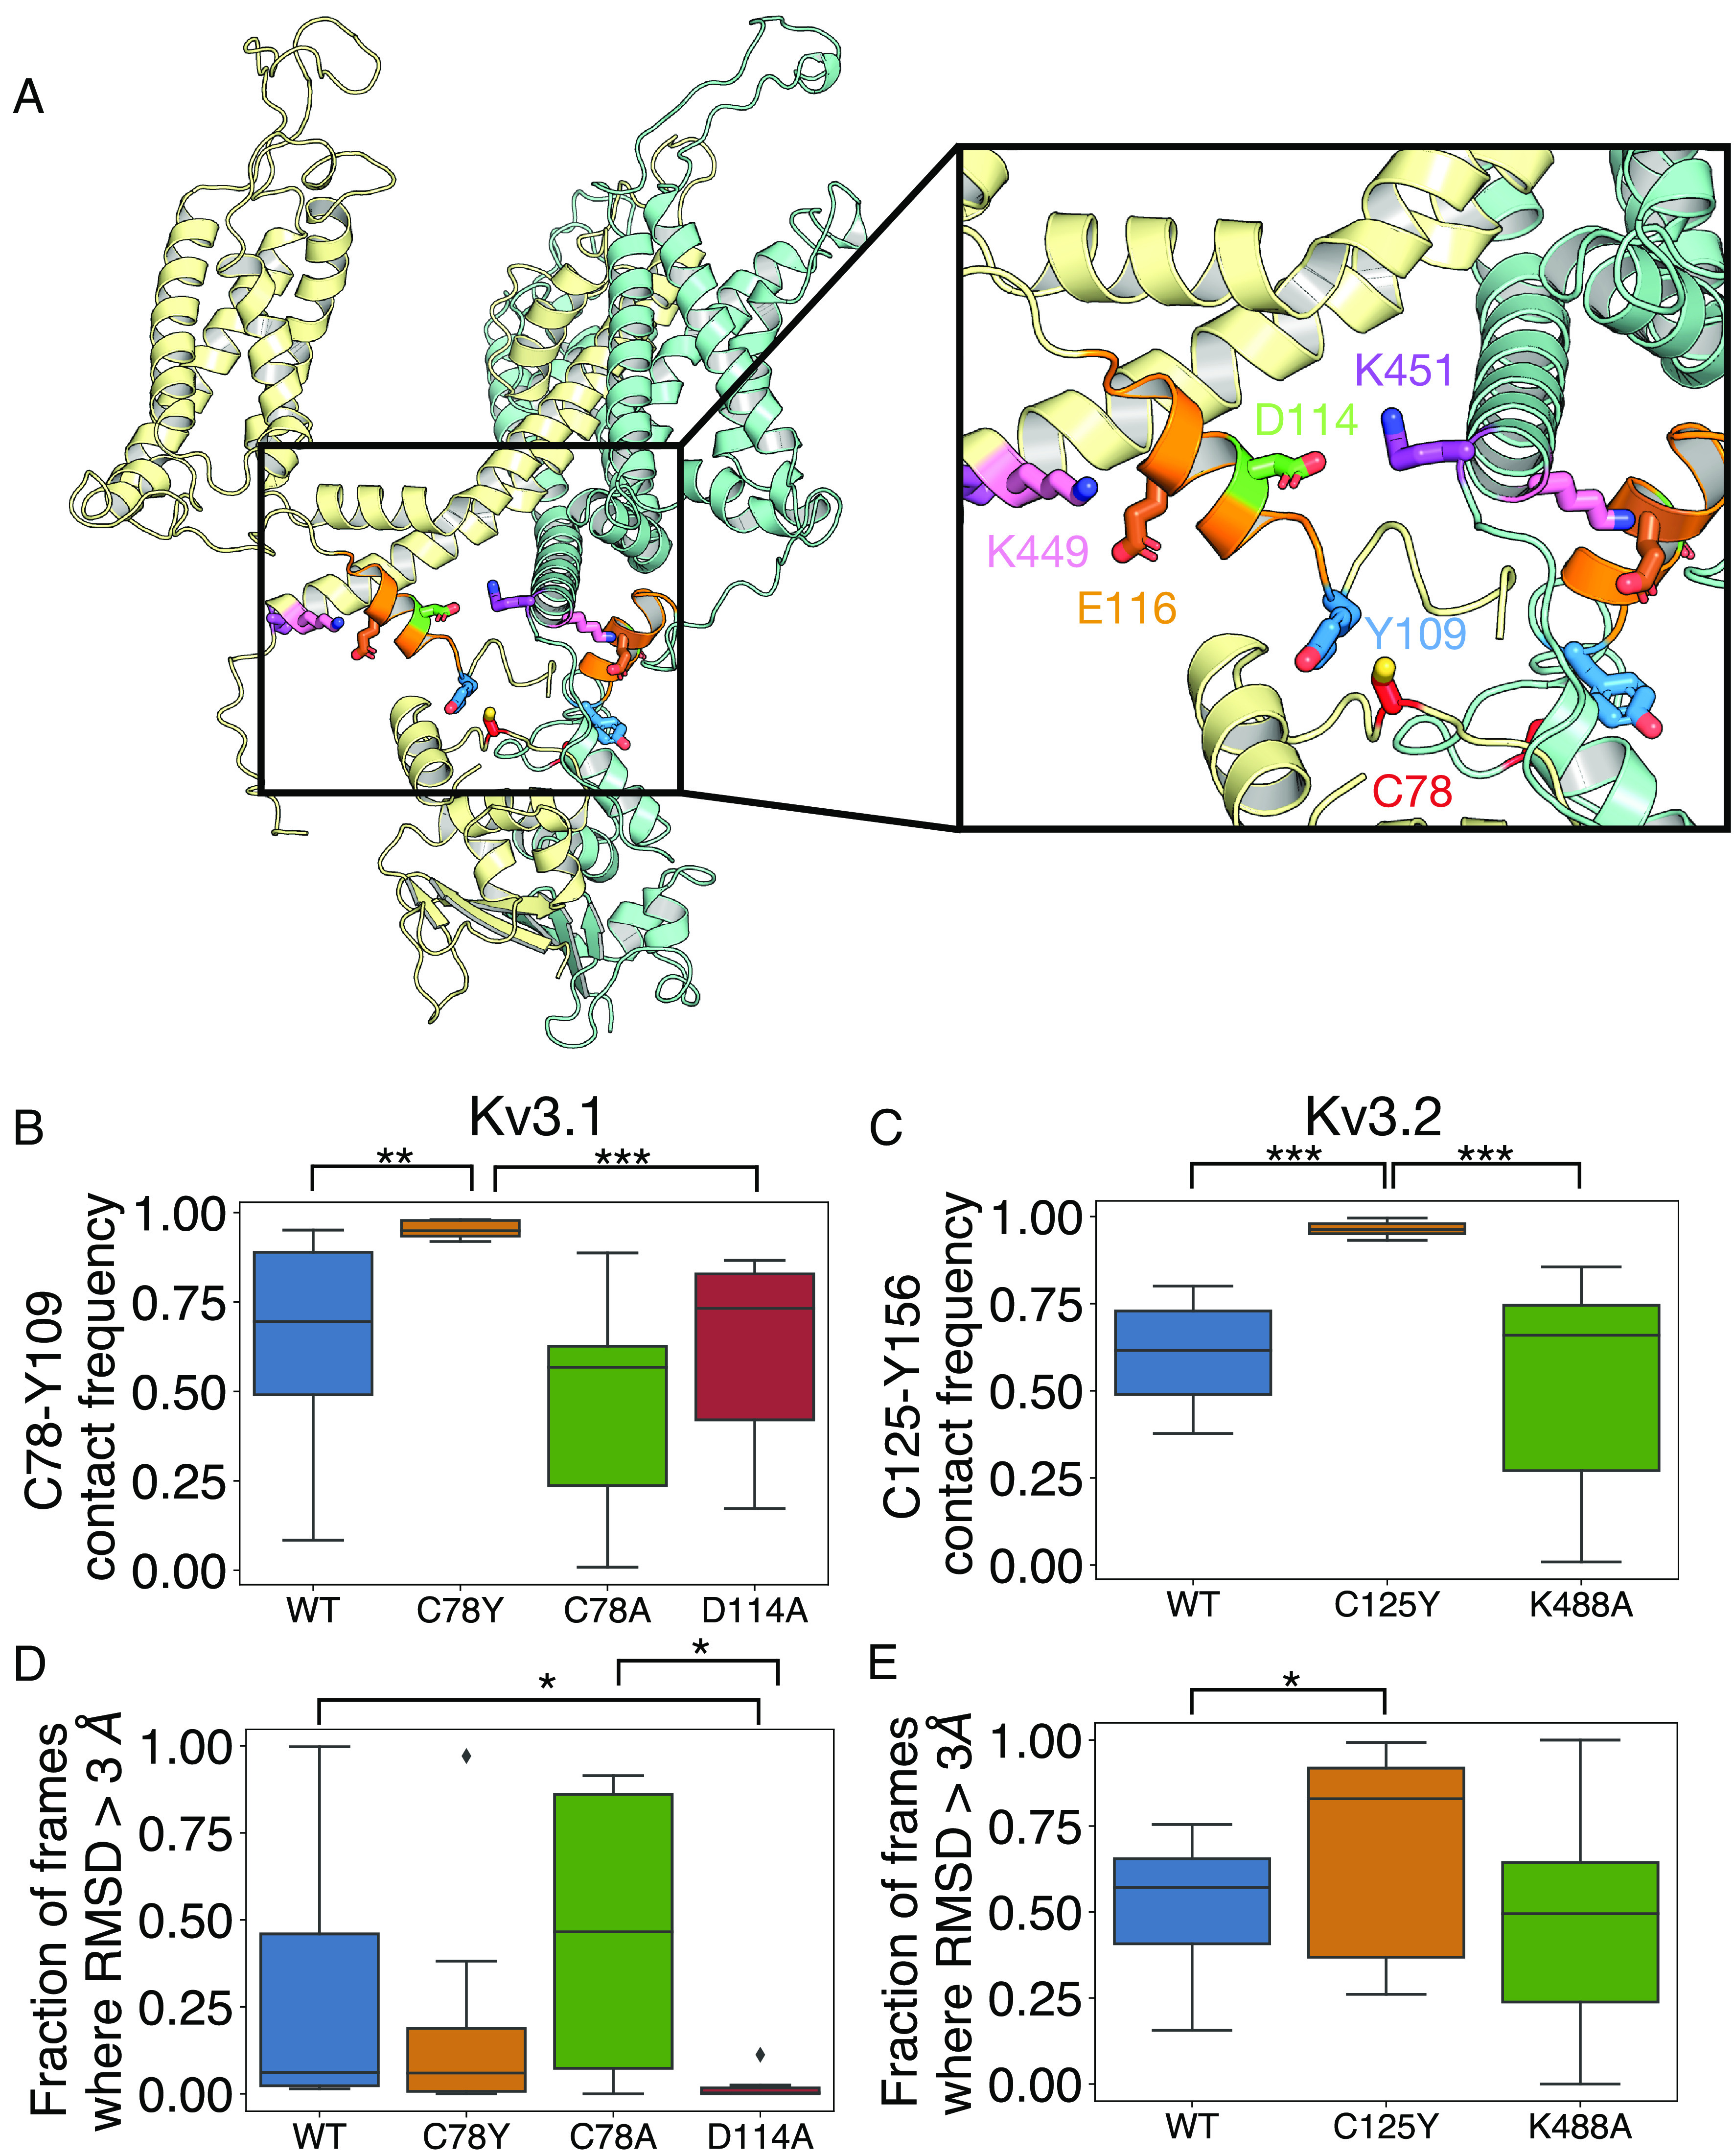
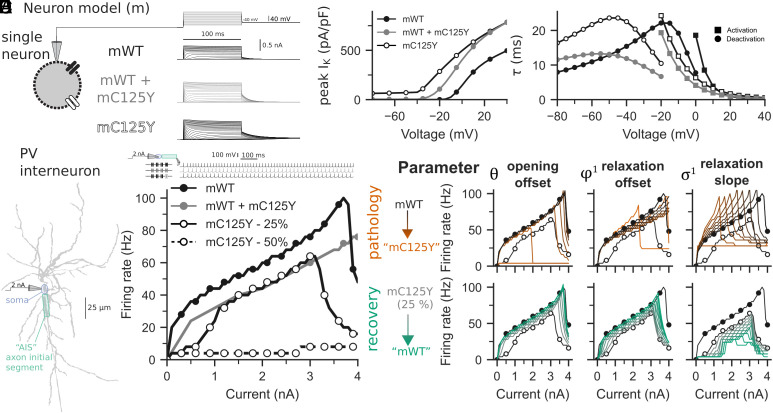
De novo heterozygous variants in KCNC2 encoding the voltage-gated potassium (K+) channel subunit Kv3.2 are a recently described cause of developmental and epileptic encephalopathy (DEE). A de novo variant in KCNC2 c.374G > A (p.Cys125Tyr) was identified via exome sequencing in a patient with DEE. Relative to wild-type Kv3.2, Kv3.2-p.Cys125Tyr induces K+ currents exhibiting a large hyperpolarizing shift in the voltage dependence of activation, accelerated activation, and delayed deactivation consistent with a relative stabilization of the open conformation, along with increased current density. Leveraging the cryogenic electron microscopy (cryo-EM) structure of Kv3.1, molecular dynamic simulations suggest that a strong π-π stacking interaction between the variant Tyr125 and Tyr156 in the α-6 helix of the T1 domain promotes a relative stabilization of the open conformation of the channel, which underlies the observed gain of function. A multicompartment computational model of a Kv3-expressing parvalbumin-positive cerebral cortex fast-spiking γ-aminobutyric acidergic (GABAergic) interneuron (PV-IN) demonstrates how the Kv3.2-Cys125Tyr variant impairs neuronal excitability and dysregulates inhibition in cerebral cortex circuits to explain the resulting epilepsy.

Keywords: KCNC2; Kv3.2; epilepsy; neurogenetics; potassium channels.


Conflict of interest statement

Competing interests statement:The authors declare no competing interest.

Figures

Fig. 1.
Fig. 1.
Electrophysiological properties of Kv3.2 and the epilepsy-associated Kv3.2-Cys125Tyr variant in a heterologous system. (A) Representative trace for wild-type Kv3.2 (Kv3.2-WT), which gives rise to a delayed rectifier type K+ current in a heterologous cell system. The epilepsy-associated variant Kv3.2-Cys125Tyr (B) and coexpressed WT + Kv3.2-Cys125Tyr variant exhibit a dramatic increase in peak current density (C). (D) Plot of current density (in pA/pF) vs. voltage illustrates the left shift in voltage dependence of activation and increased current density of Kv3.2-Cys125Tyr and WT + Kv3.2-Cys125Tyr relative to WT alone. (E) Leftward (hyperpolarized) shift in the conductance-voltage (G/Gmax) curve for Kv3.2-Cys125Tyr compared to WT. (F) Superimposed representative traces for WT and Kv3.2-Cys125Tyr variant illustrate accelerated activation kinetics for the Cys125Tyr variant relative to WT, with the response to a voltage step to −15 mV highlighted for clarity. Closed circles/bars indicate Kv3.2-WT; open circles/bars indicate Kv3.2-Cys125Tyr; gray circles/bars indicate Kv3.2-WT + Kv3.2-Cys125Tyr. n = 12 to 28 cells per genotype from N = 4 or more separate transfections. ***P < 0.001 via one-way ANOVA.
Fig. 2.
Fig. 2.
Altered gating kinetics associated with the KCNC2-p.Cys125Tyr variant. (A) Example trace with protocol (Inset) illustrating the recording of the kinetics of deactivation for WT Kv3.2. (B) Deactivation of Kv3.2-Cys125Tyr. (C) Deactivation of WT + variant Kv3.2-Cys125Tyr. (D) Summary data showing accelerated activation (from the data in Fig. 1) and slowed deactivation for Kv3.2-Cys125Tyr and WT + Kv3.2-Cys125Tyr relative to WT alone. Circles indicate deactivation, while squares indicate activation; closed symbols indicate WT, open symbols indicate Kv3.2-Cys125Tyr, and gray symbols indicate WT + Kv3.2-Cys125Tyr. Data are from n = 12 to 28 cells per genotype from N = 4 or more separate transfections.
Fig. 3.
Fig. 3.
Voltage-dependent gating and kinetics of Kv3.2 variants C125A and C125Y and Kv3.1 variants Cys78Ala and Cys78Tyr. (A) Families of whole-oocyte currents of Kv3.2 WT, Cys125Ala (C125A), and Cys125Tyr (C125Y). Currents were evoked by step depolarizations from a holding voltage of −100 mV. The steps were delivered at 10-s intervals in increments of 10 mV. The scale bars are 100 ms and 1 µA, respectively. (B) Normalized peak G-V relations of the indicated Kv3.2 variants. The solid lines represent best-fit first-order Boltzmann functions. (C) Scatter plots of the midpoint voltage (V1/2) determined from the peak G-V relations for the indicated Kv3.2 variants. The horizontal line indicates the mean value. (D) Voltage dependence of the time constants of deactivation (filled symbols) and activation (hollow symbols) for the indicated Kv3.2 variants. (E) Families of whole-oocyte currents of Kv3.1 WT, Cys78Ala, and Cys78Tyr. The protocol and scale bars are as indicated in A. (F) Normalized peak G-V relations of the indicated Kv3.1 variants. The solid lines through the symbols represent best-fit first-order Boltzmann functions. (G) Scatter plots of the midpoint voltage (V1/2) determined from the peak G-V relations for the indicated Kv3.1 variants. The horizontal line indicates the mean value. (H) Voltage dependence of the time constants of deactivation (filled symbols) and activation (hollow symbols) for the indicated Kv3.1 variants. (I) Sequence alignment of human Kv3 family members around the indicated cysteine residue (in the box and highlighted above by the red star). All amino acids are invariant except those indicated by gray shading (which have high sequence conservation). *P < 0.05, **P < 0.01, and ***P < 0.001 via one-way ANOVA.
Fig. 4.
Fig. 4.
Interactions around Kv3.1-Cys78, the paralogue to Kv3.2-Cys125. (A) Shown is a cartoon representation of the structure of K3.1, with only two adjacent subunits (yellow and teal) included for clarity. Key interacting residues Cys78 (C78, red), Tyr109 (Y109, blue), Asp114 (D114, green), Glu116 (E116, brown), Lys449 (K449, pink), and Lys451 (K451, purple) are shown as sticks. The alpha-6 helical region (residues 110 to 20) is shown in orange. (BE) Box plot representation of distributions where the box represents the interquartile range (IQR) and the whisker shows the range of data within 1.5× of the IQR. Data beyond 1.5× of the IQR are shown as the diamond. All data were collected on the last 500 ns of the simulations. (B) The fraction of frames where Cys78 (C78Y) is within 3 Å proximity to Tyr109 on Kv3.1. (C) The fraction of frames where Cys125 (C125Y) is within 3 Å proximity to Tyr156 on Kv3.2 over the last 600 ns of the simulation (n = 8). (D and E) The fraction of frames where the rmsd of the C-alpha atoms of the alpha-6 helix is greater than 3 Å. *P < 0.05; **P < 0.01; and ***P < 0.001; via the Mann–Whitney U test.
Fig. 5.
Fig. 5.
A detailed PV interneuron biophysical model including WT and variant Kv3.2 reveals loss of interneuron function with expression of the Kv3.2-Cys125Tyr variant. (A) A single-compartment neuron model with either WT-like (mWT; black) or C125Y-like (mCys125Tyr; gray) Kv3.2 channels in voltage clamp (Top), showing corresponding K+ currents. (B) The Kv3.2 channel kinetics were fitted to experimental recordings in Figs. 2 and 3, with peak current density (Left), τ of activation (circles), and deactivation (squares) plotted. (C) A multicompartment morphologically realistic model of parvalbumin-positive (PV+) interneuron (PV-IN) with Kv3.2 channels. Current was injected at the soma, and the membrane potential was recorded at the axon initial segment (AIS). (D) F-I curves for mWT (solid black), heteromultimers of mWT and the mCys125Tyr variant (solid gray), and mixtures of mWT and mCys125Tyr variants (25% variant, open circles with solid line; 50% variant, open circles with dashed line). (E) The parameters controlling opening offset (Left), relaxation offset (Middle), and relaxation slope (Right) were primary factors in the F-I curve dysfunction for mCys125Tyr. The Top row shows the change in a parameter of the mWT for it to be more like the mCys125Tyr variant (“pathology,” orange), and the Bottom row represents adjusting a parameter in the mCys125Tyr variant to be more like mWT (“recovery,” green). Parameter values were evenly spaced between mWT and mCys125Tyr.

References

    1. Jan L. Y., Jan Y. N., Voltage-gated potassium channels and the diversity of electrical signalling. J. Physiol. 590, 2591–2599 (2012). - PMC - PubMed
    1. Gutman G. A., et al. , International union of pharmacology. XLI. Compendium of voltage-gated ion channels: Potassium channels. Pharmacol. Rev. 55, 583–586 (2003). - PubMed
    1. Lindy A. S., et al. , Diagnostic outcomes for genetic testing of 70 genes in 8565 patients with epilepsy and neurodevelopmental disorders. Epilepsia 59, 1062–1071 (2018). - PubMed
    1. Kaczmarek L. K., Zhang Y., Kv3 channels: Enablers of rapid firing, neurotransmitter release, and neuronal endurance. Physiol. Rev. 97, 1431–1468 (2017). - PMC - PubMed
    1. Rudy B., McBain C. J., Kv3 channels: Voltage-gated K+ channels designed for high-frequency repetitive firing. Trends Neurosci. 24, 517–526 (2001). - PubMed

Substances