. 2024 Jan 8;42(1):119-134.e12.
doi: 10.1016/j.ccell.2023.12.011.

Immune evasion of dormant disseminated tumor cells is due to their scarcity and can be overcome by T cell immunotherapies

Affiliations

Immune evasion of dormant disseminated tumor cells is due to their scarcity and can be overcome by T cell immunotherapies

Erica T Goddard et al. Cancer Cell. .

Abstract

The period between "successful" treatment of localized breast cancer and the onset of distant metastasis can last many years, representing an unexploited window to eradicate disseminated disease and prevent metastases. We find that the source of recurrence-disseminated tumor cells (DTCs) -evade endogenous immunity directed against tumor neoantigens. Although DTCs downregulate major histocompatibility complex I, this does not preclude recognition by conventional T cells. Instead, the scarcity of interactions between two relatively rare populations-DTCs and endogenous antigen-specific T cells-underlies DTC persistence. This scarcity is overcome by any one of three immunotherapies that increase the number of tumor-specific T cells: T cell-based vaccination, or adoptive transfer of T cell receptor or chimeric antigen receptor T cells. Each approach achieves robust DTC elimination, motivating discovery of MHC-restricted and -unrestricted DTC antigens that can be targeted with T cell-based immunotherapies to eliminate the reservoir of metastasis-initiating cells in patients.

Keywords: CAR T cell; T cell; TCR T cell; breast cancer metastasis; disseminated tumor cells; immune evasion; immunotherapy; tumor dormancy; tumor microenvironment; vaccine.


Conflict of interest statement

Declaration of interests S.R.R. is a co-founder of Lyell Immunopharma, has research funding from Lyell Immunopharma, and holds equity in Lyell Immunopharma. S.R.R. has patents in the field of cellular therapy unrelated to this work licensed to Juno Therapeutics/Bristol Myers Squibb and Lyell Immunopharma. M.H.L. has served as a consultant for Scribe Biosciences, Inc. S.S. has received research funding from Lyell Immunopharma, has a patent licensed by Lyell Immunopharma, holds equity and has served as a consultant for Lyell Immunopharma outside the submitted work. J.R.V. has intellectual property unrelated to this work licensed to Lyell Immunopharma and has received research grant support form Lyell Immunopharma and Bristol Myers Squibb.

Figures
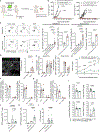
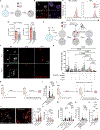
Figure 1:
Figure 1:. Dormant disseminated tumor cells persist despite robust anti-tumor immunity.
(A) Immune-competent Balb/c or immune-compromised NOD/SCID mice were orthotopicly injected with mammary tumor lines, 4TO7 or 4T1. Mice were euthanized at 50- or 100-days post-rejection for downstream analysis (created with BioRender.com). (B) Tumor volumes showing two independent models (4TO7 on left, 4T1 on right) are rejected via immune-mediated clearance. Antigen+ tumors in immune-compromised mice and antigen tumors in immune-competent mice grow unperturbed. Data shown as mean +/− SEM from n=3 (4TO7-ffluc/eGFP (NOD/SCID)), n=4 (4TO7 unlabeled (Balb/c)), n=14 (4TO7-ffluc/eGFP (Balb/c)), n=8 (4T1-ffluc/eGFP (NOD/SCID)), n=8 (4T1 ulabeled (Balb/c)), and n=19 (4T1-ffluc/eGFP (Balb/c)). Two-tailed students t-tests at study end for each mouse. (C) Representative flow cytometry gating for tetramer assessment of GFP-specific CD8+ T cells, frequencies are of total CD8+ T cells following enrichment for tetramer+ cells (left panel). Quantification of GFP-specific CD8+ T cells in the spleens and lymph nodes or bone marrow of mice at 50- or 100-days post-rejection of primary tumors (right panels; ordinary one-way ANOVA for day 50 graphs, Mann-Whitney test for day 100 graphs). Pink dots: 4TO7+ mice, red dots: 4T1+ mice. Data shown as mean +/− SEM. Day 50 Tumor Naive:GFP n=3, 4T1-Empty:GFP n=5, 4TO7/4T1-ffluc/eGFP:GFP n=8, 4TO7/4T1-ffluc/eGFP:FLU n=6. Day 100 –ctrl n=3, 4TO7/4T1-ffluc/eGFP:GFP n=7. (D) Representative image of a 4TO7-ffluc/eGFP Ki67 DTC and adjacent CD8+ T cells in a Balb/c femur (left panel) and quantification of disseminated Ki67 DTCs in femurs from mice at 100 days post-rejection of primary tumors (right panel). 4TO7-ffluc/eGFP n=6, 4T1-ffluc/eGFP n=8, Tumor naïve n=3. (E) Phenotypes of GFP-specific CD8+ T cells in spleen and lymph nodes (left) and bone marrow (right). 4T07-ffluc/eGFP n=3, 4T1-ffluc/eGFP n=5. Data shown as mean +/− SEM. (F) T cell exhaustion phenotypes of GFP-specific CD8+ T cells in spleen and lymph nodes (left: Teff/em; right: Tcm) and (G) in bone marrow (left: Teff/em; right: Tcm). 4T07-ffluc/eGFP n=3, 4T1-ffluc/eGFP n=5. Data shown as mean +/− SEM. (H) Whole body bioluminescent imaging (BLI) of tumor naïve mice or mice 50 days post-rejection of 4TO7-ffluc/eGFP orthotopic tumors, all challenged (tumor naïve) or rechallenged (4TO7 primary tumor-rejected) with a systemic intracardiac injection of 4TO7-ffluc/eGFP (Unpaired t test) Data presented as geometric mean +/− geometric SD. Dashed lines indicate background of each tissue based upon tumor naïve controls. (I) Ex vivo BLI of liver, lung, hindlimbs, and brain from systemically challenged mice. Dashed lines indicate background of each tissue based upon tumor naïve controls. Data plotted at geometric mean +/− geometric SD. Quantification of GFP-specific tetramer+ CD8+ T cells in spleen/lymph node (J) or bone marrow (K) after rechallenge (green dots) and compared to mice who rejected primary tumors but were not rechallenged (pink dots – from (C)). Controls included tumor naïve mice, ffluc/eGFP+ tumor-bearing mice assessed using an H-2Kd Influenza A virus tetramer (FLU), and empty vector+ tumor-bearing mice assessed with the H2-Kd GFP tetramer (grey dots) (ordinary one-way ANOVA; -ctrl includes tumor naïve mice and tumor+ mice assessed with the Flu tetramer). Data presented as mean +/− SEM. (L) Quantification of bone marrow DTCs in tumor naïve bones and bones from mice challenged or re-challenged with 4TO7-ffluc/eGFP via intracardiac injection. Data presented as mean +/−SEM. All statistical tests were two-tailed Mann-Whitney tests unless otherwise noted. * denotes p < 0.05, ** denotes p < 0.01, *** denotes p < 0.001, **** denotes p < 0.0001, and n.s. indicates not significant, unless otherwise noted. See also Table S1 and Figure S1.
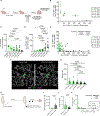
Figure 2:
Figure 2:. Dormant tumor cells exhibit reduced MHC I expression compared to metastases and proliferative tumor cells.
(A) Balb/c female mice were I.V. inoculated with 5×10⁵ D2.0R syngeneic murine mammary tumor cells engineered to express eGFP. 4 weeks post-inoculation, tumor naïve and tumor inoculated mice were sacrificed and assessed for total number of GFP-specific CD8+ T cells in spleen, lymph node and lung by staining with the H2-Kd tetramer, and for DTCs in lung. (B) Tetramer-based quantification of GFP-specific CD8+ T cells in the spleen and lymph nodes and (C) in lung 4 weeks post-injection of D2.0R-eGFP cells (Mann-Whitney test). Tumor naïve n=4, D2.0R-eGFP n=6. Data presented as mean +/− SEM. (D) Quantification of DTCs per lung from mice in (A-C) (Mann-Whitney test). Data presented as mean +/− SEM. (E) Experimental design for RNA sequencing of dormant DTCs (D2.0R-eGFP) and metastases (D2A1-eGFP) sorted from Balb/c and Athymic Nude (AtN) female mouse lungs. 2D cell culture isolates of each cell line were included for normalization purposes. (F) Frequency of indicated lesion types identified by immunofluorescent staining of murine lungs 3 weeks following intravenous inoculation of D2.0R-eGFP or D2A1-eGFP tumor cells as in (E). (G) RNA sequencing heatmaps exhibiting raw expression (normalized to gene) for comparison between D2.0R DTCs/micrometastases and D2A1 metastases sorted from Balb/c or AtN mouse lung. Datasets were assembled by literature search and included ‘antigen processing/presentation’, ‘immunosuppresive cytokines’, ‘immune checkpoints’, and ‘hypoxia’ and subsequently assessed for expression patterns from the RNA sequencing dataset. P values report significance of difference in entire gene set expression when comparing D2.0R to D2A1 independent of mouse strain. FDR reports significant differences in expression level per gene when comparing D2.0R and D2A1 independent of mouse strain. (H) MHC I fluorescent intensity of D2.0R-eGFP and D2A1-eGFP cells dissociated from Balb/c mouse lungs 1, 3, or 21 days following intravenous inoculation and compared to in vitro cultured cells as quantified by flow cytometric analysis (top), and representative histograms (bottom). Violin plots display distribution of all eGFP+CD45 tumor cells collected from n=6 experimental animals per group. In vitro samples display all cells from n=1 tissue culture harvest. Data presented as geometric mean (dashed line) and quartiles (dotted line). (I) Lung sections harboring metastases and DTCs from Balb/c mice intravenously inoculated with D2.0R-eGFP (for dormant micro-metastases and DTCs) or D2A1-eGFP (for metastases). (J) Quantification of MHC I fluorescent intensity on tumor cells quantified by immunofluorescent staining as in (I). Data displayed per cell with mean (black line) from D2.0R DTC n=24, D2.0R Micromet n=13, D2A1Met n=75. All statistical tests were ordinary one-way ANOVA unless otherwise noted. * denotes p < 0.05, ** denotes p < 0.01, *** denotes p < 0.001, **** denotes p < 0.0001, and n.s. indicates not significant, unless otherwise noted. (A) and (E) created with Biorender.com. See also Table S1 and Figure S2
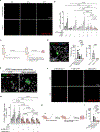
Figure 3:
Figure 3:. Class I restricted TCR T cells robustly eliminate disseminated tumor cells irrespective of their MHC I levels.
(A) Organotypic bone marrow microvascular niche co-culture model. Mesenchymal stem cells (MSC) and human umbilical vein endothelial cells (HUVEC) are cultured for 10 days followed by addition of human breast cancer cells and a laminin-rich ECM drip. For these experiments, co-cultures were subsequently dissociated and stained with Ki67 to identify proliferative and dormant cells. (B) Representative images of T4–2 human breast cancer cells grown on MSC niches (top panels) or MSC + HUVEC niches (bottom panels). T4–2 cells are marked by YFP expression and HUVECs are marked by mCherry expression (left panels). (C) Representative flow cytometry histogram for HLA-A2 on Ki67 (dormant) and Ki67+ (proliferative) T4–2 human breast cancer cells cultured on MSC + HUVEC niches (left panel) or MSC alone niches (right panel). (D) Quantification of mean fluorescence intensity (MFI) of HLA-A2 on Ki67 and Ki67+ populations dissociated from MSC + HUVEC niches (left panel) and MSC alone niches (right panel) from n=5 independent experiments; paired t test. Data presented as mean +/− SD. (E) Schematic of the organotypic bone marrow microvascular niche co-culture model used to test engineered T cell treatment. MSCs are seeded alone or in conjunction with HUVEC (to create dormancy supportive MVNs) and 10 days after tumor cell seeding engineered T cells labeled with CellTrace Violet are added. Cultures are imaged throughout the experiment. (F) Representative images of organotypic co-cultures seeded with NY-ESO-1+ T4–2 tumor cells cells at day 0 (D0, day of T4–2 seeding), day 10 (D10, 10 days post-tumor seeding & day of T cell seeding) and day 17 (D17, end of experiment). Tumor cells are red. For TCR T cell experiments, the treatment control was addition of no T cells. (G) Tumor cell area as measured by GFP area, representing T4–2 breast cancer cells. T4–2 cells are negative or positive for the NY-ESO-1 antigen and are treated with TCR T cells engineered to target NY-ESO-1 peptide presented on HLA-A2, treatment control wells are untreated (microvascular niche (MVN). Bars represent average +/− SD in tumor cell area per well at D10, D12, D14, and D17 of the experiment; n=4 experiments with 3 technical replicates each. Data were analyzed by student’s t-tests comparing the average slopes of tumor cell area change over time. (H) Balb/c female mice were inoculated with 5×10⁵ D2.0R syngeneic murine mammary tumor cells engineered to express eGFP and influenza virus hemagglutinin (HA) as a model antigen for CL4 CD8+ TCR T cell experiments (D2.0R-ffluc/eGFP/HA). 4 weeks post-inoculation, mice were either left untreated, or treated with 150 mg/kg cyclophosphamide alone or in conjunction with 5×10⁶ mouse polyclonal or CL4 TCR T cells. (I) Quantification of D2.0R-fffluc/eGFP/HA DTCs per lung from (H). Data are represented per animal and presented as mean +/− SEM. (J) Representative immunofluorescent images (left panels) and quantification of MHC I fluorescent intensity (right panel) on DTCs in Balb/c mouse lungs treated once per week over three weeks with 0, 0.03, or 0.12 mg/kg doses of IFNγ (ordinary one-way ANOVA) 0 mg/kg n=48, 0.03 mg/kg n=52, 0.12 mg/kg n=36 DTCs analyzed across n=5 mice per group. Data are represented per DTC analyzed and presented as mean +/− SEM. (K) Quantification of DTCs per lung following IFNγ treatment regimen (ordinary one-way ANOVA) n=5 mice/group. Data represented per animal and presented as mean +/− SEM. (L) Balb/c female mice were inoculated with 2×10⁶ D2.0R-ffluc/eGFP/HA tumor cells and treated with low-dose IFNγ (0.03 mg/kg) in conjunction with a single dose of 150 mg/kg cyclophosphamide and 5×10⁶ mouse polyclonal or CL4 TCR T cells. (M) DTCs per lung following treatment. Data represented per animal and presented as mean +/− SEM. (N) DTCs per lung after combination of experimental endpoints from (H) and (L). Data represented per animal and presented as mean +/− SEM. (O) MHC I fluorescent intensity on DTCs from mice in (M) compared to vehicle or IFNγ treated DTCs not inoculated with T cells; ordinary one-way ANOVA. Vehicle n=56, CL4 + Vehicle n=13, IFNg n=61, CL4 + IFNg n=23. Data represented per DTC analyzed and presented as mean +/− SEM. (A), (E), (H), and (L) created with Biorender.com All tests were Mann-Whitney Tests unless otherwise noted. * denotes p < 0.05, ** denotes p < 0.01, *** denotes p < 0.001, **** denotes p < 0.0001, and n.s. indicates not significant, unless otherwise noted. See also Table S1 and Figure S3.
Figure 4:
Figure 4:. Enhancing the effector-to-target ratio between disseminated tumor cells and cognate T cells facilitates DTC clearance in vivo.
(A) Female athymic nude (AtN) mice were inoculated with 5×10⁵ D2.0R syngeneic murine mammary tumor cells engineered to express eGFP. 30 days post-inoculation mice were either left untreated or treated with log-fold titrations of eGFP-specific JEDI T cells. 4 days following adoptive T cell transfer, animals were euthanized and the dissected lungs were divided for enumeration of GFP+ tumor cells and CD45.1+ JEDI T cells using flow cytometry, and measurement of the distances between DTCs and JEDI T cells using immunofluorescent imaging. (B) Number of GFP+ DTCs and CD45.1+ JEDI T cells plotted per treatment group. Data is displayed as the average per group +/− SEM, per 1×10⁶ lung cells. Dotted lines represent the limit of detection, which was determined by flow cytometric analysis of naïve lungs. (C-D) Number of DTCs (C) and JEDI T cells (D) plotted as a function of the dose of adoptively transferred JEDI T cells from n=10 mice per group; ordinary one-way ANOVA. Data presented as mean +/− SEM (E) Number of GFP+ DTCs and CD45.1+ JEDI T cells enumerated by flow cytometric analysis and plotted per mouse irrespective of treatment dose. Spearman rank correlation and Pearson correlation coefficients were calculated between DTC and JEDI T cell number in each individual lung without reference to treatment group. (F) Representative image of lung tissue from (A) (left panel) and example of distance analysis between transferred T cells and tumor cells (right panel) determined by measuring the linear distance using Zen image analysis software. (G) Distance between GFP+ tumor cells and CD45.1+ JEDI T cells as a function of the dose of adoptively transferred JEDI T cells. Dot plots display all distances measured from n=3 mice per group and 4 tissue sections per lung spaced apart by ~100 μm. Data is displayed as the average per group +/− SEM; Brown-Forsythe ANOVA. (H) Balb/c female mice were inoculated with 5×10⁵ D2.0R syngeneic murine mammary tumor cells engineered to express eGFP. 4 weeks post-inoculation mice were either treated with 1×10⁶ Tvaccine or untransduced control murine T cells once weekly for two weeks to boost endogenous GFP-specific CD8+ T cell responses against DTCs. Lungs were harvested for assessment of expansion of (I) endogenous GFP-specific CD8+ T cells and (J) GFP+ DTCs in the lung. Data presented as mean +/− SEM. (K) Number of GFP+ DTCs and GFP Tetramer+ CD8+ T cells plotted per mouse for correlation analysis, irrespective of treatment dose. Spearman rank correlation and Pearson correlation coefficients were calculated between DTC and Tetramer+ T cell number in each individual lung, without reference to treatment group. (A) and (H) were created with BioRender.com. All tests were Mann-Whitney Tests unless otherwise noted. * denotes p < 0.05, ** denotes p < 0.01, *** denotes p < 0.001, **** denotes p < 0.0001, and n.s. indicates not significant, unless otherwise noted. See also Table S1.
Figure 5:
Figure 5:. CAR T cells eliminate dormant disseminated disease in models employing both model and breast cancer antigens.
(A) Representative images of organotypic co-cultures seeded with tCD19+ T4–2 at day day 0 (day of tumor cell seeding), day 10 (D10, 10 days post-tumor seeding & day of T cell seeding) and day 17 (D17, end of experiment). (B) Tumor cell area as measured by GFP area representative of tCD19+ or tCD19 T4–2 cells in cultures treated with CD19 targeted CAR T cells or untransduced (UT) control T cells. Bars represent average tumor cell area +/− SD per well at D10, D12, D14, and D17 of the experiment; n=3–5 experiments with 3 technical replicates each. Data in were analyzed by student’s t-tests comparing the average slopes of tumor cell area change over time. (C) Balb/c female mice were inoculated with 5×10⁵ D2.0R-ffluc/eGFP/tCD19 tumor cells. 4 weeks post-inoculation, mice were left untreated, or treated with 150 mg/kg cyclophosphamide alone or in conjunction and 5×10⁶ mouse mock transduced or CAR T cells. (D) Representative image of mouse lung harboring a D2.0R-ffluc/eGFP/tCD19 DTC (left panel); and quantification of DTCs per lung (middle panel; left panel shows mock transduced and CAR T comparison in greater detail). Data presented as mean +/− SEM. (E) Rapid autopsy lung staining from a patient who died with HER2+ breast cancer. Representative images of patient lung stained for HER2 and Ki67 showed maintenance of HER2 expression on Ki67 DTC (left panel) and small micro-metastases (right panel). (F) Representative images of HER2+ BT474 organotypic co-cultures at day 10 (D10, day of T cell seeding) and day 19 (D19). (G) Tumor cell area as measured by GFP or RFP fluorescent area of BT474 HER2-overexpressing breast cancer cells in cultures treated with T cells engineered to express a HER2-specific CAR or with mock transduced T cells. Bars represent average tumor cell area per well +/− SD at D10, D12, D14, D17, and D19 of the experiment; n=5 experiments with 3 technical replicates each. Data in were analyzed by student’s t-tests comparing the average slopes of tumor cell area change over time. (H) Athymic Nude (AtN) female mice were inoculated with 5×10⁵ D2.0R-eGFP/HER2 tumor cells. 4 weeks post-inoculation, mice were either left untreated or treated with 5×10⁶ mouse mock, 4–1BB CAR, or CD28 CAR T cells targeting HER2. Because Athymic mice lack T cells, lymphodepleting cyclophosphamide was not necessary. (I) Quantification of DTCs per lung from (H). Data presented as mean +/− SEM. (C) and (H) created with BioRender.com. All statistical tests were two-tailed Mann-Whitney Tests unless otherwise noted. * denotes p < 0.05, ** denotes p < 0.01, *** denotes p < 0.001, **** denotes p < 0.0001, and n.s. indicates not significant, unless otherwise noted. See also Table S1 and Figure S4.

Comment in

References

    1. Pan H, Gray R, Braybrooke J, Davies C, Taylor C, McGale P, Peto R, Pritchard KI, Bergh J, Dowsett M, et al. (2017). 20-Year Risks of Breast-Cancer Recurrence after Stopping Endocrine Therapy at 5 Years. The New England journal of medicine 377, 1836–1846. 10.1056/NEJMoa1701830. - DOI - PMC - PubMed
    1. Karrison TG, Ferguson DJ, and Meier P (1999). Dormancy of mammary carcinoma after mastectomy. Journal of the National Cancer Institute 91, 80–85. - PubMed
    1. Pedersen RN, Esen BO, Mellemkjaer L, Christiansen P, Ejlertsen B, Lash TL, Norgaard M, and Cronin-Fenton D (2022). The Incidence of Breast Cancer Recurrence 10–32 Years After Primary Diagnosis. J Natl Cancer Inst 114, 391–399. 10.1093/jnci/djab202. - DOI - PMC - PubMed
    1. Husemann Y, Geigl JB, Schubert F, Musiani P, Meyer M, Burghart E, Forni G, Eils R, Fehm T, Riethmuller G, and Klein CA (2008). Systemic spread is an early step in breast cancer. Cancer cell 13, 58–68. 10.1016/j.ccr.2007.12.003. - DOI - PubMed
    1. Hu Z, Ding J, Ma Z, Sun R, Seoane JA, Scott Shaffer J, Suarez CJ, Berghoff AS, Cremolini C, Falcone A, et al. (2019). Quantitative evidence for early metastatic seeding in colorectal cancer. Nat Genet 51, 1113–1122. 10.1038/s41588-019-0423-x. - DOI - PMC - PubMed

Publication types