. 2024 Jan 8;42(1):157-167.e9.
doi: 10.1016/j.ccell.2023.12.010.

Distinct spatiotemporal dynamics of CD8+ T cell-derived cytokines in the tumor microenvironment

Affiliations

Distinct spatiotemporal dynamics of CD8+ T cell-derived cytokines in the tumor microenvironment

Mirjam E Hoekstra et al. Cancer Cell. .

Abstract

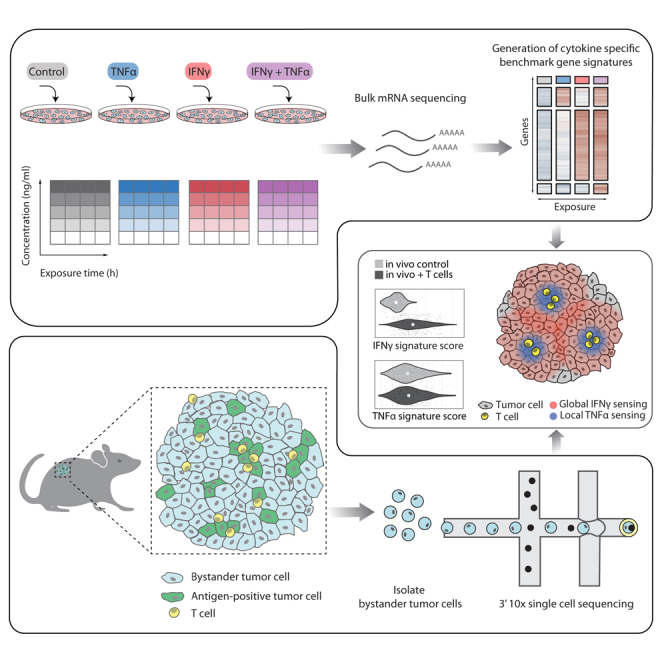
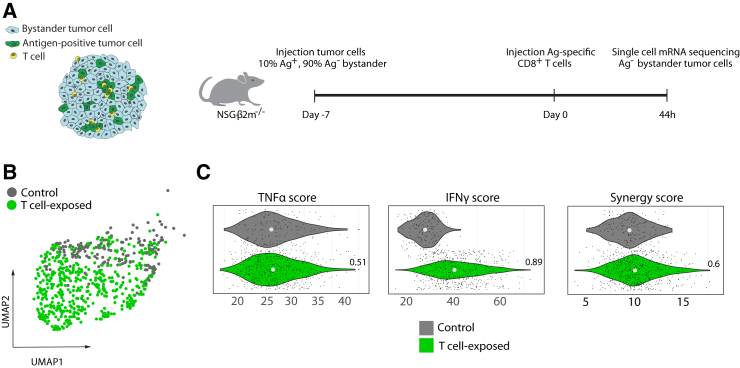
Cells in the tumor microenvironment (TME) influence each other through secretion and sensing of soluble mediators, such as cytokines and chemokines. While signaling of interferon γ (IFNγ) and tumor necrosis factor α (TNFα) is integral to anti-tumor immune responses, our understanding of the spatiotemporal behavior of these cytokines is limited. Here, we describe a single cell transcriptome-based approach to infer which signal(s) an individual cell has received. We demonstrate that, contrary to expectations, CD8+ T cell-derived IFNγ is the dominant modifier of the TME relative to TNFα. Furthermore, we demonstrate that cell pools that show abundant IFNγ sensing are characterized by decreased expression of transforming growth factor β (TGFβ)-induced genes, consistent with IFNγ-mediated TME remodeling. Collectively, these data provide evidence that CD8+ T cell-secreted cytokines should be categorized into local and global tissue modifiers, and describe a broadly applicable approach to dissect cytokine and chemokine modulation of the TME.

Keywords: IFN-gamma; T cell; TNF-alpha; cytokine; single cell RNA-seq; tumor microenvironment.


Conflict of interest statement

Declaration of interests L.F.A.W. received project funding for unrelated work from Bristoll-Myers-Squibb. T.N.S. is advisor for Allogene Therapeutics, Asher Bio, Merus, Neogene Therapeutics, and Scenic Biotech; is a stockholder in Allogene Therapeutics, Asher Bio, Cell Control, Celsius, Merus, and Scenic Biotech; and is venture partner at Third Rock Ventures, all outside of the current work.

Figures

None
Graphical abstract
Figure 1
Figure 1
Gene expression informs on cytokine exposure (A) mRNA expression profiles of selected genes in OVCAR5 cells exposed to indicated concentrations of IFNγ, TNFα, or their combination, for the indicated duration. Top, middle, and bottom panels depict genes that are primarily responsive to TNFα, IFNγ, or TNFα plus IFNγ, respectively. (B) Heatmap of bulk gene expression values inferred from OVCAR5 cells exposed to indicated concentrations of TNFα, IFNγ, or TNFα plus IFNγ, for indicated durations. Unsupervised hierarchical clustering of data (shown are the 612 genes from the “cytokine-responsive class”), groups samples by exposure type and then by exposure duration. (C) Heatmap of bulk gene-expression values for mono-responsive genes and synergy genes inferred from in vitro stimulated OVCAR5 cells, as in (A) and (B). Unsupervised hierarchical clustering of gene expression data shows a nearly full agreement with assigned gene classes (cluster purity of 0.86). (D) UMAP of scRNA-seq data of OVCAR5 cells stimulated with indicated recombinant cytokines for 24 h. (E) Gene set scores for scRNA-seq data of in vitro cytokine stimulated cells as in a. Left panels: dots represent gene set scores of individual cells violins represent densities of score distributions, white dots represent group medians. Area under the receiver operator curve (AUROC) values, quantifying how well experimental conditions can be distinguished from the control condition, are depicted. Right panels: Heatmaps showing pairwise distinguishability of indicated experimental conditions (axes) using gene set scores, as quantified using AUROC values. Comparisons for which indicated gene sets are designed to show separation are encircled. (F) IFNγ plateau versus IFNγ late gene set scores (see STAR methods) for OVCAR5 cells stimulated with IFNγ (100 ng/ml) for the indicated times. Black lines are LOESS-smoothed curves representing local averages, one per stimulus duration. The ratio of each of the two gene set scores informs on duration of cytokine exposure. (G) IFNγ plateau versus IFNγ late gene set scores and TNFα early versus TNFα late gene set scores for OVCAR5 cells stimulated with culture medium obtained from T cell-tumor cell co-cultures for the indicated times as in (F). See also Figures S1, S2, and Table S1.
Figure 2
Figure 2
Frequent IFNγ but not TNFα sensing by bystander tumor cells (A) NSG-β2m−/− mice injected subcutaneously with a mixture of 10% CDK4R>L antigen expressing and 90% bystander OVCAR5 tumor cells were treated with either PBS (control) or CDK4R>L-specific CD8+ T cells after tumor establishment. Tumors were harvested 44 h after treatment, and bystander tumor cells were analyzed by scRNA-seq. (B) UMAP of single cells based on gene expression in the “cytokine-responsive” gene class. (C) TNFα, IFNγ, and synergy gene set scores of single cells derived from OVCAR5 tumors. Dots represent gene set scores of individual cells, violins represent densities of score distributions, white dots represent group medians. Numeric values reflect AUROC values that quantify separability between experimental conditions. Note that IFNγ, but not TNFα, gene set scores are increased in the T cell-exposed condition as compared to the control condition. See also Figure S3.
Figure 3
Figure 3
Appreciable IFNγ, but not TNFα sensing by bystander tumor cells early after T cell activation (A) NSG-β2m−/− mice injected subcutaneously with a mixture of 10% CDK4R>L antigen expressing and 90% bystander OVCAR5 tumor cells were treated with PBS (control) or with CDK4R>L-specific CD8+ T cells after tumor establishment. Tumors were harvested 16 or 44 h after treatment, and bystander tumor cells were subjected to scRNA-seq. (B) UMAP of scRNA-seq from bystander cells of control and T cell-exposed OVCAR5 tumors harvested 16 or 44 h after treatment, based on genes in the “cytokine-responsive” class. (C) Violin plots of TNFα, IFNγ, and synergy gene set scores of cells derived from OVCAR5 tumors, as described in (A). Dots represent gene set scores of individual cells, violins represent densities of score distributions, white dots represent group medians. Numeric values reflect AUROC values that quantify separability between experimental conditions. (D) Scatterplots of time-informative gene sets for in vivo single cell data described in (A). To remove gene expression effects due to exposure duration independent from T cell exposure, depicted gene set scores were normalized to control (PBS treated) counterparts in a duration-matched fashion (STAR methods). (E) TNFα, IFNγ, and synergy gene set scores of OVCAR5 tumor cells derived from tumors injected with indicated recombinant cytokines. Cytokine exposure times were chosen based on maximal change in expression of cytokine specific responsive genes after in vitro cytokine exposure, as in Figure 1B. Numeric values reflect AUROC values that quantify separability between experimental conditions, as in Figure 1E. See also Figure S3.
Figure 4
Figure 4
Frequent IFNγ sensing in a syngeneic tumor model and relationship with reduced TGFβ sensing (A) Rag2−/− mice were injected subcutaneously with a mixture of 10% OVA antigen expressing and 90% Ag bystander NMM tumor cells, or with Ag NMM tumor cells only, and, following tumor establishment, were treated with either PBS (control) or OT-1 CD8+ T cells, as indicated. Ag bystander tumor cells were harvested for scRNA-seq analysis 44 h after treatment. (B) TNFα and IFNγ gene set scores, determined using the genes shown in a, for the T cell-exposed condition (green) and the two control conditions (T cell-exposed-Ag bystander NMM tumor cells only tumors, and PBS treated tumors, shades of gray). Dots represent gene set scores of individual cells, violins represent densities of score distributions, white dots represent group medians. (C) Left panel: UMAP of NMM melanoma single cell data, as described in (A) and (B). Middle and right panels: a Milo model was fitted to the data to test for enrichment or depletion for any of the experimental conditions in neighborhoods of transcriptionally similar cells. Non-significantly imbalanced neighborhoods (Spatial FDR >0.05), as well as homogeneous neighborhoods, are colored white. (D) Left panel: heatmap of top 250 genes (rows) most strongly correlated (Spearman correlation) with enrichment for the T cell-exposed condition in cell state neighborhoods (columns) of transcriptionally similar cells. Depicted values are neighborhood averages. Neighborhoods are ordered according to compositional enrichment of cells from the T cell-exposed condition. Top panels show log fold change in differential abundance (logFC DA) for the indicated experimental condition relative to control condition. Right panel: heatmap showing bulk RNA-seq gene expression profiles of NMM cells exposed to indicated cytokines for the same genes as in the heatmap in the left panel, ordered identically. (E) As in (D), but for TGFβ responsive genes selected on bulk RNA-seq data. (F) Deconvolution mixing weights of neighborhoods in an independent bulk RNA-seq experiment. Neighborhoods ordered as in (D). Only the 6 out of 28 most highly selected reference profiles are shown, jointly comprising 94% of all assigned similarity. (G) Left: Increase in reconstruction error when the 17 reference profiles with TGFβ are omitted as compared to when all 28 profiles are included. Permutation testing was employed to test whether increase in reconstruction error could be explained by a lower number of reference profiles (STAR methods). Right: As left, but omitting the 17 reference profiles with IFNγ. (H) Model visualizing secondary effects of long range IFNγ sensing. In parallel to the mechanism in which long range IFNγ sensing leads to generation of, for instance, CXCL9/10/11 chemokine fields and subsequent increased immune cell infiltration, long range IFNγ sensing may result in secondary changes in the TME by decreasing TGFβ sensing. See also Figure S4.

References

    1. Giladi A., Cohen M., Medaglia C., Baran Y., Li B., Zada M., Bost P., Blecher-Gonen R., Salame T.M., Mayer J.U., et al. Dissecting cellular crosstalk by sequencing physically interacting cells. Nat. Biotechnol. 2020;38:629–637. - PubMed
    1. Altan-Bonnet G., Mukherjee R. Cytokine-mediated communication: a quantitative appraisal of immune complexity. Nat. Rev. Immunol. 2019;19:205–217. - PMC - PubMed
    1. Raskov H., Orhan A., Christensen J.P., Gögenur I. Cytotoxic CD8(+) T cells in cancer and cancer immunotherapy. Br. J. Cancer. 2021;124:359–367. - PMC - PubMed
    1. Rosenberg S.A., Yang J.C., Sherry R.M., Kammula U.S., Hughes M.S., Phan G.Q., Citrin D.E., Restifo N.P., Robbins P.F., Wunderlich J.R., et al. Durable complete responses in heavily pretreated patients with metastatic melanoma using T-cell transfer immunotherapy. Clin. Cancer Res. 2011;17:4550–4557. - PMC - PubMed
    1. Dudley M.E., Gross C.A., Somerville R.P.T., Hong Y., Schaub N.P., Rosati S.F., White D.E., Nathan D., Restifo N.P., Steinberg S.M., et al. Randomized selection design trial evaluating CD8+-enriched versus unselected tumor-infiltrating lymphocytes for adoptive cell therapy for patients with melanoma. J. Clin. Oncol. 2013;31:2152–2159. - PMC - PubMed

Publication types