. 2024 Feb 1;187(3):596-608.e17.
doi: 10.1016/j.cell.2023.12.025. Epub 2024 Jan 8.

SARS-CoV-2 BA.2.86 enters lung cells and evades neutralizing antibodies with high efficiency

Affiliations

SARS-CoV-2 BA.2.86 enters lung cells and evades neutralizing antibodies with high efficiency

Lu Zhang et al. Cell. .

Abstract

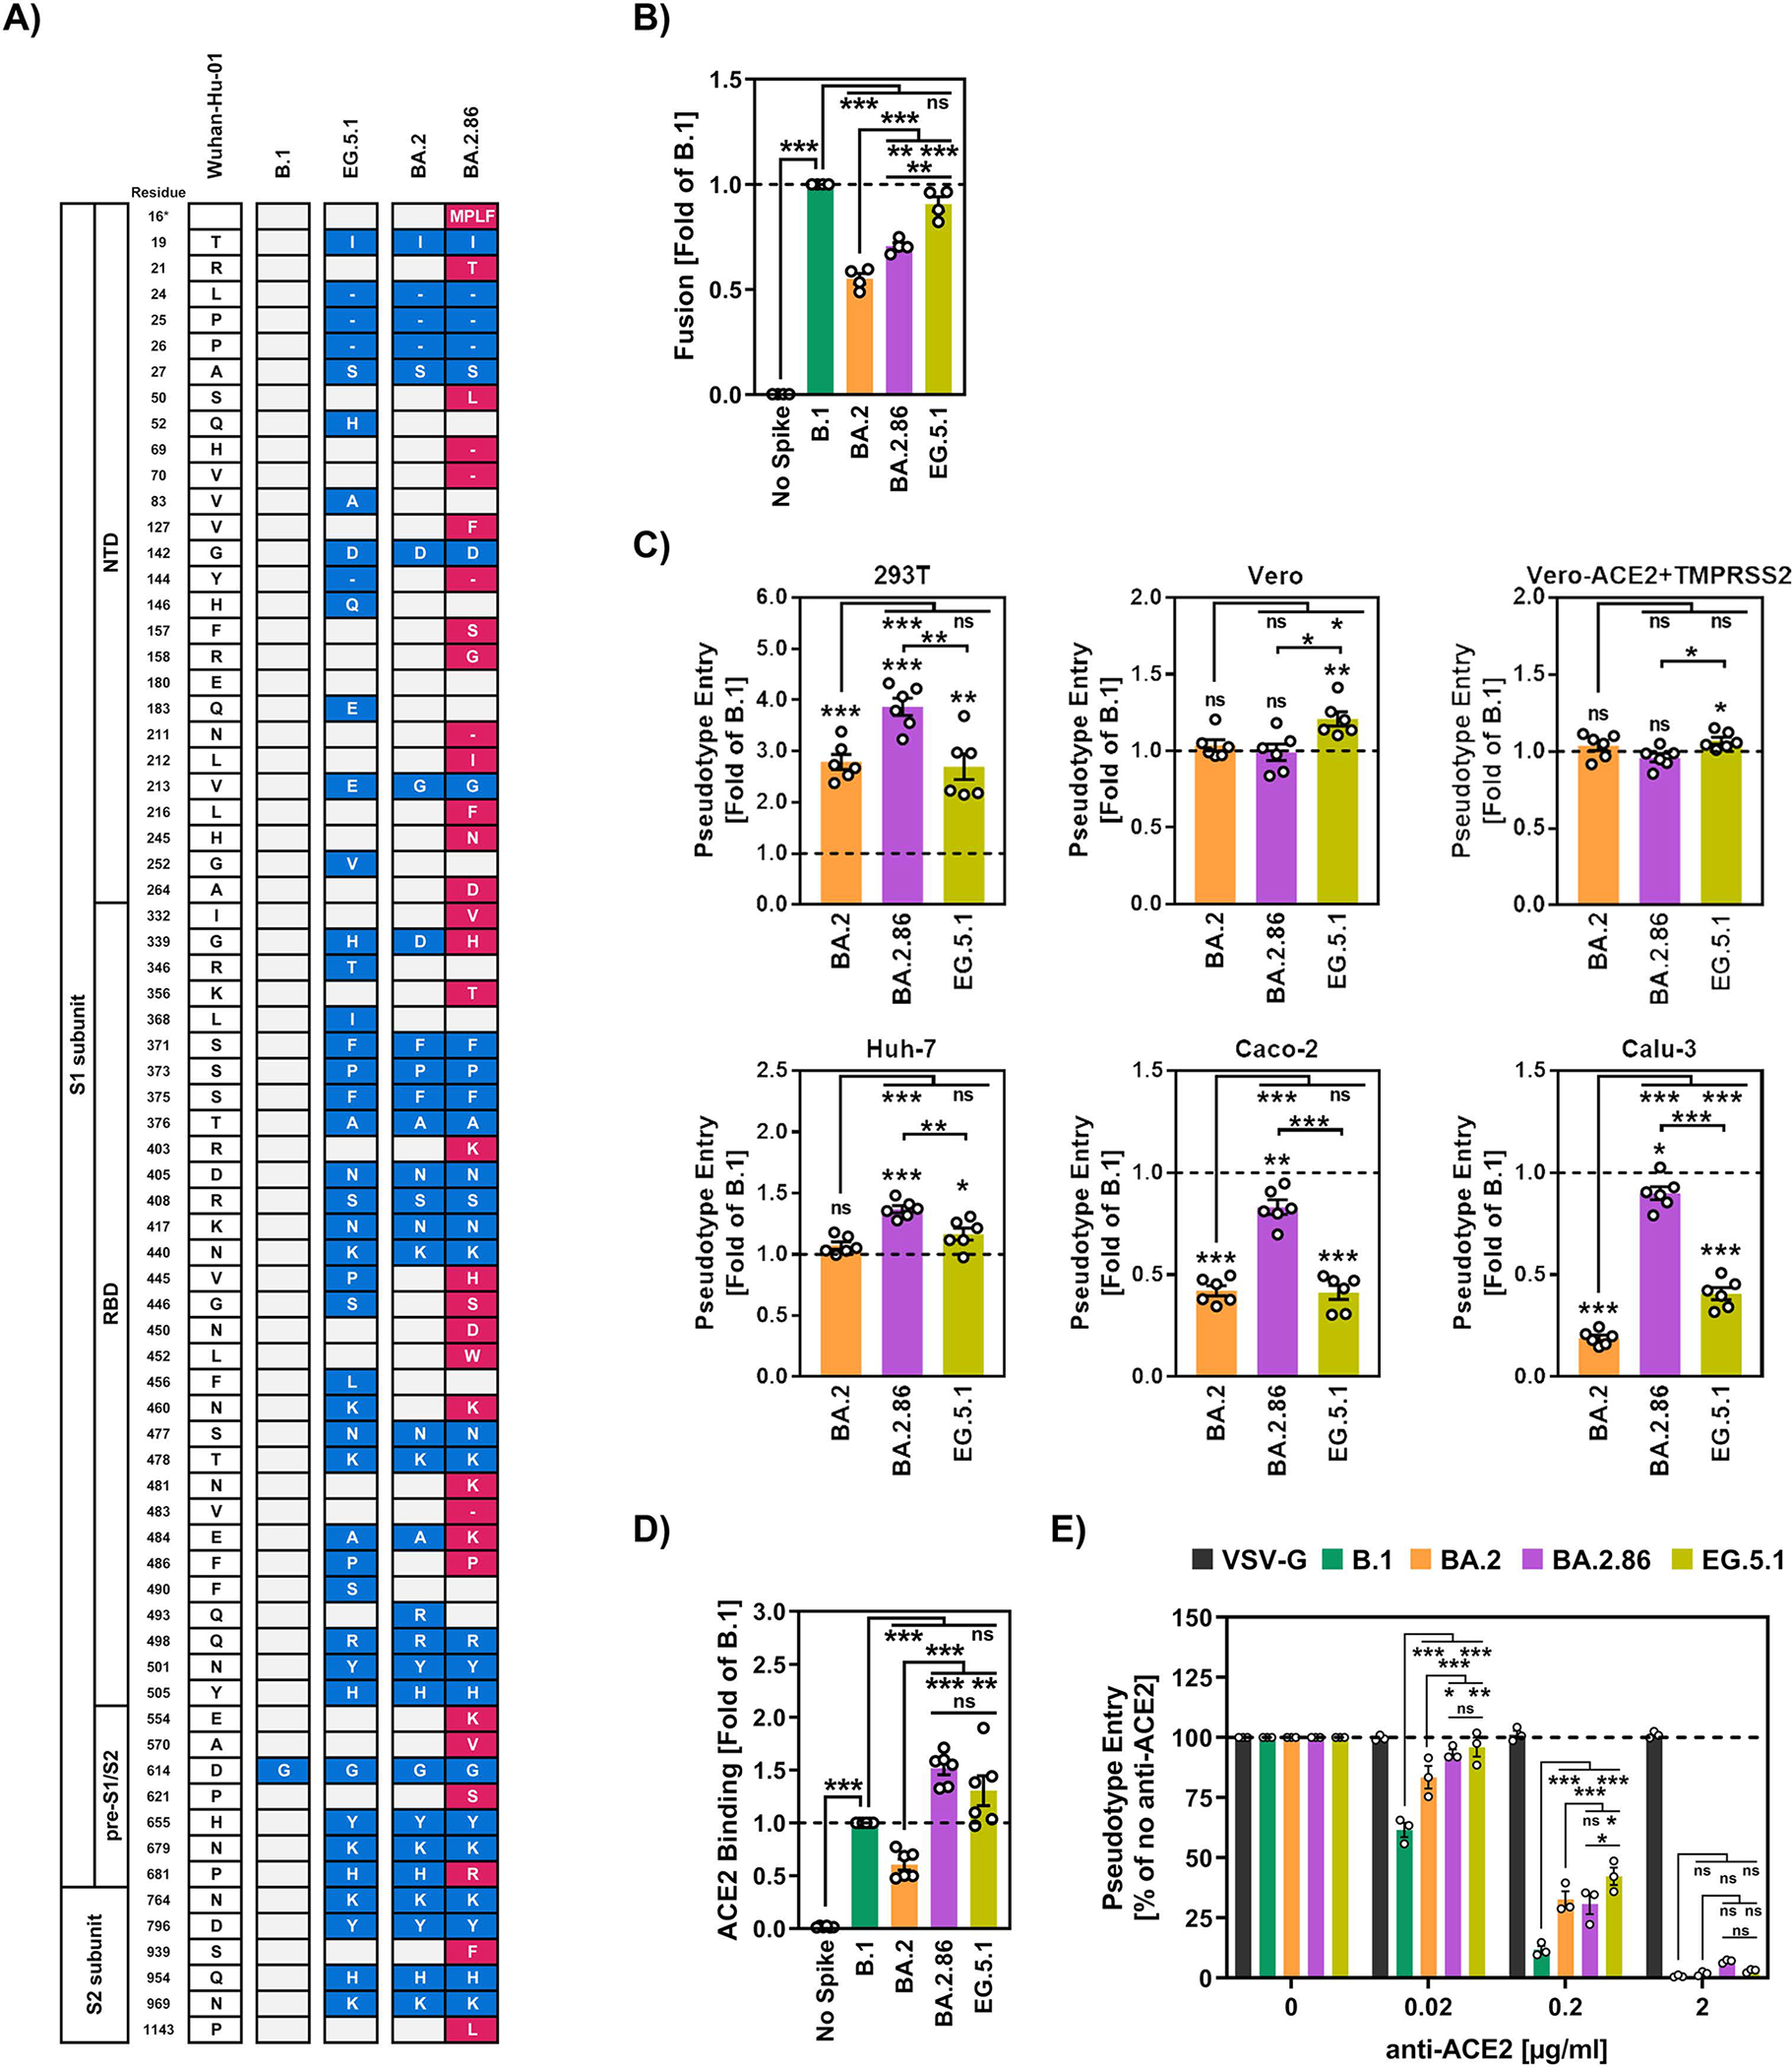
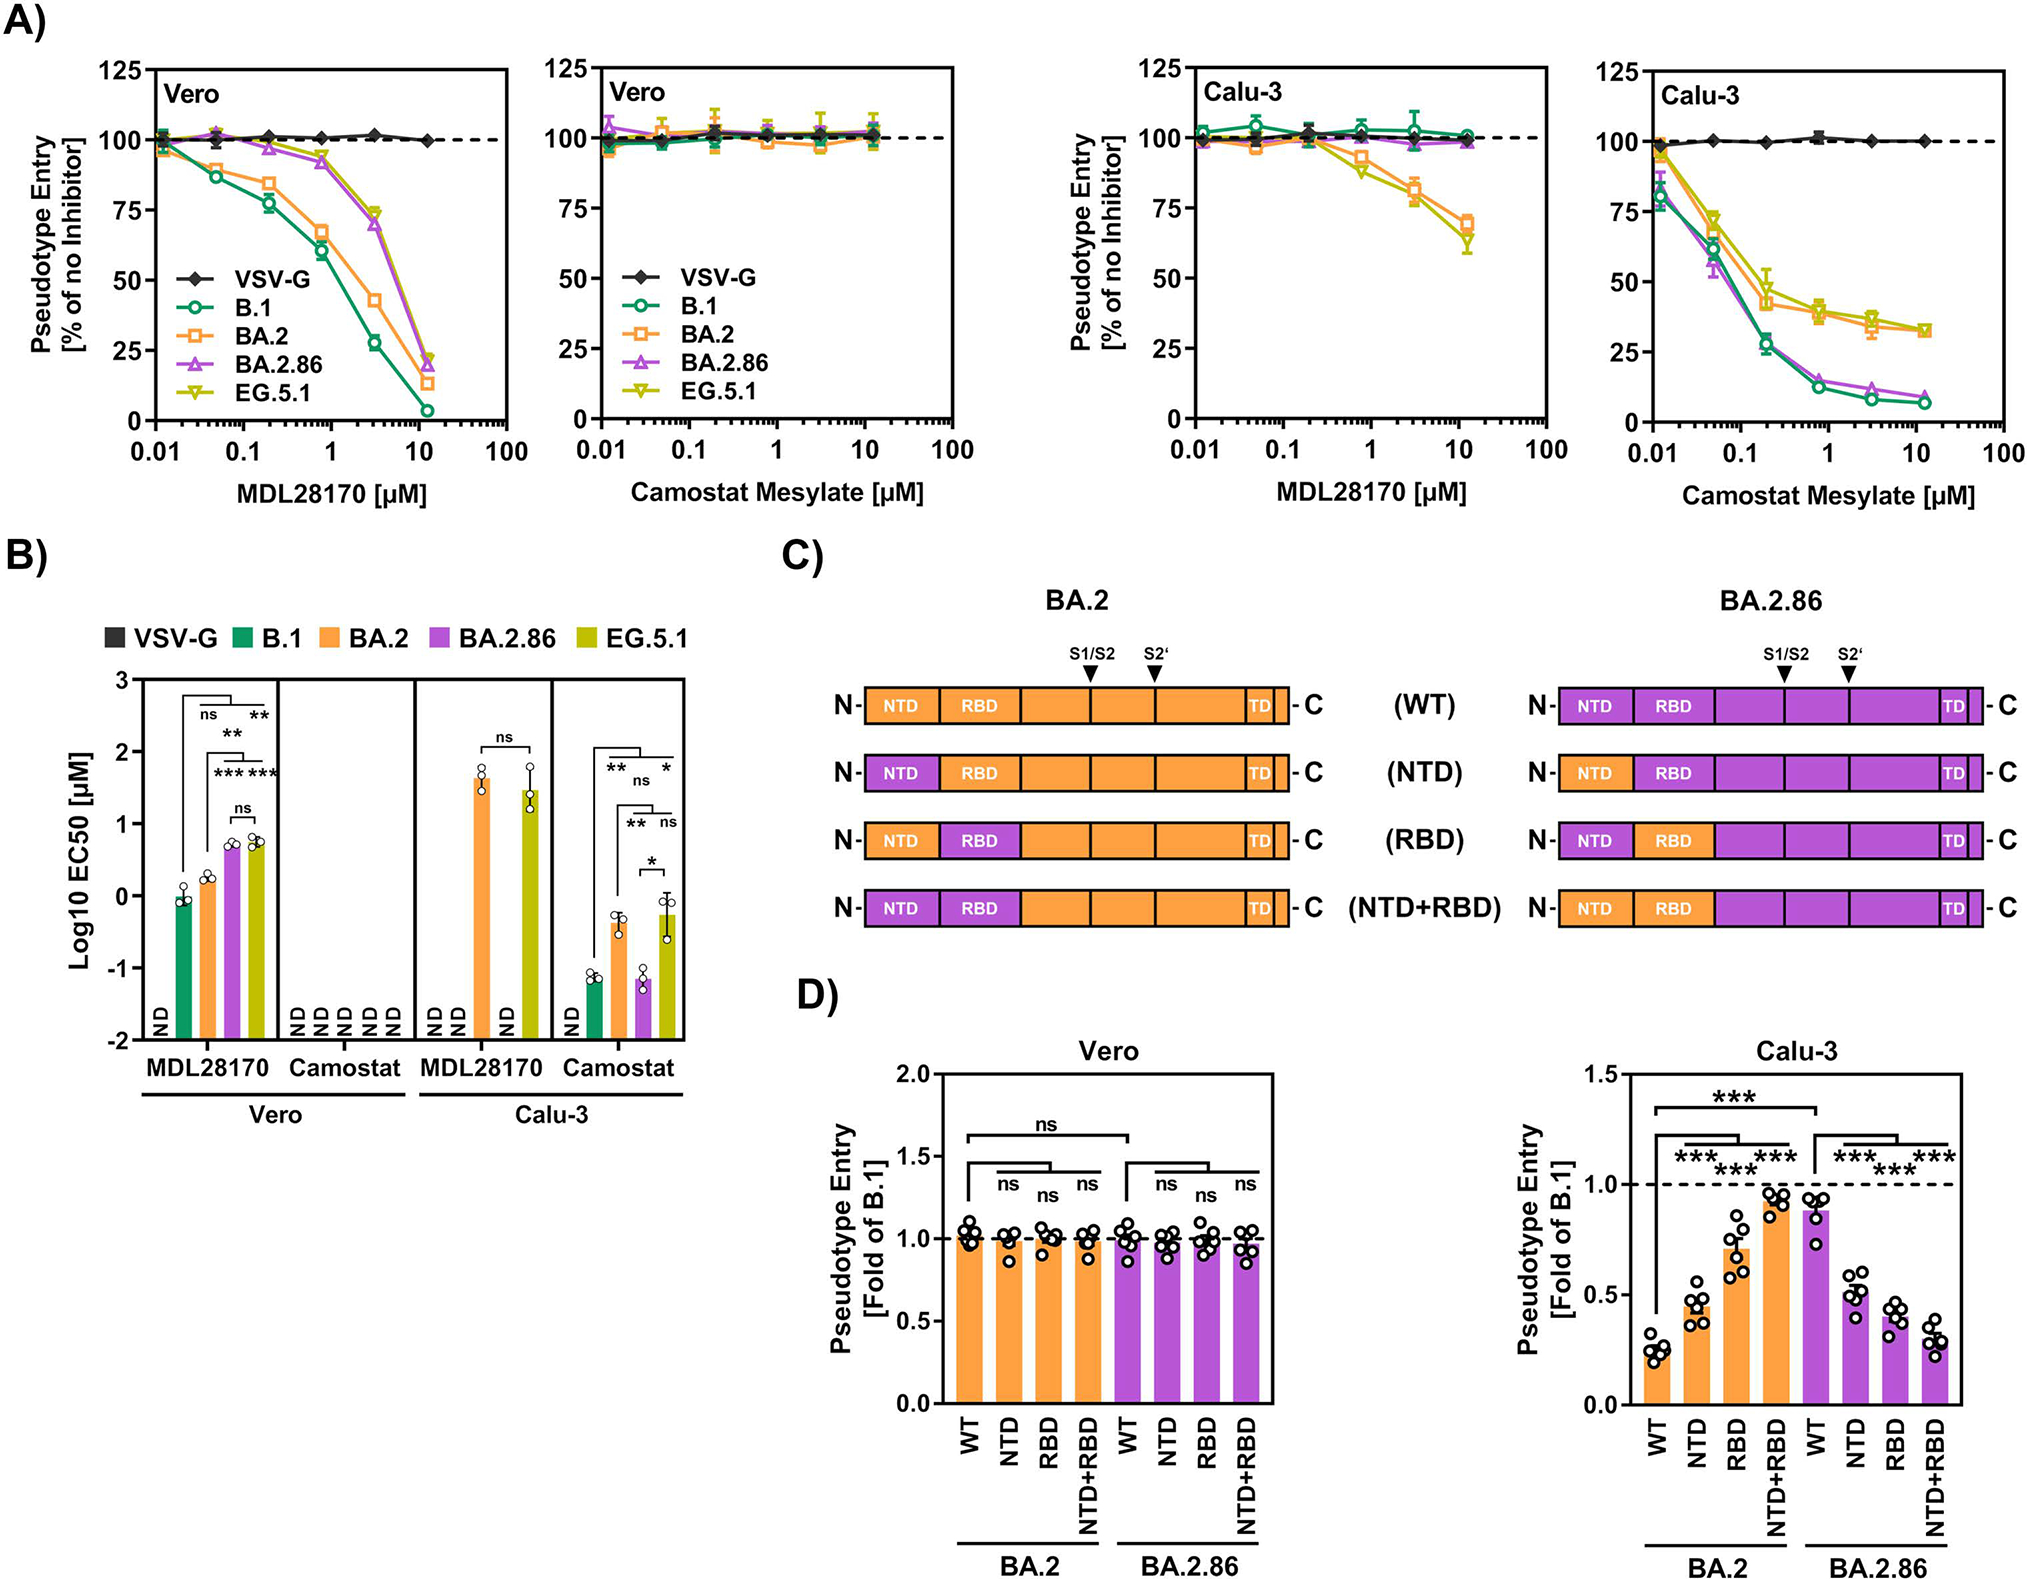
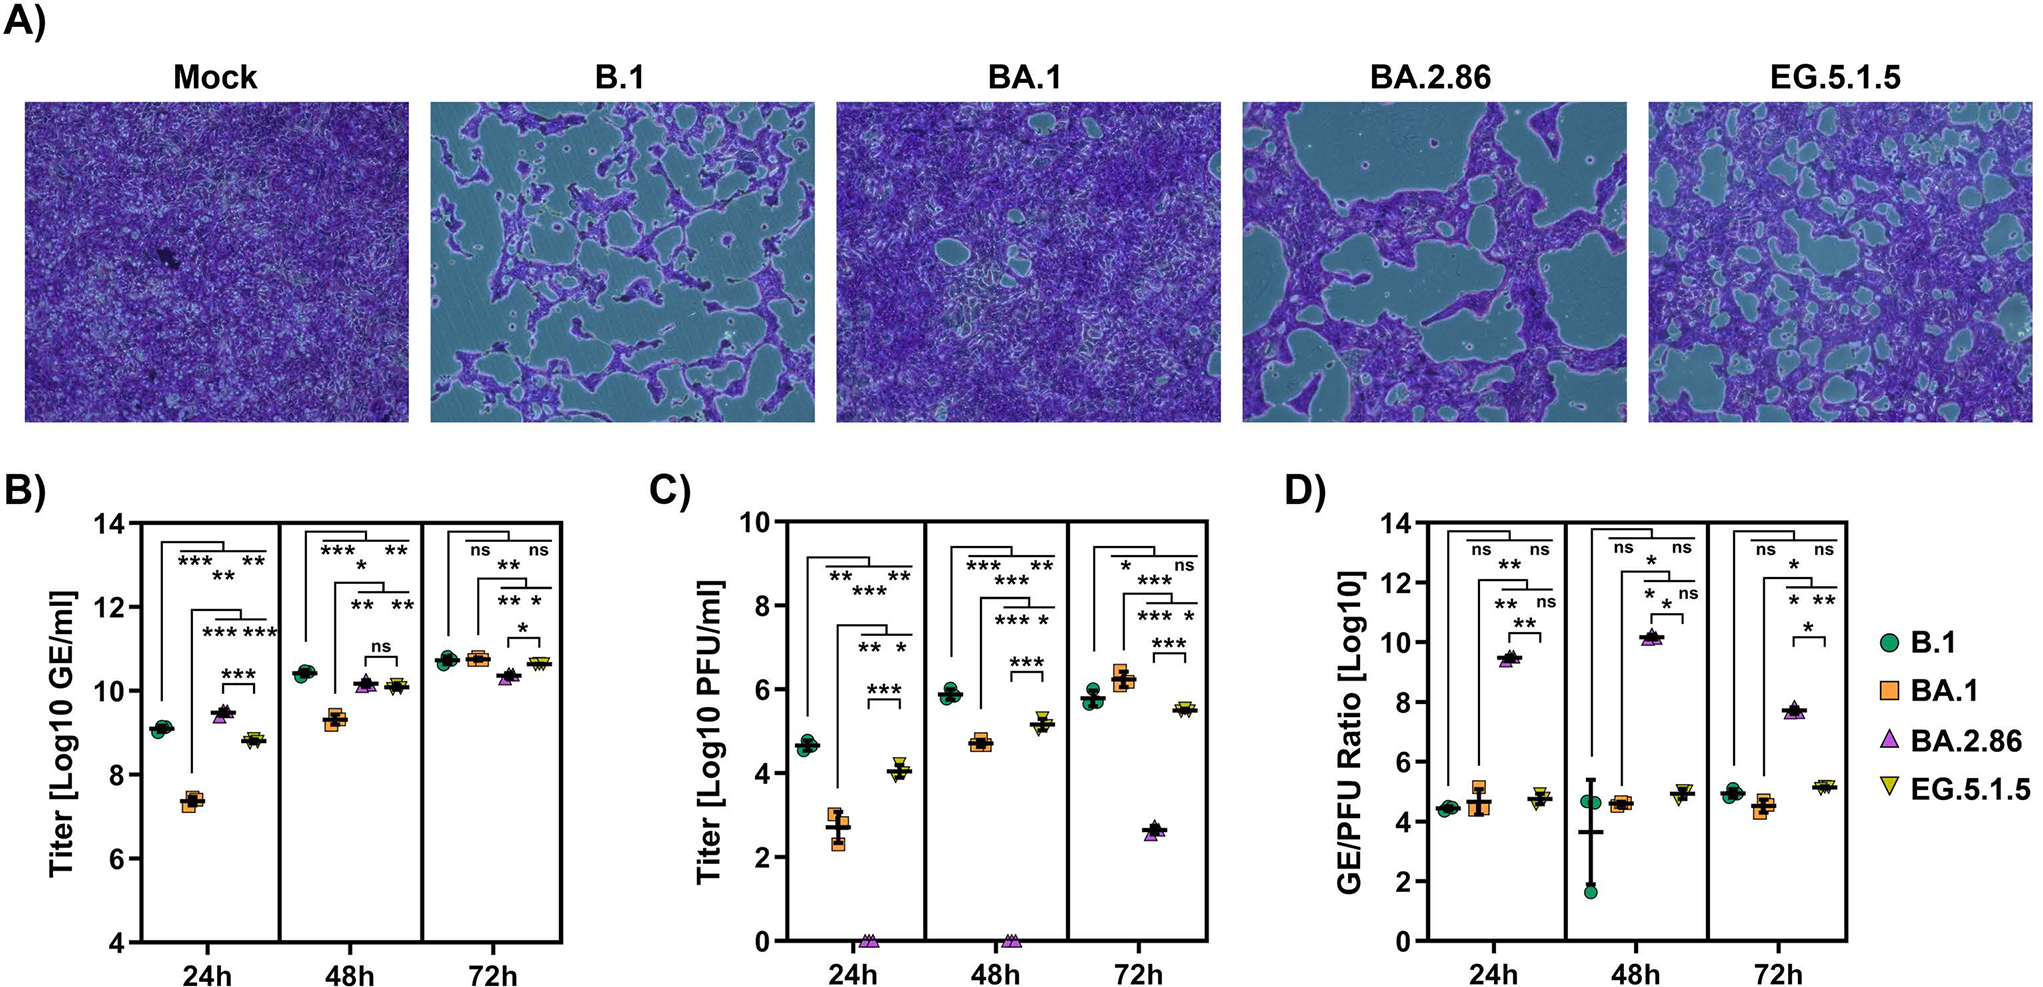
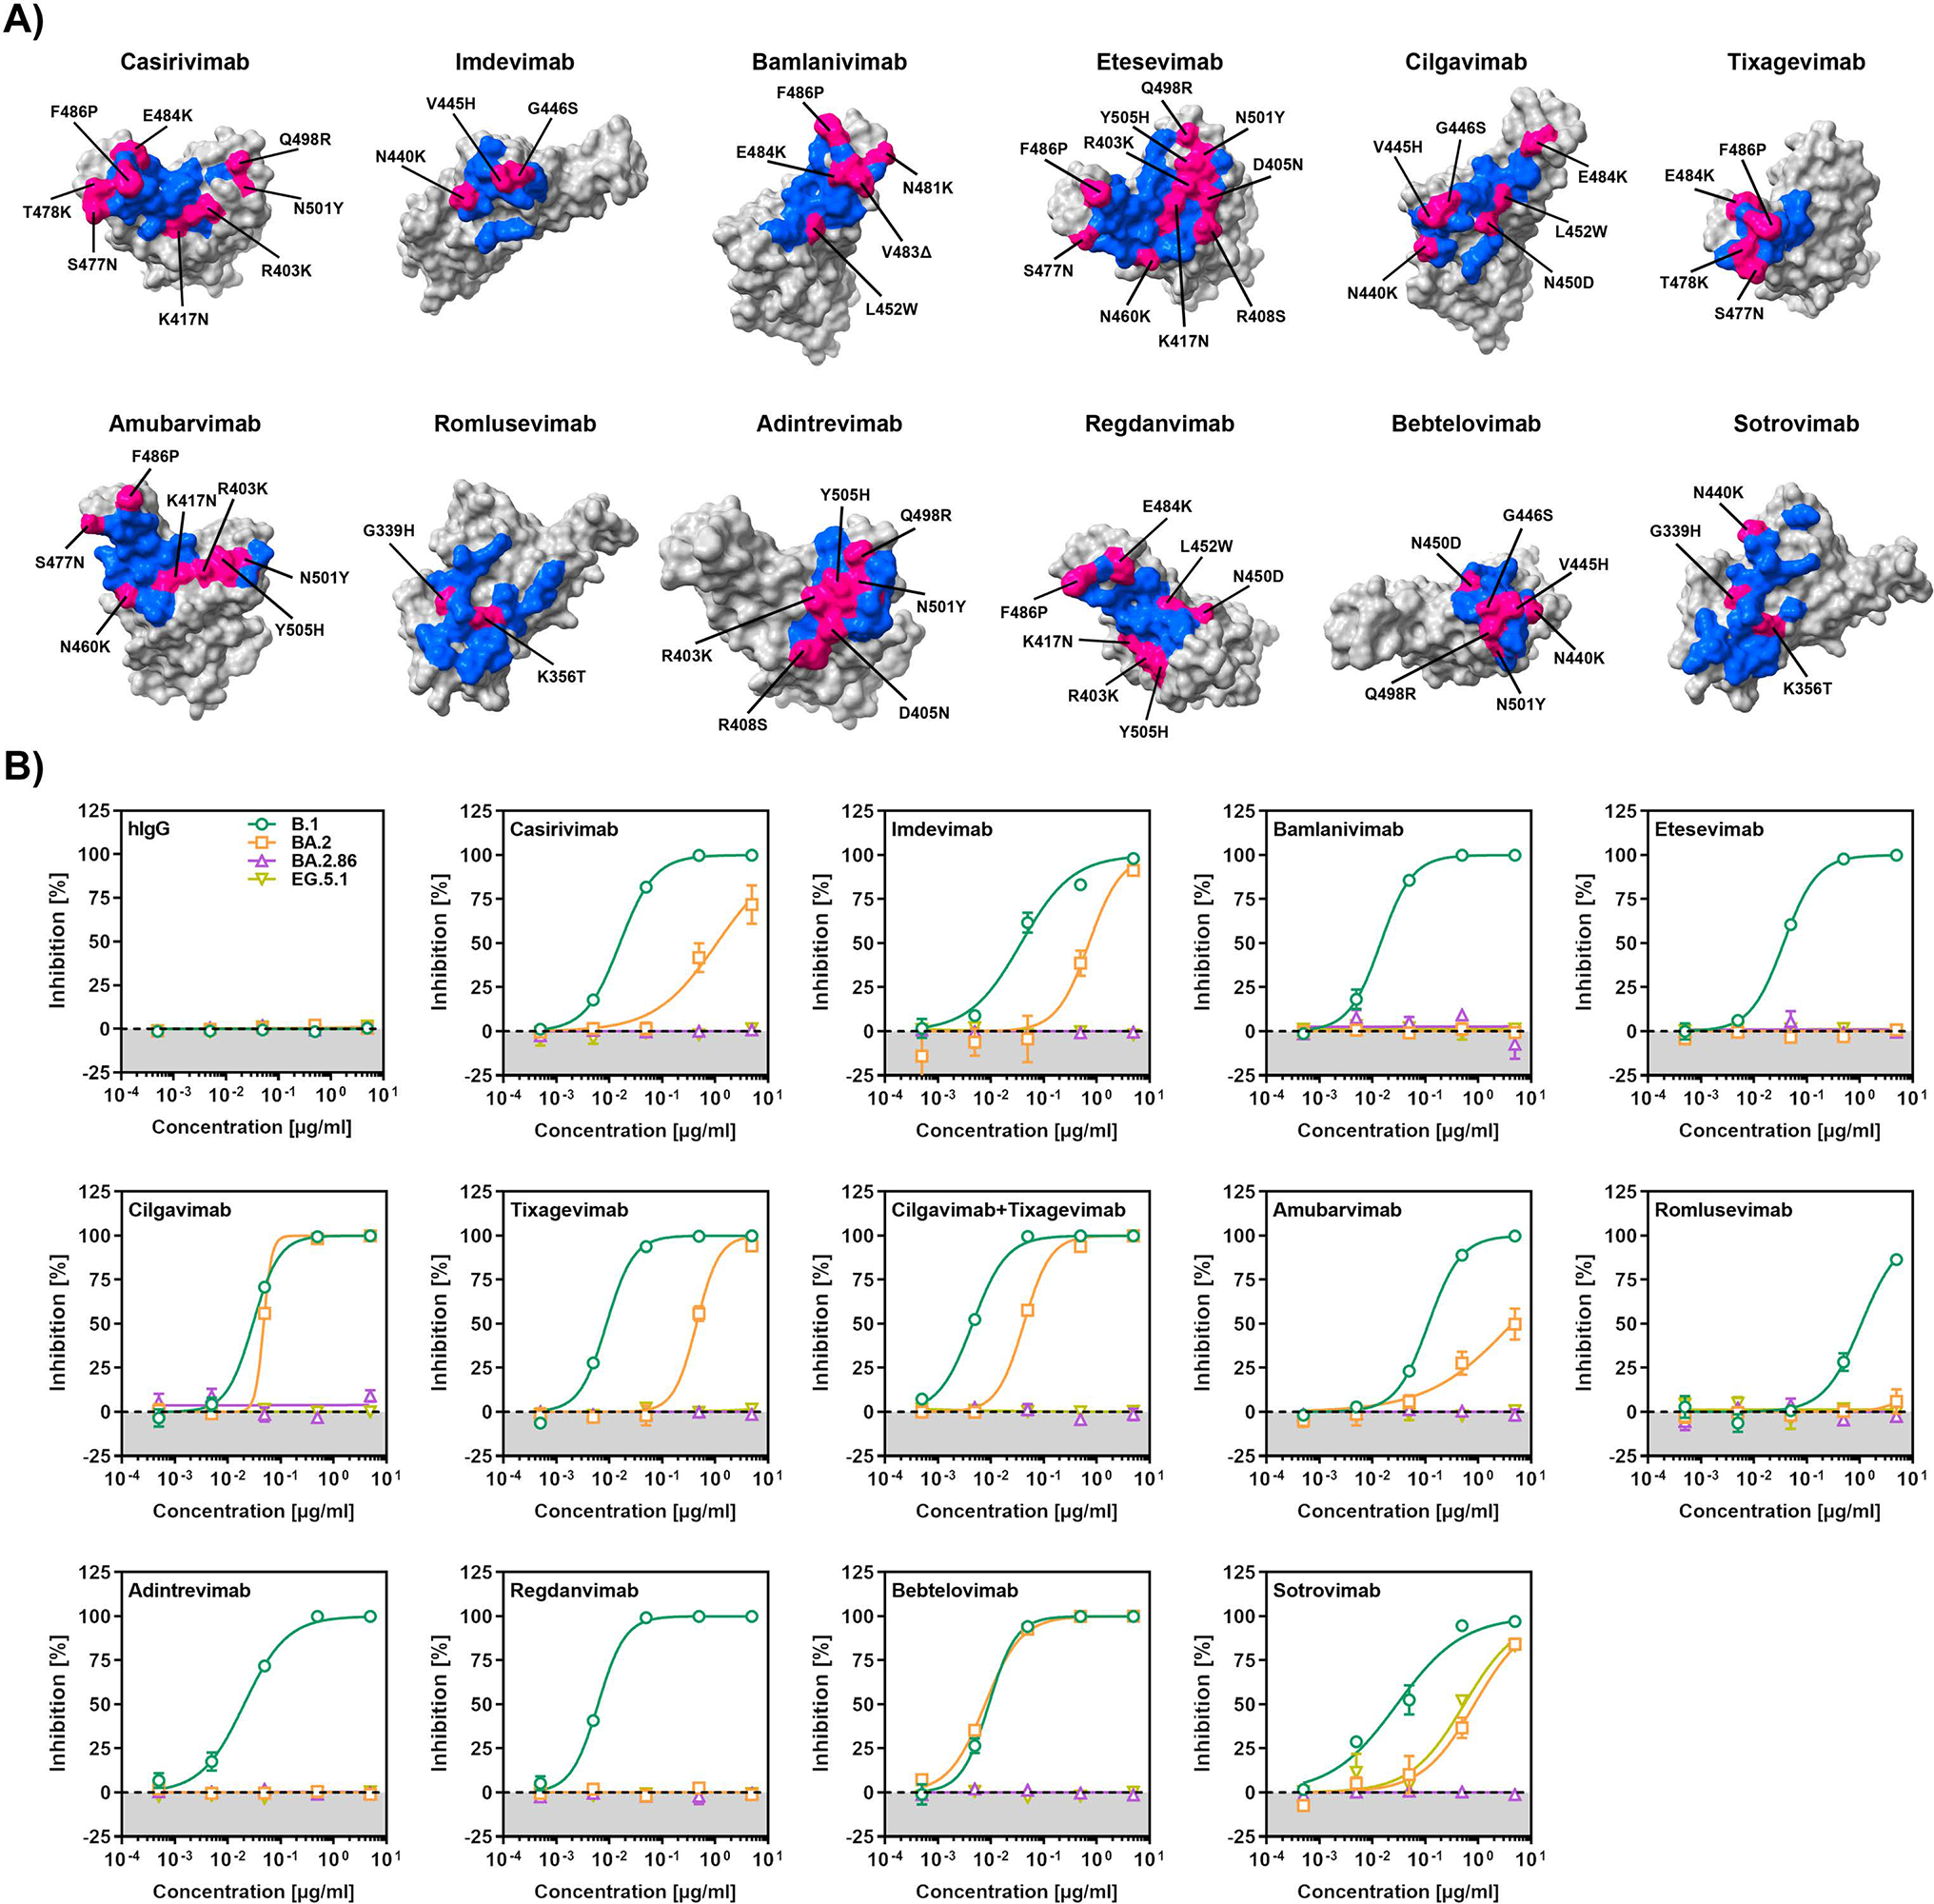
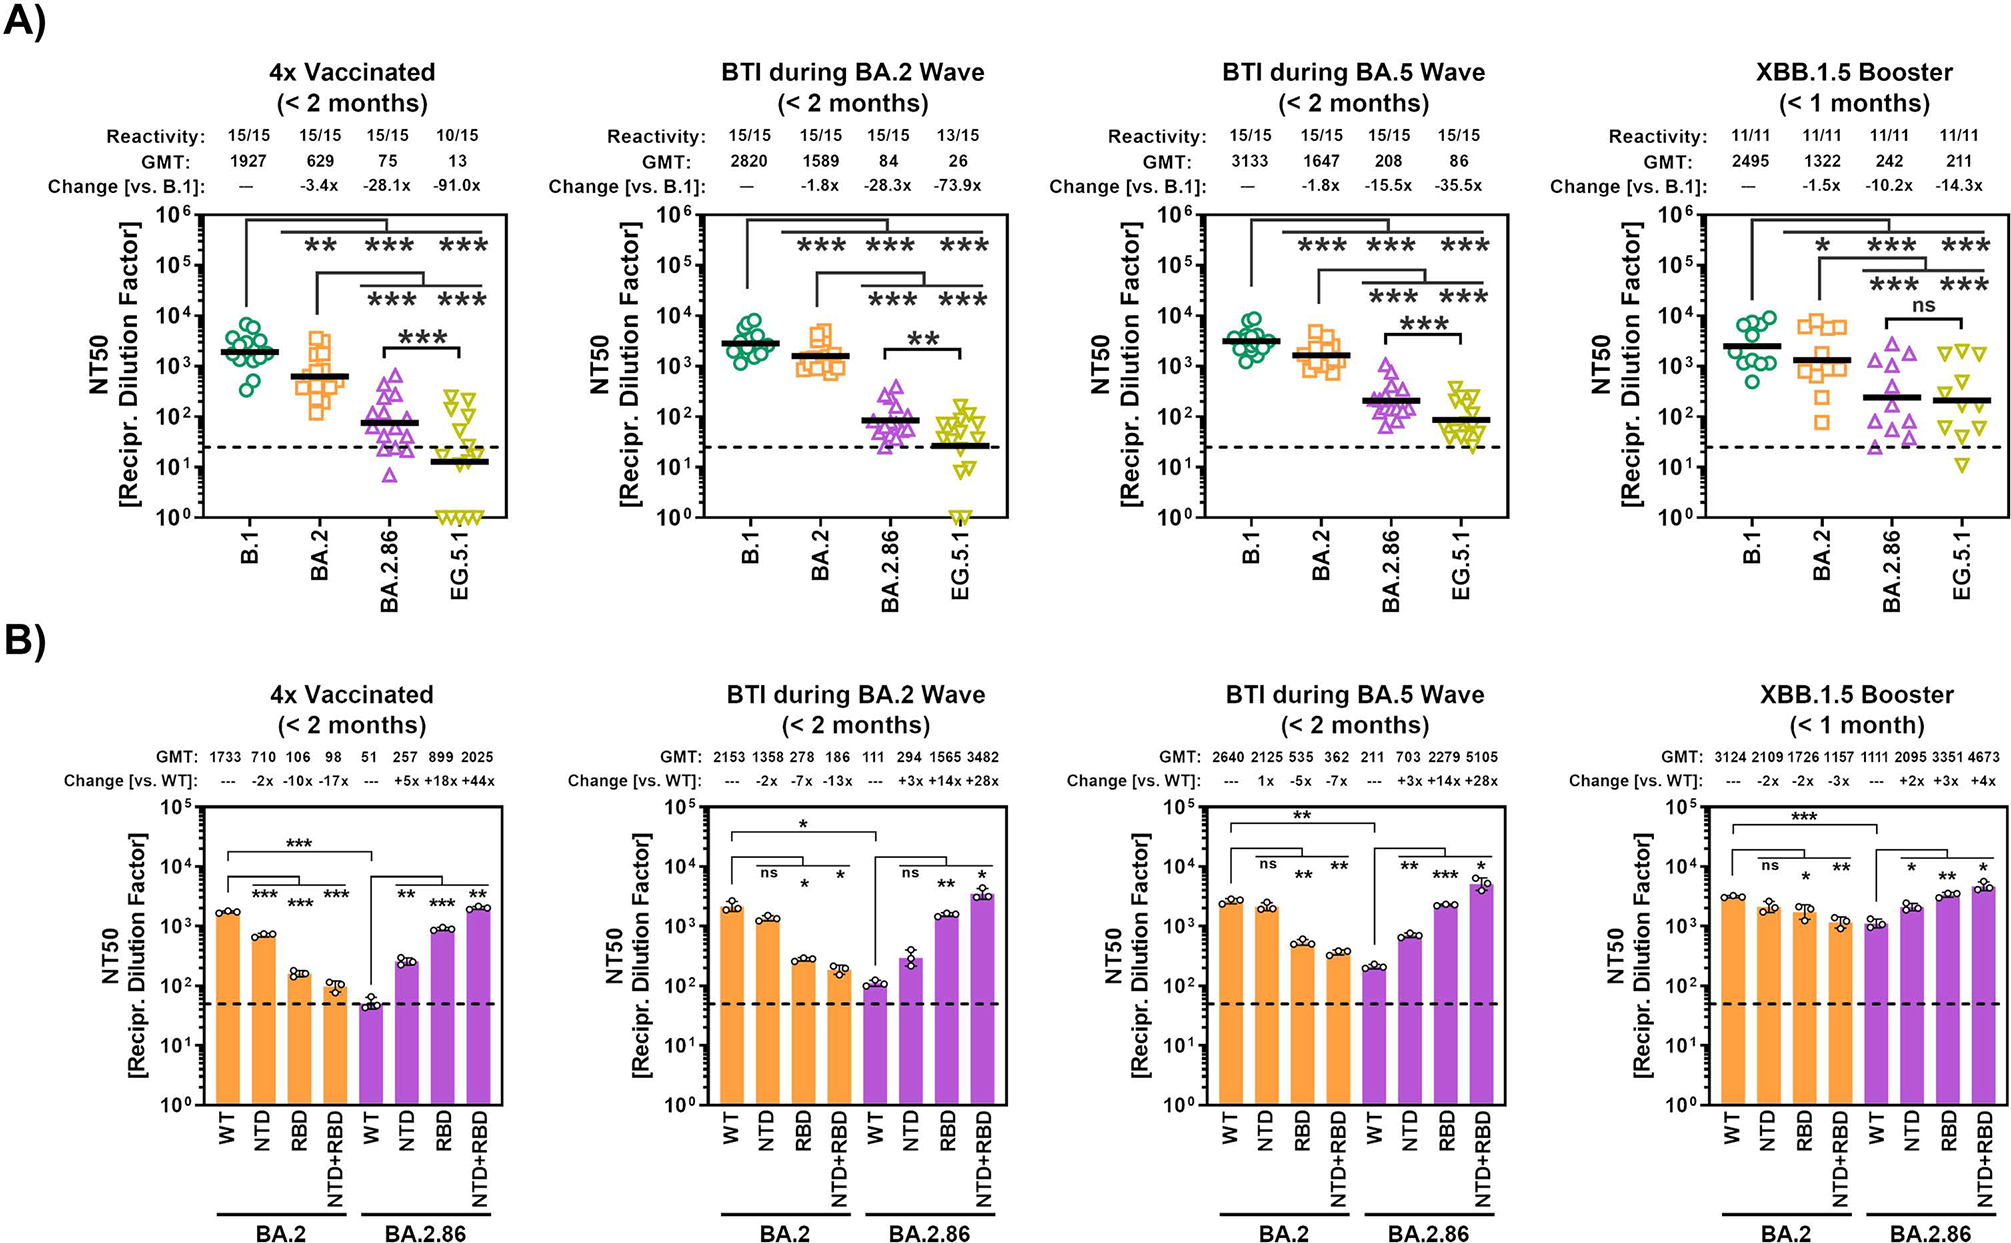
BA.2.86, a recently identified descendant of the severe acute respiratory syndrome coronavirus 2 (SARS-CoV-2) Omicron BA.2 sublineage, contains ∼35 mutations in the spike (S) protein and spreads in multiple countries. Here, we investigated whether the virus exhibits altered biological traits, focusing on S protein-driven viral entry. Employing pseudotyped particles, we show that BA.2.86, unlike other Omicron sublineages, enters Calu-3 lung cells with high efficiency and in a serine- but not cysteine-protease-dependent manner. Robust lung cell infection was confirmed with authentic BA.2.86, but the virus exhibited low specific infectivity. Further, BA.2.86 was highly resistant against all therapeutic antibodies tested, efficiently evading neutralization by antibodies induced by non-adapted vaccines. In contrast, BA.2.86 and the currently circulating EG.5.1 sublineage were appreciably neutralized by antibodies induced by the XBB.1.5-adapted vaccine. Collectively, BA.2.86 has regained a trait characteristic of early SARS-CoV-2 lineages, robust lung cell entry, and evades neutralizing antibodies. However, BA.2.86 exhibits low specific infectivity, which might limit transmissibility.

Keywords: BA.2.86; SARS-CoV-2; Spike protein; TMPRSS2; antibody evasion; fusion; infectivity; lung cell entry; mutations; pirola variant.


Conflict of interest statement

Declaration of interests A.K., I.N., S.P. and M.H. conducted contract research (testing of vaccinee sera for neutralizing activity against SARS-CoV-2) for Valneva unrelated to this work. G.M.N.B. served as advisor for Moderna, and S.P. served as advisor for BioNTech, unrelated to this work. A.D-J. served as advisor for Pfizer, unrelated to this work. The authors declare no competing interests.

Figures

Figure 1.
Figure 1.. The BA.2.86 spike protein mediates robust entry into lung cells
(A) Summary of the mutations found in the S proteins of SARS-CoV-2 lineages B.1, BA.2, BA.2.86, and EG.5.1 compared to the S protein of the Wuhan-Hu-01 isolate (numbering according to the S protein of SARS-CoV-2 Wuhan-Hu-01). Unique S protein mutations in BA.2.86 S compared to BA.2 S are highlighted in red. Minus signs indicate deletions. White boxes highlight identical residues compared to the reference sequence, while blue (non-BA.2.86-specific) and red (only BA.2.86-specific) boxes highlight mutated residues in the S proteins of EG.5.1, BA.2 and BA.2.86. Abbreviations: NTD = N-terminal domain; RBD = receptor-binding domain; pre-S1/S2 and S2’ = sequence between RBD and S1/S2 site. (B) Effector 293T cells cotransfected to express the indicated S proteins (or no S protein) and the beta-galactosidase alpha fragment were co-cultured with 293T target cells transfected to co-express ACE2 and the beta-galactosidase omega fragment. After 18 h, the cells were incubated for 90 min in the presence of beta galactosidase substrate, before cell-cell fusion was analyzed by measuring the activity of reconstituted beta galactosidase enzyme. The mean data from four biological replicates performed with three technical replicates are shown. Error bars indicate the SEM. Data were normalized against fusion induced by B.1 S (set as 1, dashed line). Statistical significance was assessed by two-tailed Student’s t-test (not significant [ns], p > 0.05; *, p ≤ 0.05; **, p ≤ 0.01; ***, p ≤ 0.001). Please see also supplementary figure S2A–B. (C) Particles pseudotyped with the indicated S proteins were inoculated onto 293T (human, kidney), Vero (African green monkey, kidney), Vero-ACE2+TMPRSS2 (African green monkey, kidney, stably expressing ACE2 and TMPRSS2), Huh-7 (human, liver), Caco-2 (human, colon) and Calu-3 (human, lung) cells and cell entry was analyzed at 16–18 h postinoculation by measuring the activity of virus-encoded firefly luciferase in cell lysates. The mean data from six biological replicates are shown, each replicate was performed with four technical replicates. Error bars indicate the standard error of the mean (SEM). Data were normalized against cell entry of B.1pp (set as 1, dashed line). Statistical significance was assessed by two-tailed Student’s t-test (not significant [ns], p > 0.05; *, p ≤ 0.05; **, p ≤ 0.01; ***, p ≤ 0.001). Please also see supplementary figure S2C–F. (D) 293T cells transfected to express the indicated S proteins (or no S protein) were sequentially incubated with soluble ACE2 harboring a C-terminal Fc-tag derived from human IgG and AlexaFlour-488-conjugated antihuman antibody. Binding of ACE2 to S protein expressing cells was analyzed by flow cytometry and the geometric mean channel fluorescence was measured. Cells that did not express any S protein served as control. The mean data from six biological replicates conducted with single samples are shown. Data were normalized against B.1 (set as 1, dashed line) and error bars indicate the SEM. Statistical significance was assessed by two-tailed Student’s t-test (not significant [ns], p > 0.05; *, p ≤ 0.05; **, p ≤ 0.01; ***, p ≤ 0.001). Please also see supplementary figure S2G. (E) Vero cells were pretreated with different concentrations of anti-ACE2 antibody and subsequently inoculated with pseudovirus particles bearing the indicated S proteins or VSV-G. Cell entry was analyzed at 16–18 h postinoculation as described above. Presented are the normalized mean data from three biological replicates (performed with four technical replicates). For normalization, S protein-driven entry into cells that were not exposed to anti-ACE2 antibody was set as 100%. Error bars represent the SEM. Statistical significance was assessed by two-way analysis of variance with Tukey’s posttest (not significant [ns], p > 0.05; *, p ≤ 0.05; **, p ≤ 0.01; ***, p ≤ 0.001). Please also see supplementary figure S2H.
Figure 2.
Figure 2.. BA.2.86 entry into Calu-3 lung cells is TMPRSS2-dependent and determined by both NTD and RBD
(A) Vero or Calu-3 cells were preincubated for 1 h at 37 °C with medium contain different concentrations of either MDL28170 or Camostat (or DMSO, control), before pseudovirus particles were added. Cell entry was analyzed at 16–18 h postinoculation as described in the legend of figure 1. Presented are the normalized mean data from three biological replicates (performed with four technical replicates). For normalization, S protein-driven entry into cells that were not exposed to inhibitor was set as 100%. Error bars represent the SEM. Statistical significance was assessed by two-tailed Student’s t-test (ns, p > 0.05; *, p ≤ 0.05; **, p ≤ 0.01; ***, p ≤ 0.001). Abbreviation: ND, not determinable. (B) The inhibitor concentration leading to half-maximal inhibition of pseudovirus entry into target cells (effective concentration 50, EC50) was calculated based on the data shown in panel A. Presented are the normalized mean data from three biological replicates (performed with four technical replicates). Error bars represent the SEM. (C) Schematic illustration of chimeric BA.2 and BA.2.86 S proteins in which either the NTD, RBD or both are interchanged. (D) Particles pseudotyped with the indicated wildtype or chimeric S proteins were inoculated onto Vero and Calu-3 cells. Cell entry was analyzed at 16–18 h postinoculation as described in the legend of figure 1. Presented are the normalized mean data from six biological replicates (performed with four technical replicates). Error bars indicate the SEM. Data were normalized against cell entry of B.1pp (set as 1, dashed line). Statistical significance was assessed by two-tailed Student’s t-test (ns, p > 0.05; *, p ≤ 0.05; **, p ≤ 0.01; ***, p ≤ 0.001). Please also see supplementary figure S3A and B.
Figure 3.
Figure 3.. Authentic BA.2.86 efficiently infects lung cells but exhibits low specific infectivity
(A) Calu-3 cells were inoculated with the indicated SARS-CoV-2 lineages (MOI = 0.01). At six days postinoculation, cells were fixed, stained with crystal violet and analyzed for cytopathic effect formation by microscopy. Presented are representative microscopic images from three biological replicates (magnification = 10X). (B) Calu-3 cells were inoculated with the indicated SARS-CoV-2 lineages (MOI = 0.01) and viral genomes released into the cell culture supernatant at 24, 48 and 72 h were quantified by qRT-PCR. The mean data from three biological replicates are shown. Error bars indicate the SD. Abbreviation: GE, genome equivalents. (C) Calu-3 cells were inoculated with the indicated SARS-CoV-2 lineages (MOI = 0.01) and infectious virus released into the cell culture supernatant at 24, 48 and 72 h was quantified by plaque titration on Vero E6 cells. The mean data from three biological replicates are shown (Threshold = 1 plaque). Error bars indicate the SD. Abbreviation: PFU, plaque forming units. (D) The specific infectivity of the indicated SARS-CoV-2 lineages was assessed based on the GE/PFU ratio. Graphs show mean GE/PFU ratios from three biological replicates. Error bars indicate the SD. For panels B, C and D, Statistical significance was assessed by two-tailed Student’s t-test (ns, p > 0.05; *, p ≤ 0.05; **, p ≤ 0.01; ***, p ≤ 0.001).
Figure 4.
Figure 4.. BA.2.86 efficiently evades neutralization by therapeutic monoclonal antibodies
(A) Molecular footprint of therapeutic monoclonal antibodies (blue) on the SARS-CoV-2 RBD (grey). Footprint residues that are mutated in the context of BA.2.86 are highlighted (pink). Please also see supplementary figure S4. (B) Particles pseudotyped with the indicated S proteins were preincubated (30 min, 37 °C) with the indicated concentrations of recombinant monoclonal antibodies before being inoculated onto Vero cells. S protein-driven cell entry was analyzed at 16–18 h postinoculation by measuring the activity of virus-encoded firefly luciferase in cell lysates. Presented are the mean from three biological replicates (each conducted with four technical replicates) in which S protein-driven cell entry in the absence of antibody was set as 0% inhibition. Please also see supplementary table S1.
Figure 5.
Figure 5.. BA.2.86 efficiently evades neutralization by antibodies induced upon vaccination or breakthrough infection
(A) Particles pseudotyped with the indicated S proteins were preincubated with plasma dilutions of people vaccinated with four doses of COVID-19 vaccines (n = 15, cohort 1), vaccinated with three vaccine doses and subsequent infection during the BA.2 wave in Germany (n = 15, cohort 2), vaccinated with three to four vaccine doses and subsequent infection during the BA.5 wave in Germany (n = 15, cohort 3), or vaccinated with the XBB.1.5-adapted booster vaccine (n = 11, cohort 4). Next, mixtures were inoculated onto Vero cells and inhibition of cell entry was analyzed at 16–18 h postinoculation as described above. Relative inhibition of pseudovirus entry was calculated using particles incubated in the absence of plasma as control (= 0% inhibition) and NT50 (neutralizing titer 50) values were calculated using a non-linear regression model. Samples that yielded NT50 values below 6.25 were considered negative and manually assigned an NT50 value of 1. The geometric mean NT50 data (GMT, indicate by black lines and numerical values on top of the graphs) from a single experiment, performed with four technical replicates are shown. The proportion of samples with detectable neutralizing activity as well as the fold change in neutralization compared to B.1 are indicated. Statistical significance was assessed by Wilcoxon matched-pairs signed rank test (ns, p > 0.05; *, p ≤ 0.05; **, p ≤ 0.01; ***, p ≤ 0.001). Please also see supplementary table S2 and supplementary figure 5 for more information. (B) Particles pseudotyped with the indicated wildtype or chimeric S proteins were preincubated with cohort-specific pooled plasma dilutions and neutralization efficiency was analyzed as described for panel A. Data represent GMT with geometric mean SD from three biological replicates (each biological replicate conducted with four technical replicates). Statistical significance was assessed by two-tailed Student’s t-test (ns, p > 0.05; *, p ≤ 0.05; **, p ≤ 0.01; ***, p ≤ 0.001).

Similar articles

Cited by

References

    1. Parums DV (2023). Editorial: A Rapid Global Increase in COVID-19 is Due to the Emergence of the EG.5 (Eris) Subvariant of Omicron SARS-CoV-2. Med Sci Monit 29, e942244. 10.12659/MSM.942244. - DOI - PMC - PubMed
    1. Yue C, Song W, Wang L, Jian F, Chen X, Gao F, Shen Z, Wang Y, Wang X, and Cao Y (2023). ACE2 binding and antibody evasion in enhanced transmissibility of XBB.1.5. Lancet Infect Dis 23, 278–280. 10.1016/S1473-3099(23)00010-5. - DOI - PMC - PubMed
    1. Hoffmann M, Arora P, Nehlmeier I, Kempf A, Cossmann A, Schulz SR, Morillas Ramos G, Manthey LA, Jack HM, Behrens GMN, and Pohlmann S (2023). Profound neutralization evasion and augmented host cell entry are hallmarks of the fast-spreading SARS-CoV-2 lineage XBB.1.5. Cell Mol Immunol 20, 419–422. 10.1038/s41423-023-00988-0. - DOI - PMC - PubMed
    1. Addetia A, Piccoli L, Case JB, Park YJ, Beltramello M, Guarino B, Dang H, de Melo GD, Pinto D, Sprouse K, et al. (2023). Neutralization, effector function and immune imprinting of Omicron variants. Nature. 10.1038/s41586-023-06487-6. - DOI - PMC - PubMed
    1. Zhang L, Kempf A, Nehlmeier I, Cossmann A, Dopfer-Jablonka A, Stankov MV, Schulz S, Jack HM, Behrens GMN, Pöhlmann S, and Hoffmann H (In press). Neutralisation sensitivity of SARS-CoV-2 lineages EG.5.1 and XBB.2.3. Lancet Infect Dis. - PubMed

Publication types

Supplementary concepts

LinkOut - more resources