

Comparative transcriptome analysis of the antenna and proboscis reveals feeding state-dependent chemosensory genes in Eupeodes corollae
- PMID: 38195061
- PMCID: PMC10776234
- DOI: 10.1098/rsob.230208
Comparative transcriptome analysis of the antenna and proboscis reveals feeding state-dependent chemosensory genes in Eupeodes corollae
Abstract
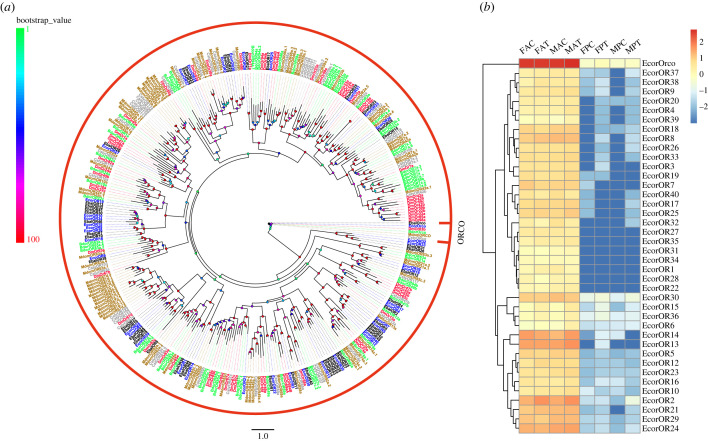
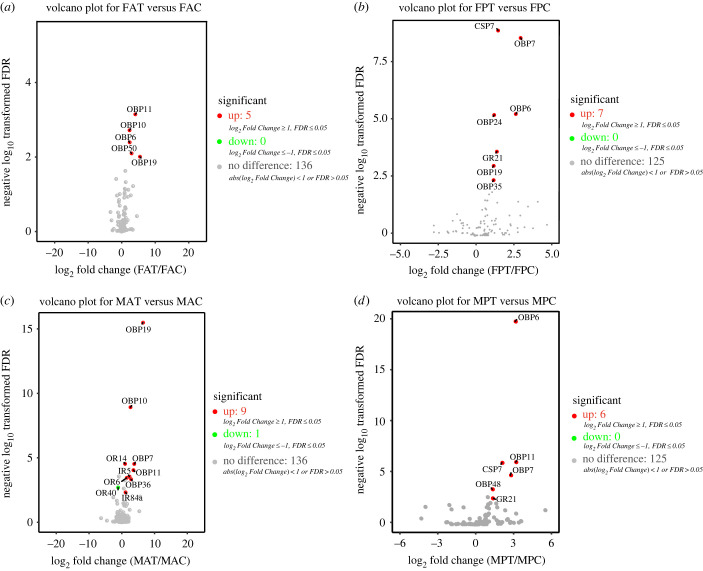
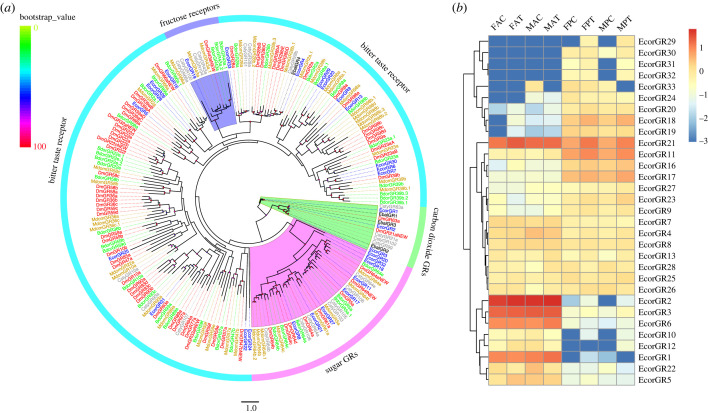
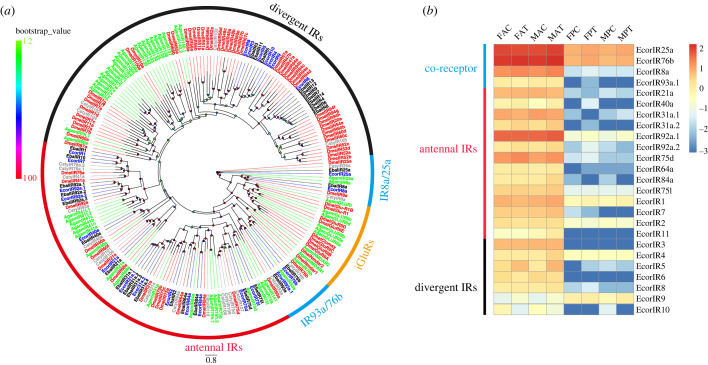
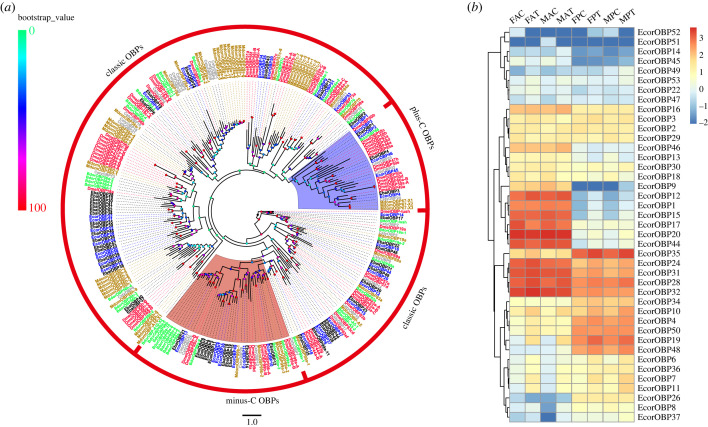
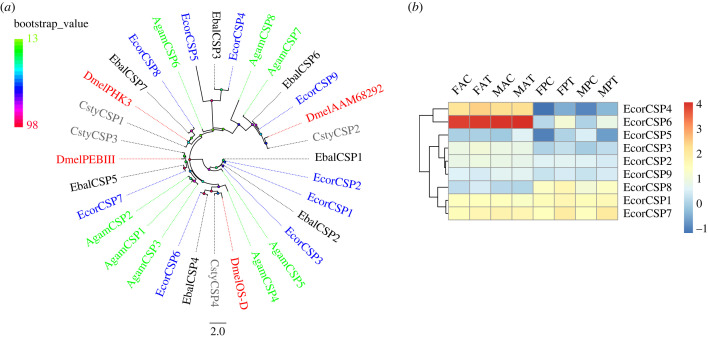
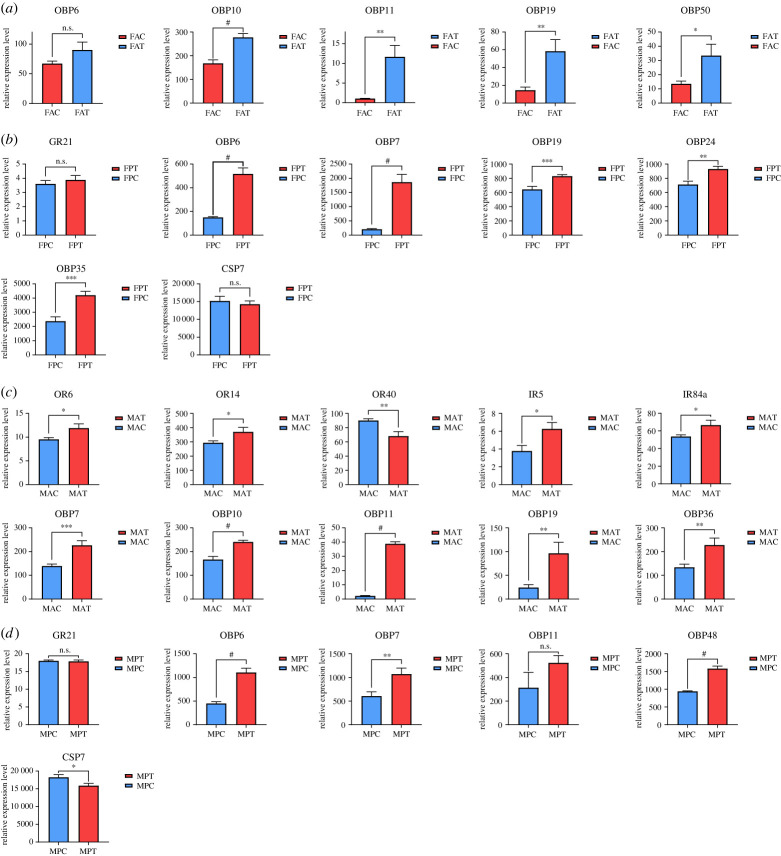
The physiological state of an insect can affect its olfactory system. However, the molecular mechanism underlying the effect of nutrition-dependent states on odour-guided behaviours in hoverflies remains unclear. In this study, comparative transcriptome analysis of the antenna and proboscis from Eupeodes corollae under different feeding states was conducted. Compared with the previously published antennal transcriptome, a total of 32 novel chemosensory genes were identified, including 4 ionotropic receptors, 17 gustatory receptors, 9 odorant binding proteins and 2 chemosensory proteins. Analysis of differences in gene expression between different feeding states in male and female antennae and proboscises revealed that the expression levels of chemosensory genes were impacted by feeding state. For instance, the expression levels of EcorOBP19 in female antennae, EcorOBP6 in female proboscis, and EcorOR6, EcorOR14, EcorIR5 and EcorIR84a in male antennae were significantly upregulated after feeding. On the other hand, the expression levels of EcorCSP7 in male proboscis and EcorOR40 in male antennae were significantly downregulated. These findings suggest that nutritional state plays a role in the adaptation of hoverflies' olfactory system to food availability. Overall, our study provides important insights into the plasticity and adaptation of chemosensory systems in hoverflies.
Keywords: Eupeodes corollae; chemosensory-related genes; feeding state; mRNA sequencing; olfactory plasticity.
Conflict of interest statement
We declare we have no competing interests.
Figures
Similar articles
-
Chemosensory genes in the antennal transcriptome of two syrphid species, Episyrphus balteatus and Eupeodes corollae (Diptera: Syrphidae).BMC Genomics. 2017 Aug 7;18(1):586. doi: 10.1186/s12864-017-3939-4. BMC Genomics. 2017. PMID: 28784086 Free PMC article.
-
Characterization of antennal chemosensilla and associated odorant binding as well as chemosensory proteins in the Eupeodes corollae (Diptera: Syrphidae).J Insect Physiol. 2019 Feb-Mar;113:49-58. doi: 10.1016/j.jinsphys.2018.08.002. Epub 2018 Aug 3. J Insect Physiol. 2019. PMID: 30080999
-
Identification and Expression Analysis of Putative Chemosensory Receptor Genes in Microplitis mediator by Antennal Transcriptome Screening.Int J Biol Sci. 2015 May 16;11(7):737-51. doi: 10.7150/ijbs.11786. eCollection 2015. Int J Biol Sci. 2015. PMID: 26078716 Free PMC article.
-
Antennal transcriptome analysis of the chemosensory gene families in Carposina sasakii (Lepidoptera: Carposinidae).BMC Genomics. 2018 Jul 20;19(1):544. doi: 10.1186/s12864-018-4900-x. BMC Genomics. 2018. PMID: 30029592 Free PMC article.
-
Chemoreception of Mouthparts: Sensilla Morphology and Discovery of Chemosensory Genes in Proboscis and Labial Palps of Adult Helicoverpa armigera (Lepidoptera: Noctuidae).Front Physiol. 2018 Aug 7;9:970. doi: 10.3389/fphys.2018.00970. eCollection 2018. Front Physiol. 2018. PMID: 30131703 Free PMC article.
Cited by
-
The expansion and loss of specific olfactory genes in relatives of parasitic lice, the stored-product psocids (Psocodea: Liposcelididae).BMC Genomics. 2025 Jan 15;26(1):41. doi: 10.1186/s12864-025-11231-7. BMC Genomics. 2025. PMID: 39815200 Free PMC article.
-
MCMV-infected maize attracts its insect vector Frankliniella occidentalis by inducing β-myrcene.Front Plant Sci. 2024 Aug 21;15:1404271. doi: 10.3389/fpls.2024.1404271. eCollection 2024. Front Plant Sci. 2024. PMID: 39233912 Free PMC article.
References
MeSH terms
Substances
LinkOut - more resources
Full Text Sources
