. 2024 Jan 9;15(1):383.
doi: 10.1038/s41467-023-44556-6.

The aging mouse CNS is protected by an autophagy-dependent microglia population promoted by IL-34

Affiliations

The aging mouse CNS is protected by an autophagy-dependent microglia population promoted by IL-34

Rasmus Berglund et al. Nat Commun. .

Abstract

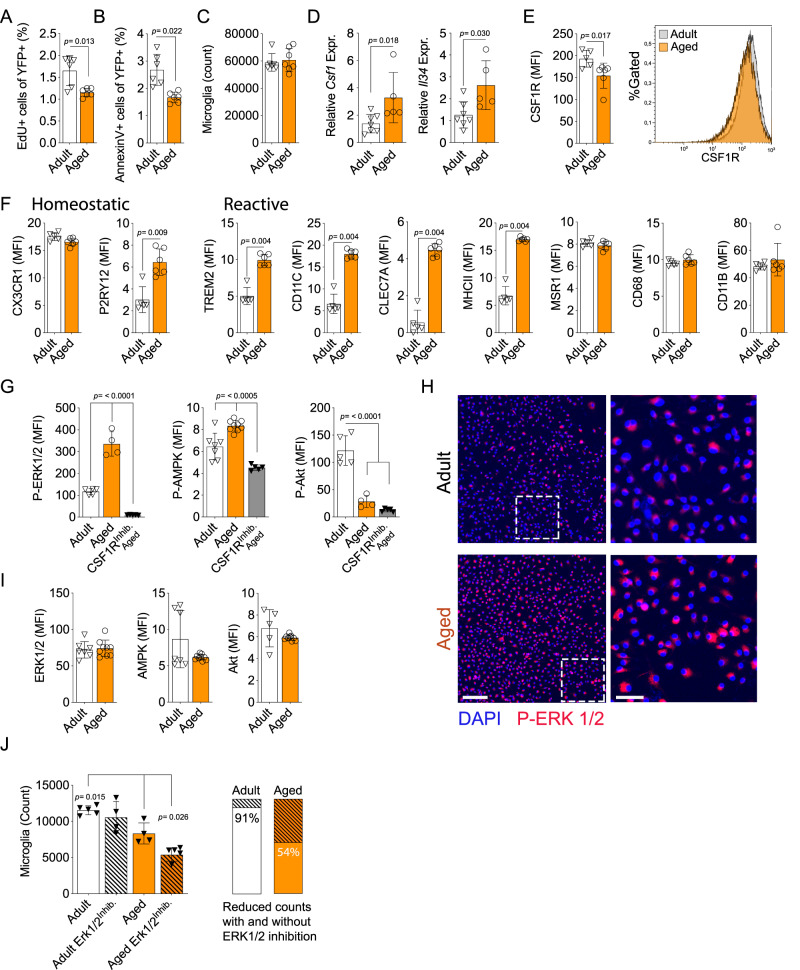
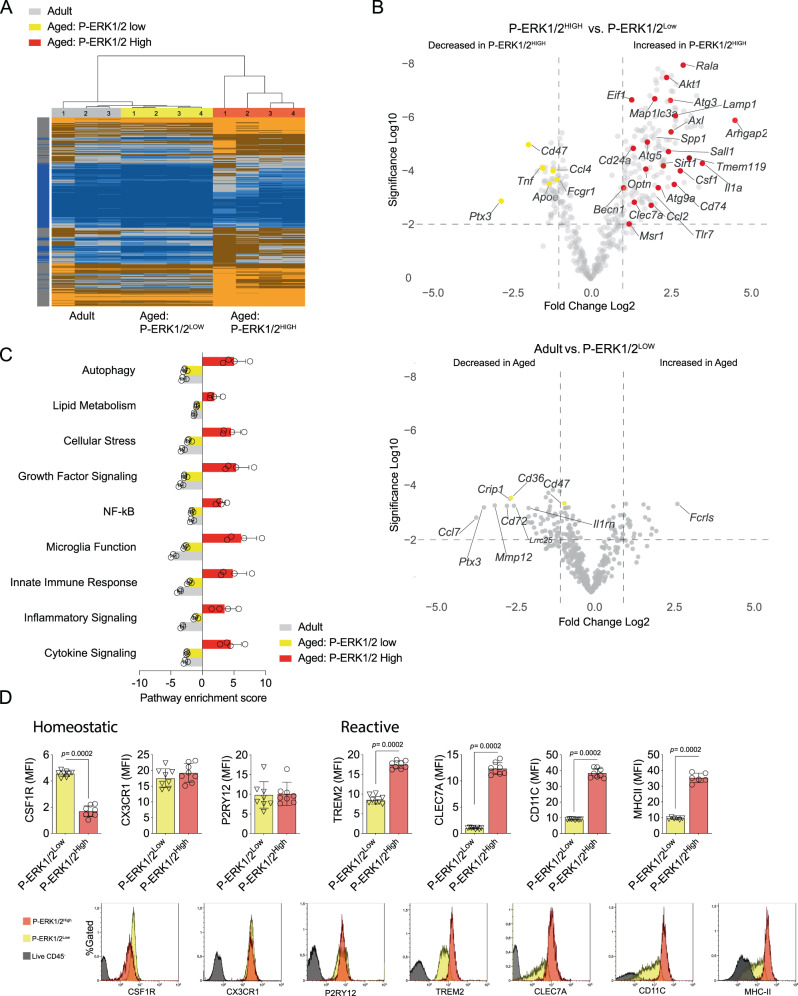
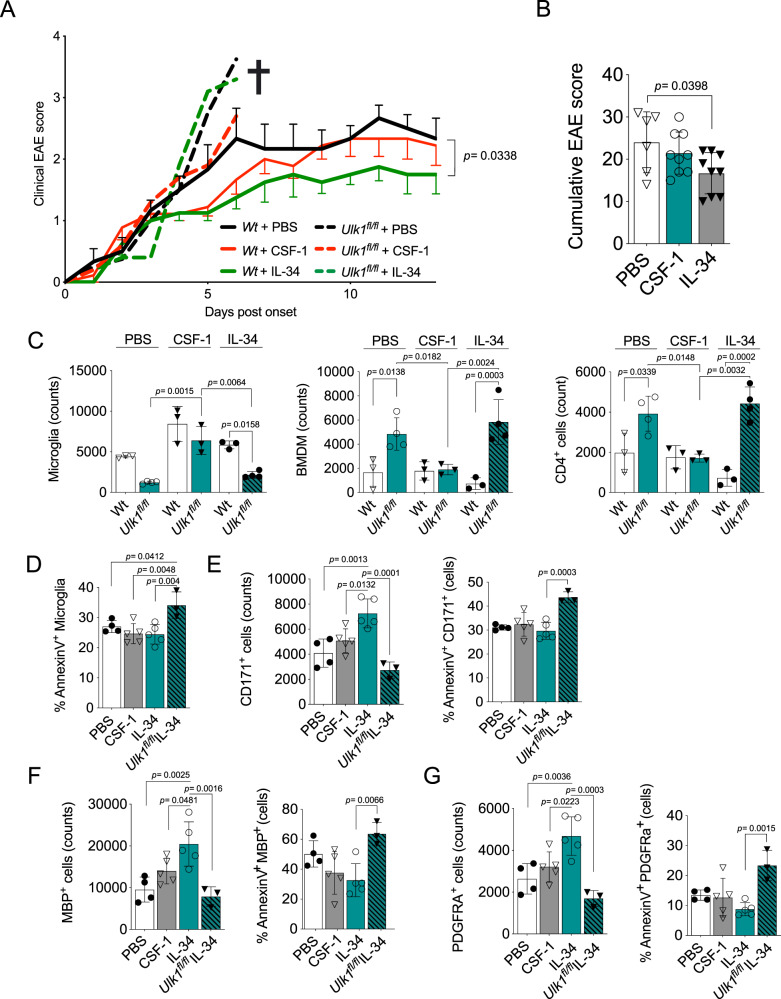
Microglia harness an unutilized health-promoting potential in age-related neurodegenerative and neuroinflammatory diseases, conditions like progressive multiple sclerosis (MS). Our research unveils an microglia population emerging in the cortical brain regions of aging mice, marked by ERK1/2, Akt, and AMPK phosphorylation patterns and a transcriptome indicative of activated autophagy - a process critical for cellular adaptability. By deleting the core autophagy gene Ulk1 in microglia, we reduce this population in the central nervous system of aged mice. Notably, this population is found dependent on IL-34, rather than CSF1, although both are ligands for CSF1R. When aging mice are exposed to autoimmune neuroinflammation, the loss of autophagy-dependent microglia leads to neural and glial cell death and increased mortality. Conversely, microglial expansion mediated by IL-34 exhibits a protective effect. These findings shed light on an autophagy-dependent neuroprotective microglia population as a potential target for treating age-related neuroinflammatory conditions, including progressive MS.


Conflict of interest statement

The authors declare no competing interests.

Figures

Fig. 1
Fig. 1. Aged CNS is characterized by a reduced turnover of microglia and an altered CSF1R axis.
AC Microglia proliferation, apoptosis and total numbers, respectively, assessed by flow cytometry after three EdU i.p. injections days 5, 3 and 1 before analysis (adult, n = 5; aged, n = 6). D CNS mRNA expression of Csf1 and Il34 normalized to Hprt and B-actin (adult n = 7; aged n = 5). E, F Microglia surface marker density assessed ex vivo by flow cytometry (adult, n = 5; aged, n = 4). G Microglia phosphorylation status assessed ex vivo after 4 h culture in CSF-1 enriched medium in the presence or absence of the CSF1R inhibitor PLX3397 (P-ERK1/2 and P-Akt adult, n = 5; aged, n = 4; CSF-1Inhib, n = 5. P-AMPK; adult, n = 7; aged, n = 9; CSF-1Inhib, n = 5). H Immunocytochemistry images of freshly isolated microglia of young and old mice showing expression of phosphorylated ERK (red) and nuclei (DAPI; blue). Scale bars correspond to 500 μm (left) and 50 μm (right). I Total intracellular content of target proteins in freshly isolated microglia assessed by flow cytometry PLX3397 (P-ERK1/2 and P-AMPK adult, n = 7; aged, n = 9. P-Akt; adult, n = 5; aged, n = 9; CSF-1Inhib, n = 5). J Microglia cell count after 72 h in vitro culture w/wo ERK1/2 inhibitor SCH772984. Bars to the right show percentual decrease in striped areas (all conditions n = 5 except “Adult CSF1RInhib and Aged, n = 4). Adult mice were 3-5 months old, aged mice were >20 months old. AE and G showing representative data from three independent experiments. F, I and J showing representative data from two independent experiments. AF and I Mann-Whitney Two-tailed U-test. G and J One-way Anova followed by Tukeys post-hoc test. Error bars represent mean + SD. Source data are provided as a Source Data file.
Fig. 2
Fig. 2. The microglia of the aged CNS with reactive ERK1/2 pathway have a distinct transcriptional profile of microglial functionality.
A Transcriptome heatmap of normalized expression of all genes (770) analyzed by NanostringTM nCounter (adult n = 4; aged P-ERK1/2Low, n = 4; aged P-ERK1/2High, n = 4). B Volcano plot of differentially expressed genes (Log2 > 1, p < Log10-2) comparing aged P-ERK1/2Low to P-ERK1/2High (upper) and aged ERK1/2Low to unsorted adult (lower) microglia. Populations described in A. C nSolverTM pathway transcriptome analysis of microglia populations described in A. D Microglial surface receptor density quantified ex vivo by flow cytometry in aged Wt subpopulations based on P-ERK1/2 (Thr202/Tyr204). (All n = 8). Adult mice were 3-5-month-old, <1 month post-Tamoxifen treatment, Aged mice were >20 months old, >18 months post Tamoxifen treatment. D Mann-Whitney Two-tailed U-test. Error bars represent mean + SD. Source data are provided as a Source Data file.
Fig. 3
Fig. 3. Deficiency in canonical autophagy protein ULK1 leads to loss of an age-acquired microglial subpopulation.
A, B Immunocytochemistry images and quantification of microglial P-ERK1/2 high cells (Adult CSF-1 treated, n = 4; Adult IL-34 treated, n = 4; Aged CSF-1 treated, n = 6; Aged IL-34 treated, n = 6). Zoomed image with individual channels are found in supplementary fig. 2. Scale bars correspond to 50 μm. C Zoomed images shown in A with arrows indicating P-ERK1/2High cells (left) and one cell with arrows indicating structures detected as LC3B+ autophagosomes (right). D Quantification of LC3B+ autophagosomal structures in microglia defined by the P-ERK1/2 level. Representative images shown in A. E Microglial counts and AKT and ERK1/2 phosphorylation state at targeted sites assessed by flow cytometry. F Quantification of microglia populations by flow cytometry as shown in E (Adult Wt, n = 5; Adult Ulk1fl/fl, n = 4; Aged Wt, n = 5; Aged Ulk1fl/fl, n = 4) based on P-ERK1/2 (Thr202/Tyr204). G Akt (Ser473) phosphorylation in the P-ERK1/2-positive populations (Both groups n = 4) quantified by flow cytometry. H Microglia proliferation assessed by ex vivo Ki67+ staining and flow cytometry (Both groups n = 5). Adult mice were 3-5-month-old, <1 month post-Tamoxifen treatment, Aged mice were >20 months old, >18 months post Tamoxifen treatment. Ulk1fl/fl refer to Ulk1fl/fl CX3CR1CreERT2 and Wt to Ulk1wt/wt CX3CR1CreERT2. A, B and G showing representative data of two independent experiments. CF showing representative data of three independent experiments. B, C and E One-way Anova followed by Tukey post-hoc test. FG Mann-Whitney Two-tailed U-test. Error bars represent mean + SD. Source data are provided as a Source Data file.
Fig. 4
Fig. 4. The loss of the reactive ADAM subpopulation is not compensated by other cells.
A, B Microglia proliferation and apoptosis assessed by flow cytometry after three EdU+ i.p. injections in vivo days 5, 3 and 1 before analysis (adult, n = 6; aged, n = 6). C, D Immunocytochemistry images and quantification of CHOP positive ex vivo microglia cultured for 16 h. DAPI defines nuclei (Wt, n = 5; Ulk1fl/fl, n = 5). Scale bars correspond to 1000 μm (left) and 25 μm (right). E, F Flow cytometry density plots and quantification of CNS CD45+ populations (Wt, n = 5; Ulk1fl/fl, TAM < 1 month n = 4; Ulk1fl/fl TAM > 20 months n = 5) where CD45Intermediate YFP+ represent microglia targeted by the Tamoxifen induced Ulk1 deletion. The YFP+ CD45High populations are considered bone marrow-derived myeloid cells and YFP- CD45+ other immune cells. G, H Immunohistochemistry images and quantification of microglia in white and gray matter (shown in images) in brain and spinal cord regions (Brain, Wt, n = 5; Ulk1fl/fl, n = 4, spinal cord, Wt, n = 4; Ulk1fl/fl, n = 4). Scale bars correspond to 100 μm. Zoomed image with individual channels and images of spinal cords and white matter regions are found in supplementary fig. 2. I Quantification of MFI in microglia subpopulations from grey matter Wt images shown in H. J CNS mRNA expression of Csf1 and Il34 normalized to Hprt (CSF-1 Wt and Ulk1fl/fl, n = 5; Il34 Wt, n = 7; Ulk1fl/fl, n = 4). All experimental subjects AH were aged (>20 months old, >18 months post-Tamoxifen treatment, except C > 20 months, <1 month Tamoxifen treatment). Ulk1fl/fl refer to Ulk1fl/fl CX3CR1CreERT2 and Wt to Ulk1wt/wt CX3CR1CreERT2. A, B and E, F showing representative data of three independent experiments. C and B show data of two independent experiments B, E and HJ. F One-way Anova followed by Bonferroni’s multiple comparisons test. Mann-Whitney Two-tailed U-test. (H). Error bars represent mean + SD. Source data are provided as a Source Data file.
Fig. 5
Fig. 5. IL-34 but not CSF-1 enhance the ADAM population.
A Microglia (CD11b+ CD45Int YFP+) counts from mice treated intrathecally with IL-34, CSF-1 or PBS control (PBS Wt, n = 4; PBS Ulk1fl/fl, n = 5; CSF-1 Wt, n = 3; CSF1 Ulk1fl/fl, n = 3; IL-34 Wt, n = 3; IL-34 Ulk1fl/fl, n = 6). B P-EKR1/2-positive microglia cells as percent of the total microglia population from mice treated as in (A) (PBS Wt, n = 4; CSF-1 Wt, n = 6; IL-34 Wt, n = 4; IL-34 Ulk1fl/fl, n = 4). C BMDM (CD11b+ CD45High) counts from mice treated as in A. D Phosphorylation and total content of target proteins in microglia treated ex vivo with CSF1R ligands individually or with both ligands in the presence of the CSF1R inhibitor PLX3397 (PBS Wt, n = 5; CSF-1 Wt, n = 5; IL-34 Wt, n = 7; CSF1RInhib., n = 5). E Total content of target proteins in microglia treated ex vivo with CSF1R ligands individually (PBS Wt, n = 5; CSF-1 Wt, n = 5; IL-34 Wt, n = 7). F Homeostatic and reactive microglia surface markers assessed by flow cytometry in freshly isolated microglia from mice treated as in A (PBS, n = 4; CSF-1, n = 5; IL-34, n = 7; Ulk1flf- IL-34, n = 5). G CD171+ neurons, MBP+ Oligodendrocytes and PDGFRa+ OPC counts (n = 4 in all conditions). Analyses separated per cell type. All experimental subjects AH were aged (>20 months old, >18 months post-Tamoxifen treatment), all treatments refer to intrathecal administration 5, 3, and 1 day before analysis. Ulk1fl/fl refer to Ulk1fl/fl CX3CR1CreERT2 and Wt to Ulk1wt/wt CX3CR1CreERT2. AD and F showing representative data of three independent experiments. E and G showing representative data of two independent experiments. D and E Kruskal-Wallis followed by Dunn’s multiple comparisons test (A) Two-way Anova followed by Šídák’s multiple comparisons test (B) and (F) One-way Anova followed by Tukey or Bonferroni post-hoc test. G Mann-Whitney Two-tailed U-test. Error bars represent mean + SD. Source data are provided as a Source Data file.
Fig. 6
Fig. 6. Loss of ADAM associates with higher mortality during autoimmune neuroinflammation.
A Survival plots after MOG-induced EAE. B Quantification of microglia numbers, apoptosis and proliferation and CD171+ neurons, MBP+ Oligodendrocytes and PDGFRA+ OPCs numbers and apoptosis at day 7 post-EAE onset (Wt, n = 5; Ulk1fl/fl, n = 5). C Immunohistochemical images (images showing brain lesion areas, unaffected parenchyma is shown in Fig S3B) and analysis of brain and spinal cord sampled day 15 post EAE induction (Wt adult, n = 3 for APP and n = 4 for CD68, Wt aged, n = 6; Ulk1fl/fl aged, n = 8). Scale bars represents 125 μm for APP and 250 μm for CD68 and imaged are 2D renderings of thick Z-stacks. D Immunohistochemical images and analysis of brain and spinal cord sampled day 15 post EAE induction. Black arrowheads indicate inflammatory infiltrates (Wt adult, n = 7, Wt aged, n = 6; Ulk1fl/fl aged, n = 6). Scale bars represent 100 μm in C and 200 μm in D. Adult mice were 3-5-month-old, <1 month post-Tamoxifen treatment, Aged mice were > 20 months old, >18 months post Tamoxifen treatment. Ulk1fl/fl refer to Ulk1fl/fl CX3CR1CreERT2 and Wt to Ulk1wt/wt CX3CR1CreERT2. A and B showing representative data of three independent experiments. A Mantel-cox logrank test of survival curves. B, D Mann-Whitney Two-tailed U-test (C, D) One-way Anova with Tukey posttest. Error bars represent mean + SD. Source data are provided as a Source Data file.
Fig. 7
Fig. 7. IL-34 administration expands ADAM, restricts autoimmune neuroinflammation and reduces its clinical signs.
A Clinical scores (left) and a graphic summary of aged mice with MOG-induced EAE who received intrathecal administration of CSF-1, IL-34 or PBS (Wt-PBS, n = 6; Ulk1fl/fl-PBS n = 6; Wt-CSF-1, n = 6; Ulk1fl/fl-CSF-1 n = 10; Wt-IL-34, n = 6; Ulk1fl/fl-IL-34 n = 8. B Cumulative EAE scores of conditions described in (A) CSF-1, IL-34 or PBS (Wt-PBS, n = 6; Wt-CSF-1, n = 9; Wt-IL-34, n = 9). C Microglia, BMDM and CD4+ T-cell counts day 7 post-EAE onset assessed by flow cytometry. (Wt-PBS, n = 4; Wt-CSF-1, n = 5; Wt-IL-34, n = 5; Ulk1fl/fl-IL-34 n = 3). DG Microglia, CD171+ neurons, MBP+ oligodendrocytes, PDGFRa+ OPCs and their respective AnnexinV+ subpopulations day 7 post-EAE onset assessed by flow cytometry. (Wt-PBS, n = 3; Ulk1fl/fl-PBS n = 4; Wt-CSF-1, n = 3; Ulk1fl/fl-CSF-1 n = 3; Wt-IL-34, n = 3; Ulk1fl/fl-IL-34 n = 4. All experimental subjects (AE) were aged (>20 months old, >18 months post-Tamoxifen treatment), all treatments refer to intrathecal administration 5, 3, and 1 day before disease induction. Ulk1fl/fl refer to Ulk1fl/fl CX3CR1CreERT2 and Wt to Ulk1wt/wt CX3CR1CreERT2. AG showing representative data of three independent experiments. A, B and DG One-way Anova followed by Bonferroni’s, Tukeys or Dunn’s multiple comparisons test. C Two-way Anova followed by Šídák’s multiple comparisons test. Mann-Whitney Two-tailed U-test. Error bars represent mean + SD. Source data are provided as a Source Data file.
Fig. 8
Fig. 8. IL-34 increase neuronal survival In vitro microglia co-cultures.
A In vitro uptake images and quantification of labeled myelin myelin LC3 MFI by microglial subpopulations from the aged CNS (P-ERK1/2Low, n = 4; P-ERK1/2High, n = 4,). Scale bars indicate 250 μm (left) and 25 μm (right). B Counts of live and apoptotic (AnnexinV and/or propidium iodide+) microglia and neurons after 72 h co-culture with sorted aged naïve microglia and respective cytokines (Unstimulated, n = 3; CSF-1 n = 4-6; IL-34, =5; Ulk1fl/fl IL-34, n = 4). C Immunocytochemistry showing Tuj1/NeuN+ neurons and cleaved caspase-3, signaling apoptosis. Conditions as described in A. Scale bars correspond to 500 μm (left) and 50 μm (right). D Quantified live, apoptotic AnnexinV+ and dead Propidium iodide (P.I) Tuj1+ neurons after 72 h stimulation with respective cytokines (all conditions, n = 3). E mRNA expression of Neurotrophic factors in sorted microglia from co-cultures described in A normalized to Hprt (Unstimulated, n = 5; CSF-1 n = 6; IL-34, n = 6; Ulk1fl/fl IL-34, n = 6 for all targets except Igf1, Unstimulated, n = 5; CSF-1 n = 5; IL-34, n = 6; Ulk1fl/fl IL-34, n = 6). F Summarized “ADAM” phenotypes described in Figs. 2–7 in comparison to the autophagy independent P-ERK1/2Low microglia population. A and E showing representative data of two independent experiments. BD showing representative data of three independent experiments. A Mann-Whitney Two-tailed U-test. B and D, E One-way Anova followed by Tukeys or Dunn’s post-hoc test. Error bars represent mean + SD.

References

    1. Ginhoux F, Lim S, Hoeffel G, Low D, Huber T. Origin and differentiation of microglia. Front. Cell Neurosci. 2013;7:45. doi: 10.3389/fncel.2013.00045. - DOI - PMC - PubMed
    1. Basilico B, et al. Microglia shape presynaptic properties at developing glutamatergic synapses. Glia. 2019;67:53–67. doi: 10.1002/glia.23508. - DOI - PubMed
    1. Konishi H, Kiyama H. Microglial TREM2/DAP12 Signaling: A Double-Edged Sword in Neural Diseases. Front. Cell Neurosci. 2018;12:206. doi: 10.3389/fncel.2018.00206. - DOI - PMC - PubMed
    1. Askew K, et al. Coupled proliferation and apoptosis maintain the rapid turnover of microglia in the adult brain. Cell Rep. 2017;18:391–405. doi: 10.1016/j.celrep.2016.12.041. - DOI - PMC - PubMed
    1. Tay TL, et al. A new fate mapping system reveals context-dependent random or clonal expansion of microglia. Nat. Neurosci. 2017;20:793–803. doi: 10.1038/nn.4547. - DOI - PubMed

Publication types

Associated data