. 2024 Jan 9;15(1):410.
doi: 10.1038/s41467-023-44670-5.

Doa10/MARCH6 architecture interconnects E3 ligase activity with lipid-binding transmembrane channel to regulate SQLE

Affiliations

Doa10/MARCH6 architecture interconnects E3 ligase activity with lipid-binding transmembrane channel to regulate SQLE

J Josephine Botsch et al. Nat Commun. .

Abstract

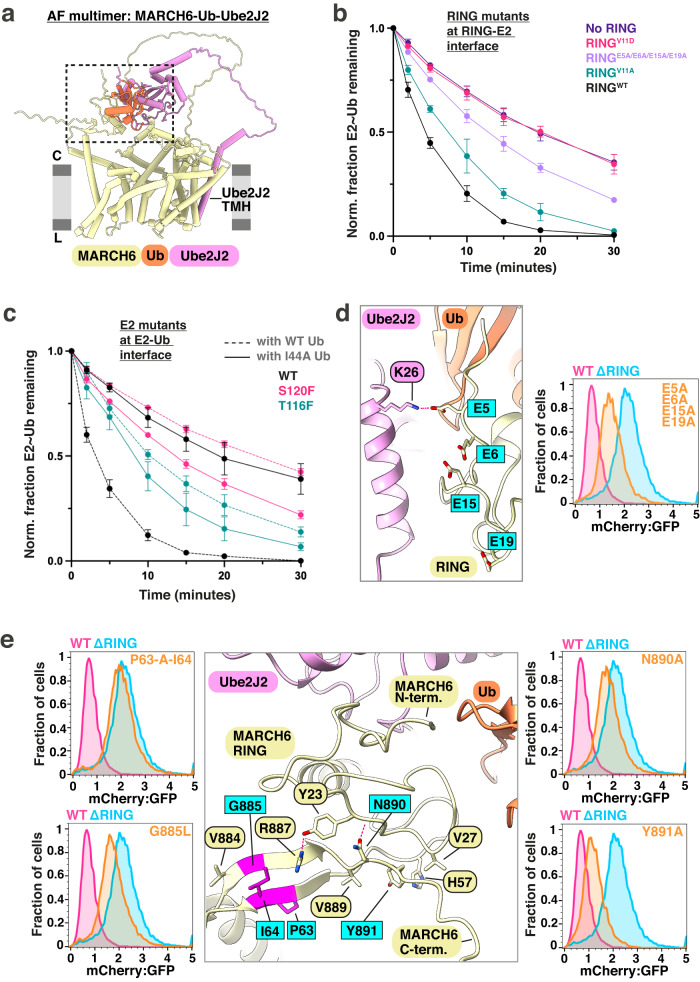
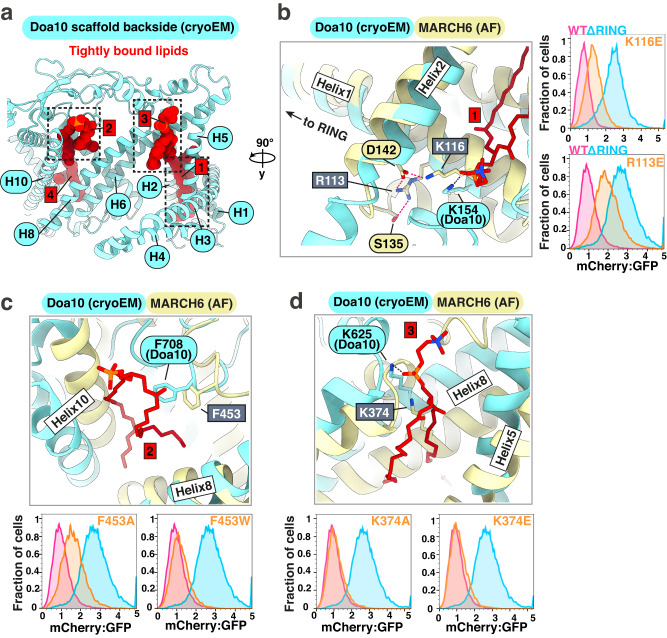
Transmembrane E3 ligases play crucial roles in homeostasis. Much protein and organelle quality control, and metabolic regulation, are determined by ER-resident MARCH6 E3 ligases, including Doa10 in yeast. Here, we present Doa10/MARCH6 structural analysis by cryo-EM and AlphaFold predictions, and a structure-based mutagenesis campaign. The majority of Doa10/MARCH6 adopts a unique circular structure within the membrane. This channel is established by a lipid-binding scaffold, and gated by a flexible helical bundle. The ubiquitylation active site is positioned over the channel by connections between the cytosolic E3 ligase RING domain and the membrane-spanning scaffold and gate. Here, by assaying 95 MARCH6 variants for effects on stability of the well-characterized substrate SQLE, which regulates cholesterol levels, we reveal crucial roles of the gated channel and RING domain consistent with AlphaFold-models of substrate-engaged and ubiquitylation complexes. SQLE degradation further depends on connections between the channel and RING domain, and lipid binding sites, revealing how interconnected Doa10/MARCH6 elements could orchestrate metabolic signals, substrate binding, and E3 ligase activity.


Conflict of interest statement

B.A.S. is adjunct faculty at St. Jude Children’s Research Hospital, Memphis, TN, USA, is on the Scientific Advisory Boards of BioTheryX and Proxygen, and is co-inventor of intellectual property related to DCN1 inhibitors (unrelated to this work) licensed to Cinsano. M.A.S. is co-founder and shareholder of Linkster Therapeutics AG. The remaining authors declare no competing interest.

Figures

Fig. 1
Fig. 1. Overview of the fluorescent SQLE reporter system to track MARCH6 activity in cells.
a Experimental design for depleting MARCH6 and assessing reintroduced ligase mutants’ ability to complement SQLE reporter degradation. The SQLE reporter has a C-terminal mCherry fusion, separated by a P2A sequence from downstream sfGFP. It is stably introduced into K562-dCas9-zim3 CRISPRi cells via lentivirus and sorted as GFP-positive. MARCH6-depleted reporter cells are created using two sgRNAs targeting MARCH6 in a puromycin-resistant lentiviral vector. BFP fluorophore allows virus titering and gating in flow cytometry. WT or mutant MARCH6 is reintroduced via a FLAG-tagged lentiviral vector, generating a homogenous MARCH6-expressing population through blasticidin treatment. miRFP680 enables virus titering and gating in flow cytometry. b SQLE reporter response to cholesterol levels depends on MARCH6. K562-dCas9-zim3 cells with SQLE reporter and stably expressing either N.T. or MARCH6 KD sgRNA were treated with increasing Chl-CD levels for 8 h, then analyzed by flow cytometry. a: mCherry:GFP ratio difference between 0 µM and 20 µM Chl-CD in N.T. cells; b: mCherry:GFP ratio difference between N.T. and MARCH6 KD cells without Chl-CD. Results representative of three independent biological replicates. c SQLE reporter’s dynamic range for detecting MARCH6 mutant defects. K562-dCas9-zim3 cells with SQLE reporter and stable MARCH6-targeting sgRNA expression were transfected with MARCH6WT, MARCH6ΔRING, miRFP680 only (no rescue), or intermediate-defect mutant MARCH6G885L. Post-blasticidin selection, flow cytometry analysis gated on miRFP680-positive cells. Histogram presentation of relative mCherry fluorescence normalized to GFP as an expression control. Results representative of four biological replicates.
Fig. 2
Fig. 2. Cryo-EM analysis of the Doa10-Ubc6 complex reconstituted in lipid nanodiscs.
a Domain map and comparison of Doa10 (top) and MARCH6 (bottom). Residue numbering (blue, Doa10: top, MARCH6: brackets), transmembrane-spanning helices (H1-H15) and domains (colored boxes) are shown for both proteins. Most domains are conserved between Doa10 and MARCH6 including the RING domain, scaffold (with Helix 1) and C-terminal gate helices. The largest differences are localized to a region capping the scaffold domain (Buoy and Cap domain in Doa10, Helix-Loop-Helix (HLH) segment in MARCH6). We were unable to build the long cytoplasmic region between Helix 2 and 3. b High-resolution cryo-EM reconstructions. Left: Side and top view of the high-resolution cryo-EM map of the Doa10-Ubc6 complex at two different overlaid thresholds. The flexible gate and buoy domain are only being visible at lower threshold. Right: Side and top view of the modeled Doa10 structure as cartoon representation within the high-resolution cryo-EM at a very low threshold to see the nanodisc boundaries and any low-resolution density. Dotted grey arrow denotes distance of RING domain to membrane mid-plane (MP). c Side and top view of the low-resolution cryo-EM maps of the Doa10 complex in MSP1E3D1 (left side, ∅ ~ 12.9 nm) or MSP2N2 (right side, ∅ 15-16.5 nm). The silhouette of the high-resolution cryo-EM map of the Doa10 complex at very low threshold is depicted for both maps for better comparison of the flexible parts (red circle). d Comparison of the Doa10 cryo-EM structure (light blue) and the predicted AlphaFold model of human MARCH6 (light yellow). e Non-protein densities surrounding the Doa10 cryo-EM map. Density corresponding to the modeled Doa10 structure is colored in light blue, while unmodeled density is depicted in dark red. The unmodeled density most likely belongs to lipids surrounding the Doa10 complex within the lipid nanodisc. f Tightly bound lipids in the Doa10 cryo-EM model. Four bound lipids are depicted as spheres and colored in dark red. A close-up of the areas with tightly bound lipids shows the density for those lipids as dark red mesh. Doa10 helices in close proximity to the lipids are numbered.
Fig. 3
Fig. 3. A broad mutagenesis campaign across MARCH6 uncovers functionally important regions for SQLE degradation.
a Normalized median mCherry:GFP ratios for each MARCH6 mutant mapped onto AF prediction in fluorescent SQLE reporter cells. The predicted model displays targeted residues as spheres, colored by normalized mCherry:GFP ratio (MARCH6ΔRING as 100% defective, MARCH6WT as 0% defective). Severe defects are colored dark green, intermediate defects are shown in light green, light rose indicates levels comparable to WT, and purple marks GOF mutants. The ER lipid bilayer is schematically shown in grey (C = cytosol, L = ER lumen). b Bar graph showing normalized median mCherry:GFP ratios for each MARCH6 variant in SQLE reporter cells. Ratios normalized to MARCH6WT (0%) and MARCH6ΔRING (100%). Bars are colored by mutant categories discussed in the main text. The X-axis shows mutant numbering, which is detailed in the Supplementary Data 3. Mean, standard error of the mean (SEM) as error bars and individual data points for each mutant are shown. Statistical analysis including mean of the mCherry:GFP ratio, SEM, number of replicates and P values of the ANOVA pairwise comparison of the median mCherry:GFP ratios of each mutant to WT are listed in the Supplementary Data 3. Mutants discussed in the text are labeled. Source data are provided as a Source Data file.
Fig. 4
Fig. 4. Positioning of the MARCH6 RING domain above a membrane channel by N- and C-terminal elements.
a AF multimer model of the ternary MARCH6-ubiquitin(Ub)-UBE2J2 complex. Membrane boundaries are shown in grey, the UBE2J2 TMH is emphasized and the catalytic moieties are encircled by a black box. b Discharge of the loaded UBE2J2 catalytic domain with ubiquitin (UBE2J2~Ub) is stimulated by the isolated MARCH6 RING domain in vitro. The normalized fraction of remaining UBE2J2~Ub is shown for seven time points (0–30 min). Discharge for WT RING domain, no RING domain and three RING domain mutants (V11A, V11D, E5A/E6A/E15A/E19A) are depicted. Error bars present the SEM. Three independent experiments were conducted. Source data is provided in Supplementary Fig. 8b and Source Data file. c Mutants at the interface of UBE2J2 and ubiquitin are important for ubiquitin discharge in vitro. Comparison of WT UBE2J2 and two mutants (T116F and S120F) with either WT ubiquitin (dashed line) or I44A ubiquitin (solid line). The discharge is stimulated with WT MARCH6 RING domain for all samples. The normalized fraction of UBE2J2~Ub is depicted with error bars representing the SEM of the data. Three independent experiments were conducted. Source data is provided in Supplementary Fig. 8d and Source Data file. d MARCH6 acidic N-terminus is crucial for SQLE degradation. Left: Close-up of predicted AF model of MARCH6 N-terminus, with mutated residues highlighted in cyan. The predicted hydrogen bond between MARCH6 E5 and UBE2J2 K26 is shown as a red dotted line. Right: Flow cytometry panel comparing SQLE reporter levels in cells re-expressing MARCH6WT, MARCH6ΔRING, or MARCH6E5A/E6A/E15A/E19A mutant after MARCH6 depletion. Histogram depiction of normalized mCherry:GFP fluorescence. Representative result shown from six independent biological replicates. e Pillar-like structure formed by a beta-sheet downstream of the RING domain with the C-terminus orients MARCH6 RING domain functionally. Middle: Close-up of MARCH6 RING domain interactions with selected C-terminal elements. Predicted hydrogen bonds from AF multimer are shown as magenta dashed lines. Targeted residues within the beta-sheet are emphasized in magenta and labeled in cyan. Left/Right: Flow cytometry panels of targeted residues (cyan). Representative result shown from six independent biological replicates.
Fig. 5
Fig. 5. A flexibly occluded membrane channel is the predicted site of SQLE engagement.
a High-resolution Doa10 cryo-EM structure with overlaid gate helices density. A central channel diameter of approximately 15 Å is indicated, measured between the center of gate Helix 13 and the start of scaffold Helix 7. b Overlay of Doa10 cryo-EM model (light blue) and Doa10 AF prediction (dark blue). Black arrows show gate helices movement away from the scaffold in the AF model. c Modeling a predicted MARCH6-SQLE complex. Top: AF multimer predicted complex between MARCH6 and SQLE (FL or SQLE-N100), with three models aligned on MARCH6, showing only SQLE-N100 for clarity (dark red: SQLE FL, red/orange: two predictions for positioning of the SQLE-N100 isolated N-terminus). Only the MARCH6 model from a single AF prediction is displayed for clarity, as E3 aligns almost identically across models. Membrane channel-lining residues are marked with magenta labels. Bottom: Flow cytometry panels comparing SQLE reporter levels in MARCH6-depleted cells re-expressing MARCH6WT, MARCH6ΔRING, or four MARCH6 variants with mutations outlined above (top). Relative mCherry fluorescence normalized to GFP as an expression control presented as a histogram. Representative result shown from six independent biological replicates. d Mutants within the MARCH6 membrane channel decrease SQLE binding. FLAG-immunoprecipitation of K562 cells expressing MARCH6-FLAG WT or four channel-lining mutants. Left: Representative Western blot against MARCH6-FLAG, SQLE and GAPDH (only input) for the whole cell lysate (input) and FLAG-immunoprecipitation (FLAG-IP). Right: Densitometric quantification of the SQLE/MARCH6 ratio for the FLAG-pulldown for eight independent biological replicates. Pairwise comparison of the mutants with the WT sample were done using a paired t test and significance levels are shown in grey above each mutant. p values: 0.0245 (Y92V), 0.0008 (Y96V), 0.5339 (L140A/L747A), 0.0009 (Y92V/Y96V). Source data provided as Source Data file.
Fig. 6
Fig. 6. Lipid binding sites in Doa10 are potentially conserved in MARCH6 and may partake in regulatory functions.
a Backside view of the scaffold domain in the Doa10 cryo-EM model. Well-resolved phospholipids shown as dark red spheres. Scaffold helices involved in lipid binding are indicated in light blue. Lipids are numbered, with dashed boxes around three lipid binding sites discussed in the text. b Scaffold Helix 1 and Helix 2 form a lipid headgroup binding site in Doa10. Left: Overlay of Doa10 cryo-EM structure and AF predicted model for MARCH6 at lipid binding site (Lipid 1). Doa10K154 in Helix 1 interacts with the phosphate headgroup (black dashed line), with MARCH6K116 in a structurally conserved position. AF prediction shows salt bridge network (magenta dashed lines) involving D142 in Helix 2, R113 in Helix 1, and S135 between Helix 1 and Helix 2. Right: Flow cytometry panels comparing SQLE reporter levels in MARCH6-depleted cells re-expressing MARCH6WT, MARCH6ΔRING, MARCH6K116E, or MARCH6R113E. Histogram depiction of normalized mCherry:GFP fluorescence ratio. Representative result shown from six independent biological replicates. c Doa10 Helix 10 and Helix 8 accommodate a bound lipid on the cytoplasmic membrane leaflet. Top: Doa10F708 sidechain makes hydrophobic contact with Lipid 2 acyl chains. Predicted MARCH6 model shows conserved loop, with MARCH6F453 sidechain protruding into a cavity where the lipid is resolved in Doa10. Bottom: Flow cytometry panels comparing SQLE reporter levels in MARCH6-depleted cells re-expressing MARCH6WT, MARCH6ΔRING, MARCH6F453A, or MARCH6F453W. Histogram depiction of the normalized mCherry:GFP ratio. Representative result shown from six independent biological replicates. d Top: Depiction of Lipid 3 forming a hydrogen bond with Doa10 K625 in Helix 8. The conserved K374 of MARCH6 is shown in light yellow. Bottom: Flow cytometry panels comparing SQLE reporter levels in MARCH6-depleted cells re-expressing MARCH6WT, MARCH6ΔRING, MARCH6K374A, or MARCH6K374E. mCherry fluorescence normalized to GFP as an internal expression control in histogram depiction. Representative result shown from six independent biological replicates.
Fig. 7
Fig. 7. Model for SQLE engagement and ubiquitylation by MARCH6.
a MARCH6 consists of a rigid scaffold domain linked to a flexible gate domain by the nearly perpendicular transmembrane Helix 1. The catalytic RING domain is supported above the membrane by N- and C-terminal elements, including residues adjacent to Helix 1 and the final gate Helix 15, forming a pillar-like beta-sheet. UBE2J2 TMH binding site is proposed on the backside of the MARCH6 scaffold, with SQLE-N100 engagement potentially occurring inside the E3 membrane channel near Helix 1 and 15. An arch-shaped lateral opening is formed by Helix 1 and 15, allowing SQLE-N100 entry into the membrane channel and potentially regulating the opening’s width by the gate domain’s swiveling. SQLE-N100 is positioned within the MARCH6 membrane channel for ubiquitylation, with sites aligned towards the cytosolic ubiquitylation active site. Binding of UBE2J2 TMH and catalytic domains to MARCH6 may create a temporarily rigid E3-E2-Ub-substrate complex, facilitating ubiquitin transfer to SM-N100 acceptor sites. Scaffold Helix 1 anchoring by scaffold elements or bound lipids may influence efficient conformational coupling between scaffold, gate, and RING domains of the E3. b Structural comparison of Doa10/MARCH6 with Hrd1 complex (PDB: 6VJZ) and Pex complex (PDB: 7T92). The left side depicts the structures of the E3 ligases in cartoon representation from the cytosol (top view) with a star highlighting the membrane channel. On the right side, a slice through the E3 ligases in surface representation from the membrane (side view) is shown. While MARCH6 and Doa10 form a hydrophobic membrane channel, the Pex complex forms a narrower aqueous pore and the Hrd complex assembles in a ‘half-circle’ leading to distortion and thinning of the membrane.

References

    1. Brodsky JL. Cleaning up: ER-associated degradation to the rescue. Cell. 2012;151:1163–1167. doi: 10.1016/j.cell.2012.11.012. - DOI - PMC - PubMed
    1. Christianson JC, Ye Y. Cleaning up in the endoplasmic reticulum: ubiquitin in charge. Nat. Struct. Mol. Biol. 2014;21:325–335. doi: 10.1038/nsmb.2793. - DOI - PMC - PubMed
    1. Mehrtash AB, Hochstrasser M. Ubiquitin-dependent protein degradation at the endoplasmic reticulum and nuclear envelope. Semin. Cell Dev. Biol. 2019;93:111–124. doi: 10.1016/j.semcdb.2018.09.013. - DOI - PMC - PubMed
    1. Sinning I, McDowell MA. Cryo-EM insights into tail-anchored membrane protein biogenesis in eukaryotes. Curr. Opin. Struct. Biol. 2022;75:102428. doi: 10.1016/j.sbi.2022.102428. - DOI - PubMed
    1. Christianson JC, Carvalho P. Order through destruction: how ER-associated protein degradation contributes to organelle homeostasis. EMBO J. 2022;41:e109845. doi: 10.15252/embj.2021109845. - DOI - PMC - PubMed