. 2024 Jan 9;15(1):375.
doi: 10.1038/s41467-023-44005-4.

Upregulated pexophagy limits the capacity of selective autophagy

Affiliations

Upregulated pexophagy limits the capacity of selective autophagy

Kyla Germain et al. Nat Commun. .

Abstract

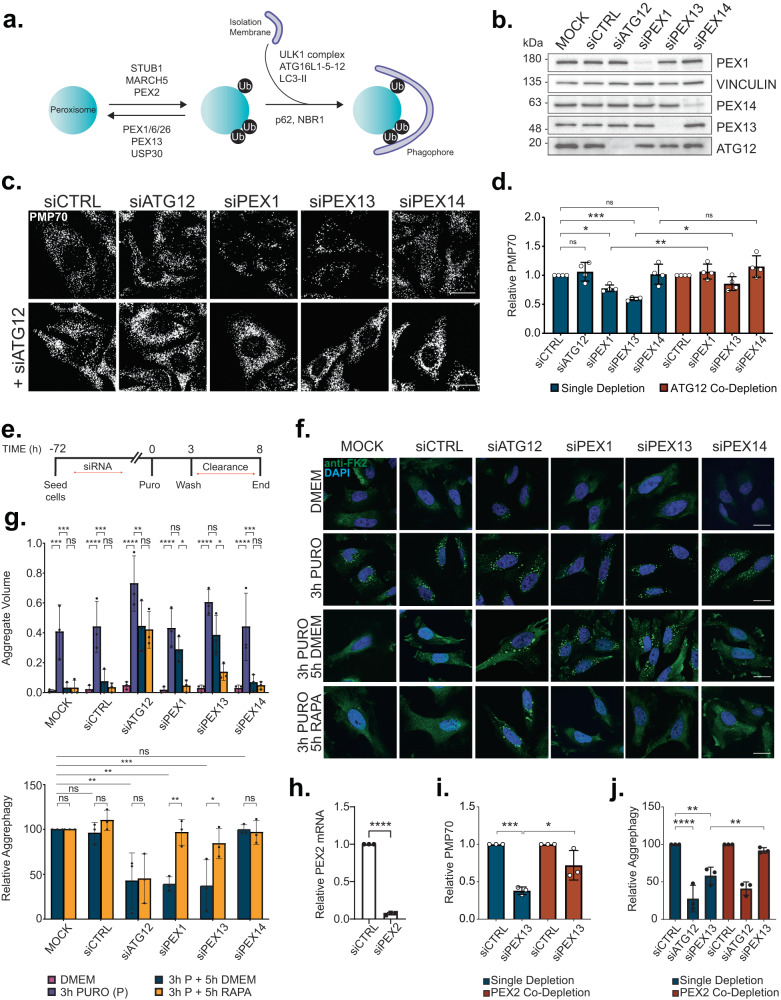
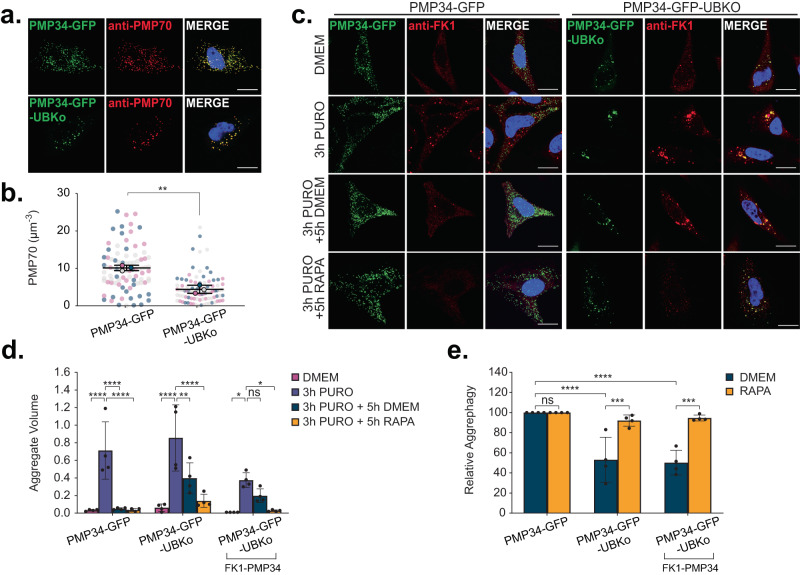
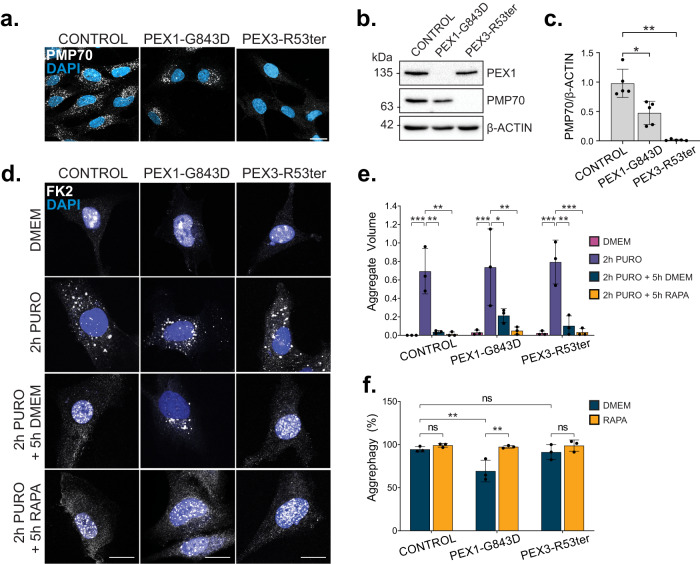
Selective autophagy is an essential process to maintain cellular homeostasis through the constant recycling of damaged or superfluous components. Over a dozen selective autophagy pathways mediate the degradation of diverse cellular substrates, but whether these pathways can influence one another remains unknown. We address this question using pexophagy, the autophagic degradation of peroxisomes, as a model. We show in cells that upregulated pexophagy impairs the selective autophagy of both mitochondria and protein aggregates by exhausting the autophagy initiation factor, ULK1. We confirm this finding in cell models of the pexophagy-mediated form of Zellweger Spectrum Disorder, a disease characterized by peroxisome dysfunction. Further, we extend the generalizability of limited selective autophagy by determining that increased protein aggregate degradation reciprocally reduces pexophagy using cell models of Parkinson's Disease and Huntington's Disease. Our findings suggest that the degradative capacity of selective autophagy can become limited by an increase in one substrate.


Conflict of interest statement

The authors declare no competing interests.

Figures

Fig. 1
Fig. 1. PEX1 or PEX13 depletion impairs puromycin-induced aggrephagy.
a Schematic of mammalian ubiquitin-dependent pexophagy. b Immunoblot of HeLa cells treated with siRNA and probed for the indicated proteins. c Representative images of HeLa cells treated with the indicated siRNA and immunostained for the peroxisomal marker, PMP70. Scale bar, 25 µm. d Quantification of PMP70 in (c) relative to siCTRL conditions. PMP70 was measured by dividing the number of PMP70 puncta by cell volume (see Methods). e Schematic of aggrephagy assay. HeLa cells were treated with the indicated siRNA prior to aggrephagy induction (see Methods). f Representative images from cells at each stage in the assay: DMEM, 3-h 5 µg mL−1 Puromycin, 3-h 5 µg mL−1 Puromycin followed by 5-h clearance period in DMEM, or 3-h 5 µg mL Puromycin followed by 5-h clearance period in 2 µM Rapamycin. Cells were immunostained with the ubiquitin antibody FK2; blue=DAPI. Scale bars, 25 µm. g Quantification of aggrephagy assay in (f). Aggregate Volume was calculated by dividing the total volume of FK2 puncta by cell volume. Aggrephagy activity was measured as the % clearance of FK2 aggregates, relative to mock transfected “3 h P + 5 h DMEM” cells. h PEX2 mRNA levels measured by qPCR in cells treated with control non-targeting or PEX2-targeting siRNA, relative to control. i Quantification of PMP70 in HeLa cells treated with the indicated siRNAs. j Aggrephagy activity in HeLa cells treated with the indicated siRNAs, relative to control siRNA-treated condition. Data are displayed as means ± standard deviation from n = 4 (d) or n = 3 (g, h, i) independent experiments. Statistical significance is denoted as *P ≤ 0.05, **P ≤ 0.01, ***P ≤ 0.001, ****P ≤ 0.0001, ns not significant. d, i One-way ANOVA, Tukey’s multiple comparisons test. g, j Two-way ANOVA, Tukey’s multiple comparisons test. h Unpaired t-test, two tailed. Source data and exact P values are provided as a Source Data file.
Fig. 2
Fig. 2. PMP34-GFP-UBKo expression impairs puromycin-induced aggrephagy.
a HeLa cells transfected with either PMP34-GFP or PMP34-GFP-UBKo 24-h before fixation and immunostaining for PMP70; blue = DAPI. Scale bars, 20 µm. b Quantifications of PMP70 in (a). PMP70 was calculated by dividing the number of PMP70 puncta by cell volume (see Methods). c HeLa cells transfected with either PMP34-GFP or PMP34-GFP-UBKo 24-h before aggrephagy induction. Representative images from cells at each stage in the assay: DMEM, 3-h 5 µg mL−1 Puromycin, 3-h 5 µg mL-1 Puromycin followed by 5-h clearance period in DMEM, or 3-h 5 µg mL-1 Puromycin followed by 5-h clearance period in 2 µM Rapamycin DMEM. Cells were immunostained for FK1; blue=DAPI. Scale bars, 25 µm. d Quantification of Aggregate Volume in (c). Aggregate Volume was calculated by dividing the total volume of FK1 puncta by cell volume. e Quantification of aggrephagy activity in (c), relative to PMP34-GFP. Aggrephagy activity was measured as the % clearance of FK1 aggregates. Data are displayed as means (d, e) or individual cells overlaid with means, where different colors correspond to independent trials (b) ± standard deviation from n = 3 (b) or n = 4 (d, e) independent trials. Statistical significance is denoted as *P ≤ 0.05, **P ≤ 0.01, ***P ≤ 0.001, ****P ≤ 0.0001, ns not significant. b Unpaired t-test, two tailed, performed with means. d, e Two-way ANOVA, Tukey’s multiple comparisons test. Source data and exact P values are provided as a Source Data file.
Fig. 3
Fig. 3. PEX1 or PEX13 depletion impairs Parkin-dependent mitophagy.
a Immunoblots of GFP-Parkin HEK293 cells subjected to siRNA knockdown prior to treatment for 8-h with DMSO, 2.5 µM Oligomycin and 250 nM Antimycin A1 (OA), or OA + 250 nM Bafilomycin A1. Immunoblots were probed for outer mitochondrial membrane marker MFN2, inner mitochondrial membrane marker CVα, mitochondrial matrix protein HSP60, and siRNA targets: PEX1, PEX13, PEX14, and ATG12. b–d Percentage loss densitometry quantification of the indicated bands normalized to loading control GAPDH. Bands were quantified using ImageJ software. e Representative confocal fluorescent images of GFP-Parkin HEK293 cells treated as in (a). Cells immunostaining for CVα as indicated; blue= DAPI. Scale bars, 25 µm. f Quantification of CVα after OA treatment in (e) relative to MOCK. CVα was quantified by dividing the total CVα fluorescence intensity by cell volume. g Quantification of CVα after 8-h OA treatment in GFP-Parkin HEK293 cells treated with the indicated siRNA relative to siCTRL conditions (representative images in Fig. S3). h Representative images of GFP-Parkin HEK293 cells treated with the indicated siRNA prior to treatment for 8-h with either OA, or OA + 2 µM Rapamycin. Cells were immunostained for mitochondria marker, CVα; blue=DAPI. Scale bars, 25 µm. i Quantification of CVα in (h). Data are displayed as means from n = 5 (b, c), n = 4 (d, i), n = 3 (f, g) independent experiments ± standard deviation. Statistical significance is denoted as *P ≤ 0.05, **P ≤ 0.01, ***P ≤ 0.001, ****P ≤ 0.0001, ns not significant. bd Comparison to MOCK, unpaired t-test, two tailed. f One-way ANOVA, Dunnett’s multiple comparisons test. g One-way ANOVA, Tukey’s multiple comparisons test. i Comparison to OA, unpaired t-test, two tailed. Source data and exact P values are provided as a Source Data file.
Fig. 4
Fig. 4. The absence of peroxisomes augments deferiprone-induced mitophagy.
a Immunoblots of control or ZSD fibroblasts treated for 28-h with either DMSO, 10 µM CCCP or 1 mM DFP and probed for the indicated proteins. b–e Densitometry quantification of the indicated bands from (a) normalized to loading control Vinculin and relative to DMSO conditions. f Densitometry quantification of the indicated bands from (a) in DMSO conditions only, normalized to loading control Vinculin. g Percentage loss of band intensity from DMSO to DFP conditions in (a), (see Methods). h Representative images of control or PEX3-R53Ter ZSD fibroblasts treated for 28-h with either DMSO or 1 mM DFP. Cells were immunostained for HSP60 and LAMP1A; blue=DAPI. Scale bars, 25 µm; zoom scale bars, 5 µm; white boxes, zoomed region. i Manders’ correlation coefficient for HSP60 and LAMP1A from (h). j Quantification of fraction of cells with a mild, moderate, or severe mitophagy phenotype from (h). See Methods and Supplementary Data Fig. 4. Data are displayed as individual cells with means overlaid (i) or fraction of cells (j) from n = 3 independent experiments, or means as indicated from n = 3 (b, c) or n = 4 (dg) independent experiments ± standard deviation. Statistical significance is denoted as *P ≤ 0.05, **P ≤ 0.01, ***P ≤ 0.001, ****P ≤ 0.0001, ns not significant. be Two-way ANOVA, Dunnett’s multiple comparisons test, (f, g) Unpaired t-test, two tailed, i Two-way ANOVA, Tukey’s multiple comparisons test using means. Source data and exact P values are provided as a Source Data file.
Fig. 5
Fig. 5. PEX1 or PEX13 depletion impairs the autophagic clearance of αS preformed fibrils.
a HeLa cells at each stage in the αS assay: untreated (DMEM), 4-h transfection with αS pre-formed fibrils (PFF); 4-h αS PFF followed by an 8-h clearance period in either DMEM or 0.25 mM Leupeptin and 2 µM E-64. Cells were immunostained for αS and LC3. Scale bars, 25 µm. b HeLa cells immunostained for αS and expressing LAMP1a-mCherry at each stage in the assay as in (a), but here with a 15-h clearance period. Scale bars, 25 µm. c Schematic of assay where cells are treated with siRNA before αS PFF transfection. d Representative images from HeLa cells treated with the indicated siRNA and subjected to the αS assay in (c), given an 8-h clearance period in either DMEM or 2 µM Rapamycin. Cells were immunostained for αS and LC3; blue = DAPI. Scale bars, 25 µm; cropped image scale bars, 5 µm; white arrows indicate colocalization of αS and LC3. e Quantification of αS intensity in (d), calculated by dividing the total αS florescence intensity by cell volume. Data are displayed as means ± standard deviation from n = 4 independent experiments. Statistical significance is denoted as *P ≤ 0.05, **P ≤ 0.01, ***P ≤ 0.001, ****P ≤ 0.0001, ns not significant. Two-way ANOVA, Tukey’s multiple comparisons test. Images in (a) and (b) are representative of n = 3 independent experiments. Source data and exact P values are provided as a Source Data file.
Fig. 6
Fig. 6. PEX1-G843D Zellweger Spectrum Disorder patient fibroblasts exhibit impaired aggrephagy.
a Images of control, PEX1-G843D, or PEX3-R53Ter ZSD fibroblasts stained for PMP70; blue = DAPI. Scale bars, 25 µm. b Immunoblot of ZSD fibroblasts probed for PEX1, PMP70, and β-Actin. c Densitometry quantification of PMP70 bands in (b) normalized to β-Actin. d Representative images of ZSD fibroblasts at each stage in the aggrephagy assay. Cells were immunostained with the antibody FK2; blue=DAPI. Scale bars, 25 µm. e Quantification of Aggregate Volume in (a). Aggregate Volume was calculated by dividing the total volume of FK2 puncta by cell volume. f Quantification of aggrephagy activity in (d), relative to control fibroblasts. Aggrephagy activity was measured as the % clearance of FK2 aggregates. Data are displayed as means ± standard deviation from n = 5 (c) or n = 3 (e, f) independent experiments. Statistical significance is denoted as *P ≤ 0.05, **P ≤ 0.01, ***P ≤ 0.001, ****P ≤ 0.0001, ns not significant. c One-way ANOVA, Dunnett’s multiple comparisons test. e, f Two-way ANOVA, Tukey’s multiple comparisons test. Source data and exact P values are provided as a Source Data file.
Fig. 7
Fig. 7. αS PFF degradation limits pexophagy induced by PEX13 depletion.
a Schematic of assay. 20-h after a single siRNA transfection, αS monomers (Mon) or PFF are co-transfected into cells with an mCherry plasmid for 4-h, followed by a 15-h clearance period in DMEM. b Immunoblot of HeLa cells treated with the indicated siRNA for 20-h and probed for PEX13 and β-Actin; representation of n = 3 independent experiments. c Representative images of HeLa cells treated with the indicated siRNA and transfected with either αS Mon or PFF at each stage in the assay, and immunostained for PMP70. Scale bars, 25 µm. d Quantification of αS intensity in (c), calculated by dividing the total αS florescence intensity by cell volume. e Quantification of PMP70 in (c). PMP70 was calculated by dividing the number of PMP70 puncta by cell volume. Data are displayed as means ± standard deviation from n = 4 independent experiments. Statistical significance is denoted as *P ≤ 0.05, **P ≤ 0.01, ***P ≤ 0.001, ****P ≤ 0.0001, ns not significant. Two-way ANOVA, Tukey’s multiple comparisons test. Comparison of siCTRL to siPEX13 (d) and siPEX13 Mon to PFF (e), unpaired t-test, two tailed. Source data and exact P values are provided as a Source Data file.
Fig. 8
Fig. 8. STHdhQ111/111 cells exhibit impaired pexophagy.
a Immunofluorescent images of STHdhQ7/7 or STHdhQ111/111 cells stained for peroxisomal marker, PMP70; blue=DAPI. Scale bar, 25 µm. b Quantification of PMP70 in (a). PMP70 was calculated by dividing the number of PMP70 puncta by cell volume. c Immunoblots of STHdhQ7/7 or STHdhQ111/111 cells treated for 24-h with 100 nM Torin1 and probed for mTOR, S6K, p-mTOR, p-S6K, and loading control Vinculin; representative of n = 3 independent experiments. d Representative images of STHdhQ7/7 or STHdhQ111/111 cells expressing either PMP34-GFP or PMP34-GFP-UBKo for 48-h, and immunostained for PMP70; blue = DAPI. Cells were grown in either DMSO or 100 nM Torin1 for the final 24-h. Scale bars, 25 µm. e Quantification of PMP70 in (d), relative to DMSO PMP34-GFP condition for each cell type. f Quantification of PMP34-GFP-UBKo-induced pexophagy in (d). Pexophagy was calculated as the percentage loss of PMP70 from DMSO PMP34-GFP conditions (see Methods). g Immunoblots of STHdhQ7/7 or STHdhQ111/111 cells treated as in (d), probed for HTT, PMP70, and loading control Vinculin. h Densitometry quantifications of PMP70 bands normalized to Vinculin and relative to DMSO PMP34-GFP condition for each cell type. i Quantification of PMP34-GFP-UBKo-induced pexophagy in (g). Data are displayed as means ± standard deviation from n = 3 (b), n = 4 (e, f), or n = 5 (h, i) independent experiments. Statistical significance is denoted as *P ≤ 0.05, **P ≤ 0.01, ***P ≤ 0.001, ****P ≤ 0.0001, ns not significant. b Unpaired t-test, two tailed. e, h Two-way ANOVA, Tukey’s multiple comparisons test. f, i One-way ANOVA, Tukey’s multiple comparisons test. Source data and exact P values are provided as a Source Data file.
Fig. 9
Fig. 9. Impaired aggrephagy during PEX1 or PEX13 depletion can be rescued by ULK1.
a Immunoblot of HeLa cells treated for 5-h with either DMSO or 20 µM LYN-1604 and probed for the indicated proteins. b Densitometry quantifications of ATG13 bands normalized to β-Actin, or the ratio of p-ATG13 band intensity/ATG13 band intensity from (a). c Quantification of aggrephagy activity in cells treated with the indicated siRNA and subjected to the puromycin-aggrephagy assay with a clearance period in either DMEM or LYN-1604 (representative images in Supplementary Data Fig. 8c). Aggrephagy activity was measured as the % clearance of FK1 aggregates, relative to mock transfected “3 h P + 5 h DMEM” cells. d Immunoblot of HeLa cells electroporated with an empty vector control or ULK1-FLAG and probed for the indicated proteins. e Densitometry quantifications of ATG13 bands normalized to β-Actin, or the ratio of p-ATG13 band intensity/ATG13 band intensity from (d). f HeLa cells treated with the indicated siRNA prior to transfection of an empty vector (Supplementary Data Fig. 8f) or ULK1-FLAG and subjection to the puromycin-aggrephagy assay. Representative images of cells at each stage in the assay: DMEM, 3-h 5 µg mL−1 Puromycin, or 3-h 5 µg mL−1 Puromycin followed by 5-h clearance period in DMEM. Cells were immunostained for FK2 and FLAG; blue=DAPI. Scale bars, 25 µm; white boxes, zoomed region. g Quantification of aggrephagy activity of cells in (f Supplementary Data Fig. 8f), relative to empty vector transfected “3 h P + 5 h DMEM” cells. Data are displayed as means from n = 6 (b), n = 3 (c,e), or n = 4 (g) independent trials ± standard deviation. Statistical significance is denoted as *P ≤ 0.05, **P ≤ 0.01, ***P ≤ 0.001, ****P ≤ 0.0001, ns not significant. Unpaired t-test, two tailed. Source data and exact P values are provided as a Source Data file.

References

    1. Vargas JNS, Hamasaki M, Kawabata T, Youle RJ, Yoshimori T. The mechanisms and roles of selective autophagy in mammals. Nat. Rev. Mol. Cell Biol. 2023;24:167–185. doi: 10.1038/s41580-022-00542-2. - DOI - PubMed
    1. Kirkin V, Rogov VV. A diversity of selective autophagy receptors determines the specificity of the autophagy pathway. Mol. Cell. 2019;76:268–285. doi: 10.1016/j.molcel.2019.09.005. - DOI - PubMed
    1. Argyriou, C., D’Agostino, M. D. & Braverman, N. Peroxisome biogenesis disorders. Transl. Sci. Rare Dis.1, 111–144 (2016). - PMC - PubMed
    1. Mooi WJ, et al. Ultrastructure of the liver in the cerebrohepatorenal syndrome of Zellweger. Ultrastruct. Pathol. 1983;5:135–144. doi: 10.3109/01913128309141833. - DOI - PubMed
    1. Salpietro V, et al. Zellweger syndrome and secondary mitochondrial myopathy. Eur. J. Pediatr. 2015;174:557–563. doi: 10.1007/s00431-014-2431-2. - DOI - PubMed

Publication types