

Radiomics analysis to predict pulmonary nodule malignancy using machine learning approaches
- PMID: 38195644
- PMCID: PMC10947877
- DOI: 10.1136/thorax-2023-220226
Radiomics analysis to predict pulmonary nodule malignancy using machine learning approaches
Abstract
Background: Low-dose CT screening can reduce lung cancer-related mortality. However, most screen-detected pulmonary abnormalities do not develop into cancer and it often remains challenging to identify malignant nodules, particularly among indeterminate nodules. We aimed to develop and assess prediction models based on radiological features to discriminate between benign and malignant pulmonary lesions detected on a baseline screen.
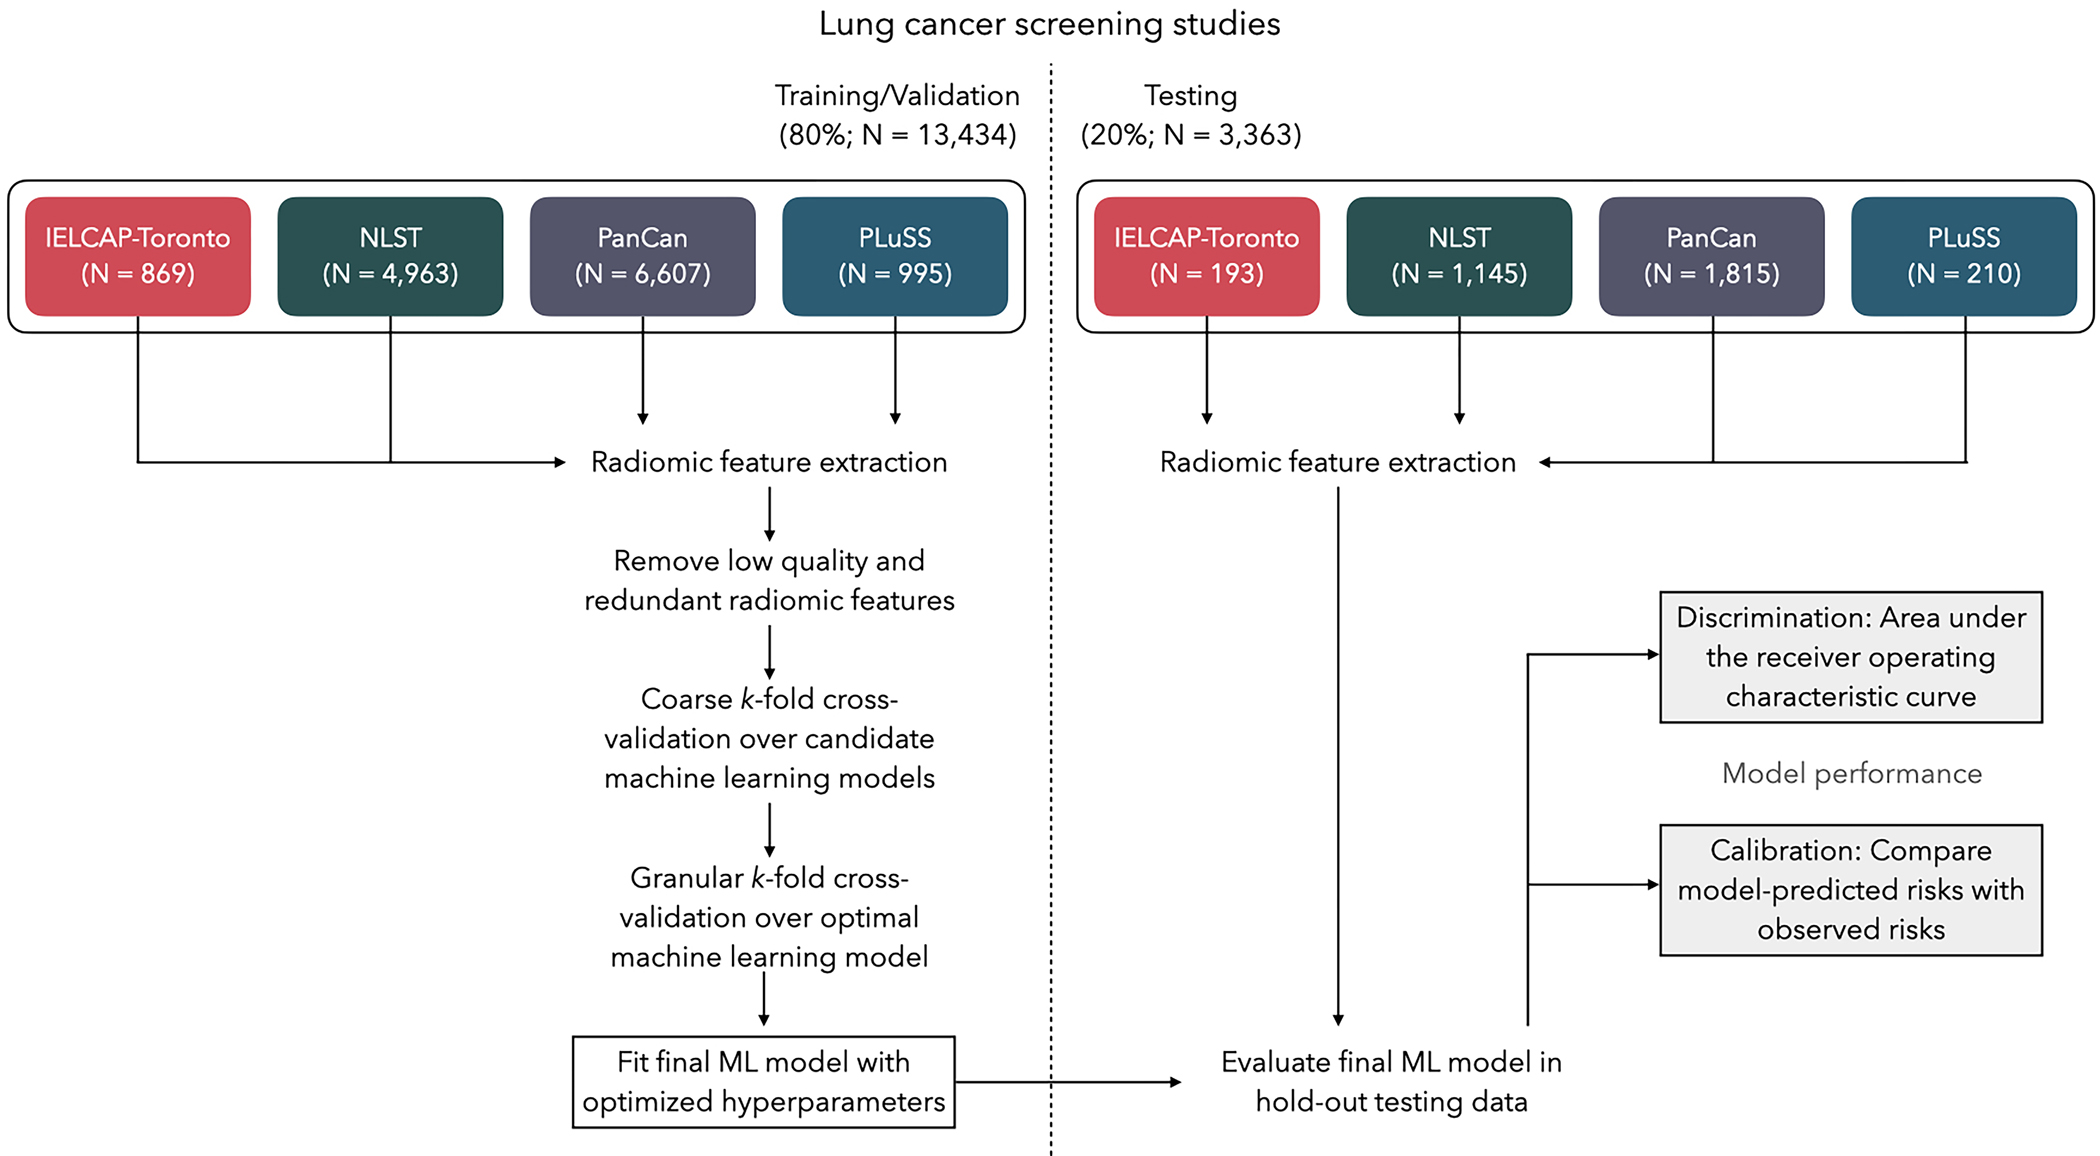
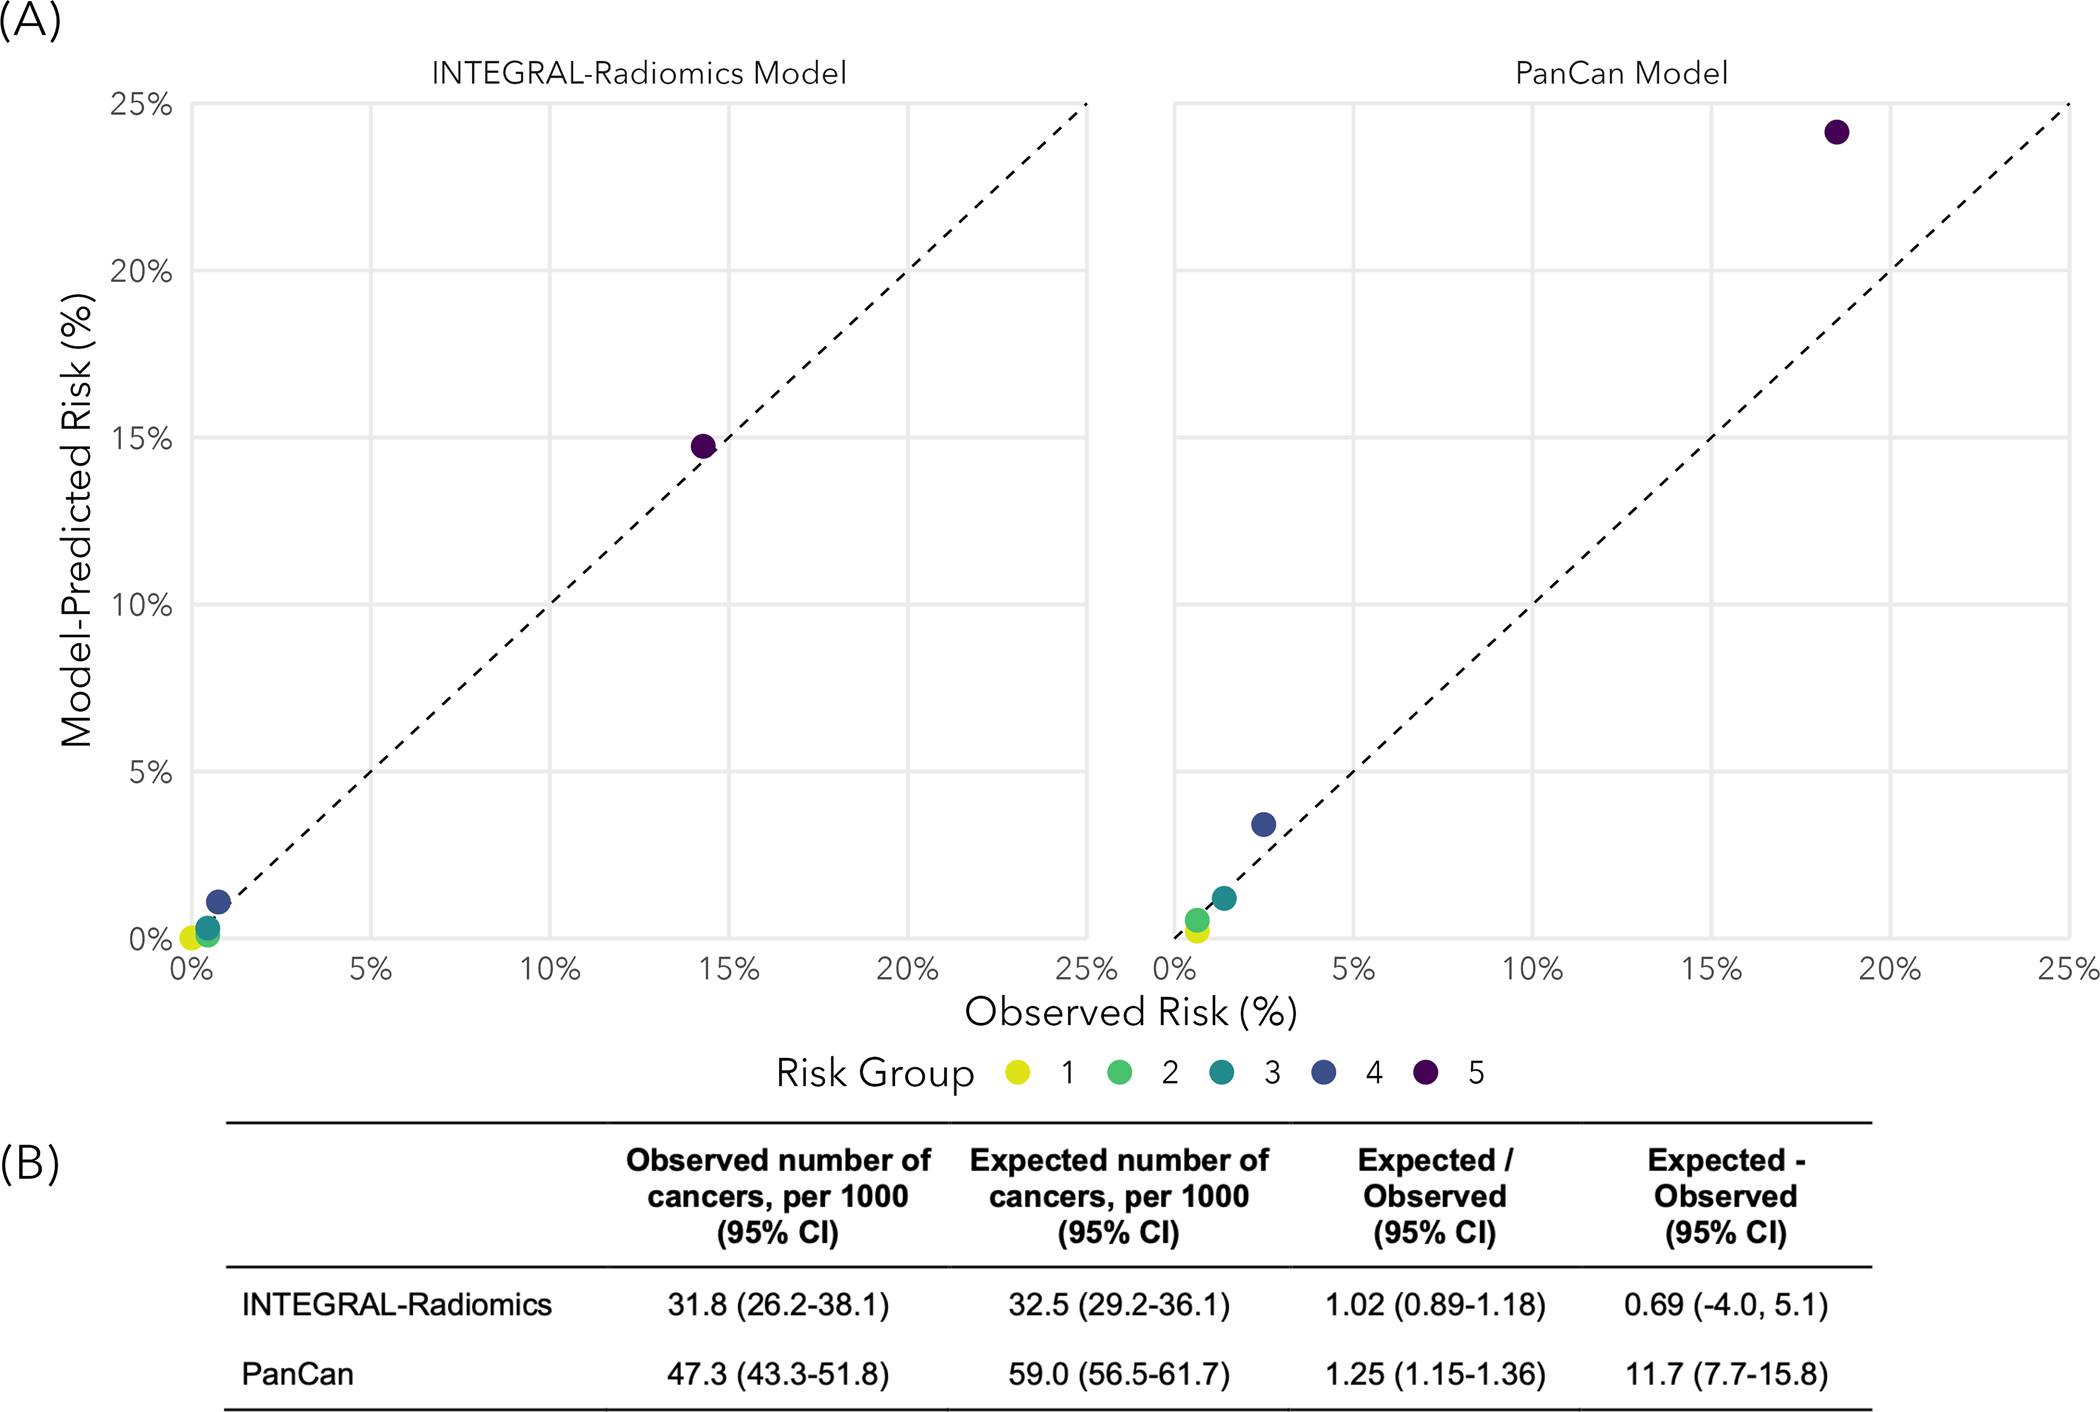
Methods: Using four international lung cancer screening studies, we extracted 2060 radiomic features for each of 16 797 nodules (513 malignant) among 6865 participants. After filtering out low-quality radiomic features, 642 radiomic and 9 epidemiological features remained for model development. We used cross-validation and grid search to assess three machine learning (ML) models (eXtreme Gradient Boosted Trees, random forest, least absolute shrinkage and selection operator (LASSO)) for their ability to accurately predict risk of malignancy for pulmonary nodules. We report model performance based on the area under the curve (AUC) and calibration metrics in the held-out test set.
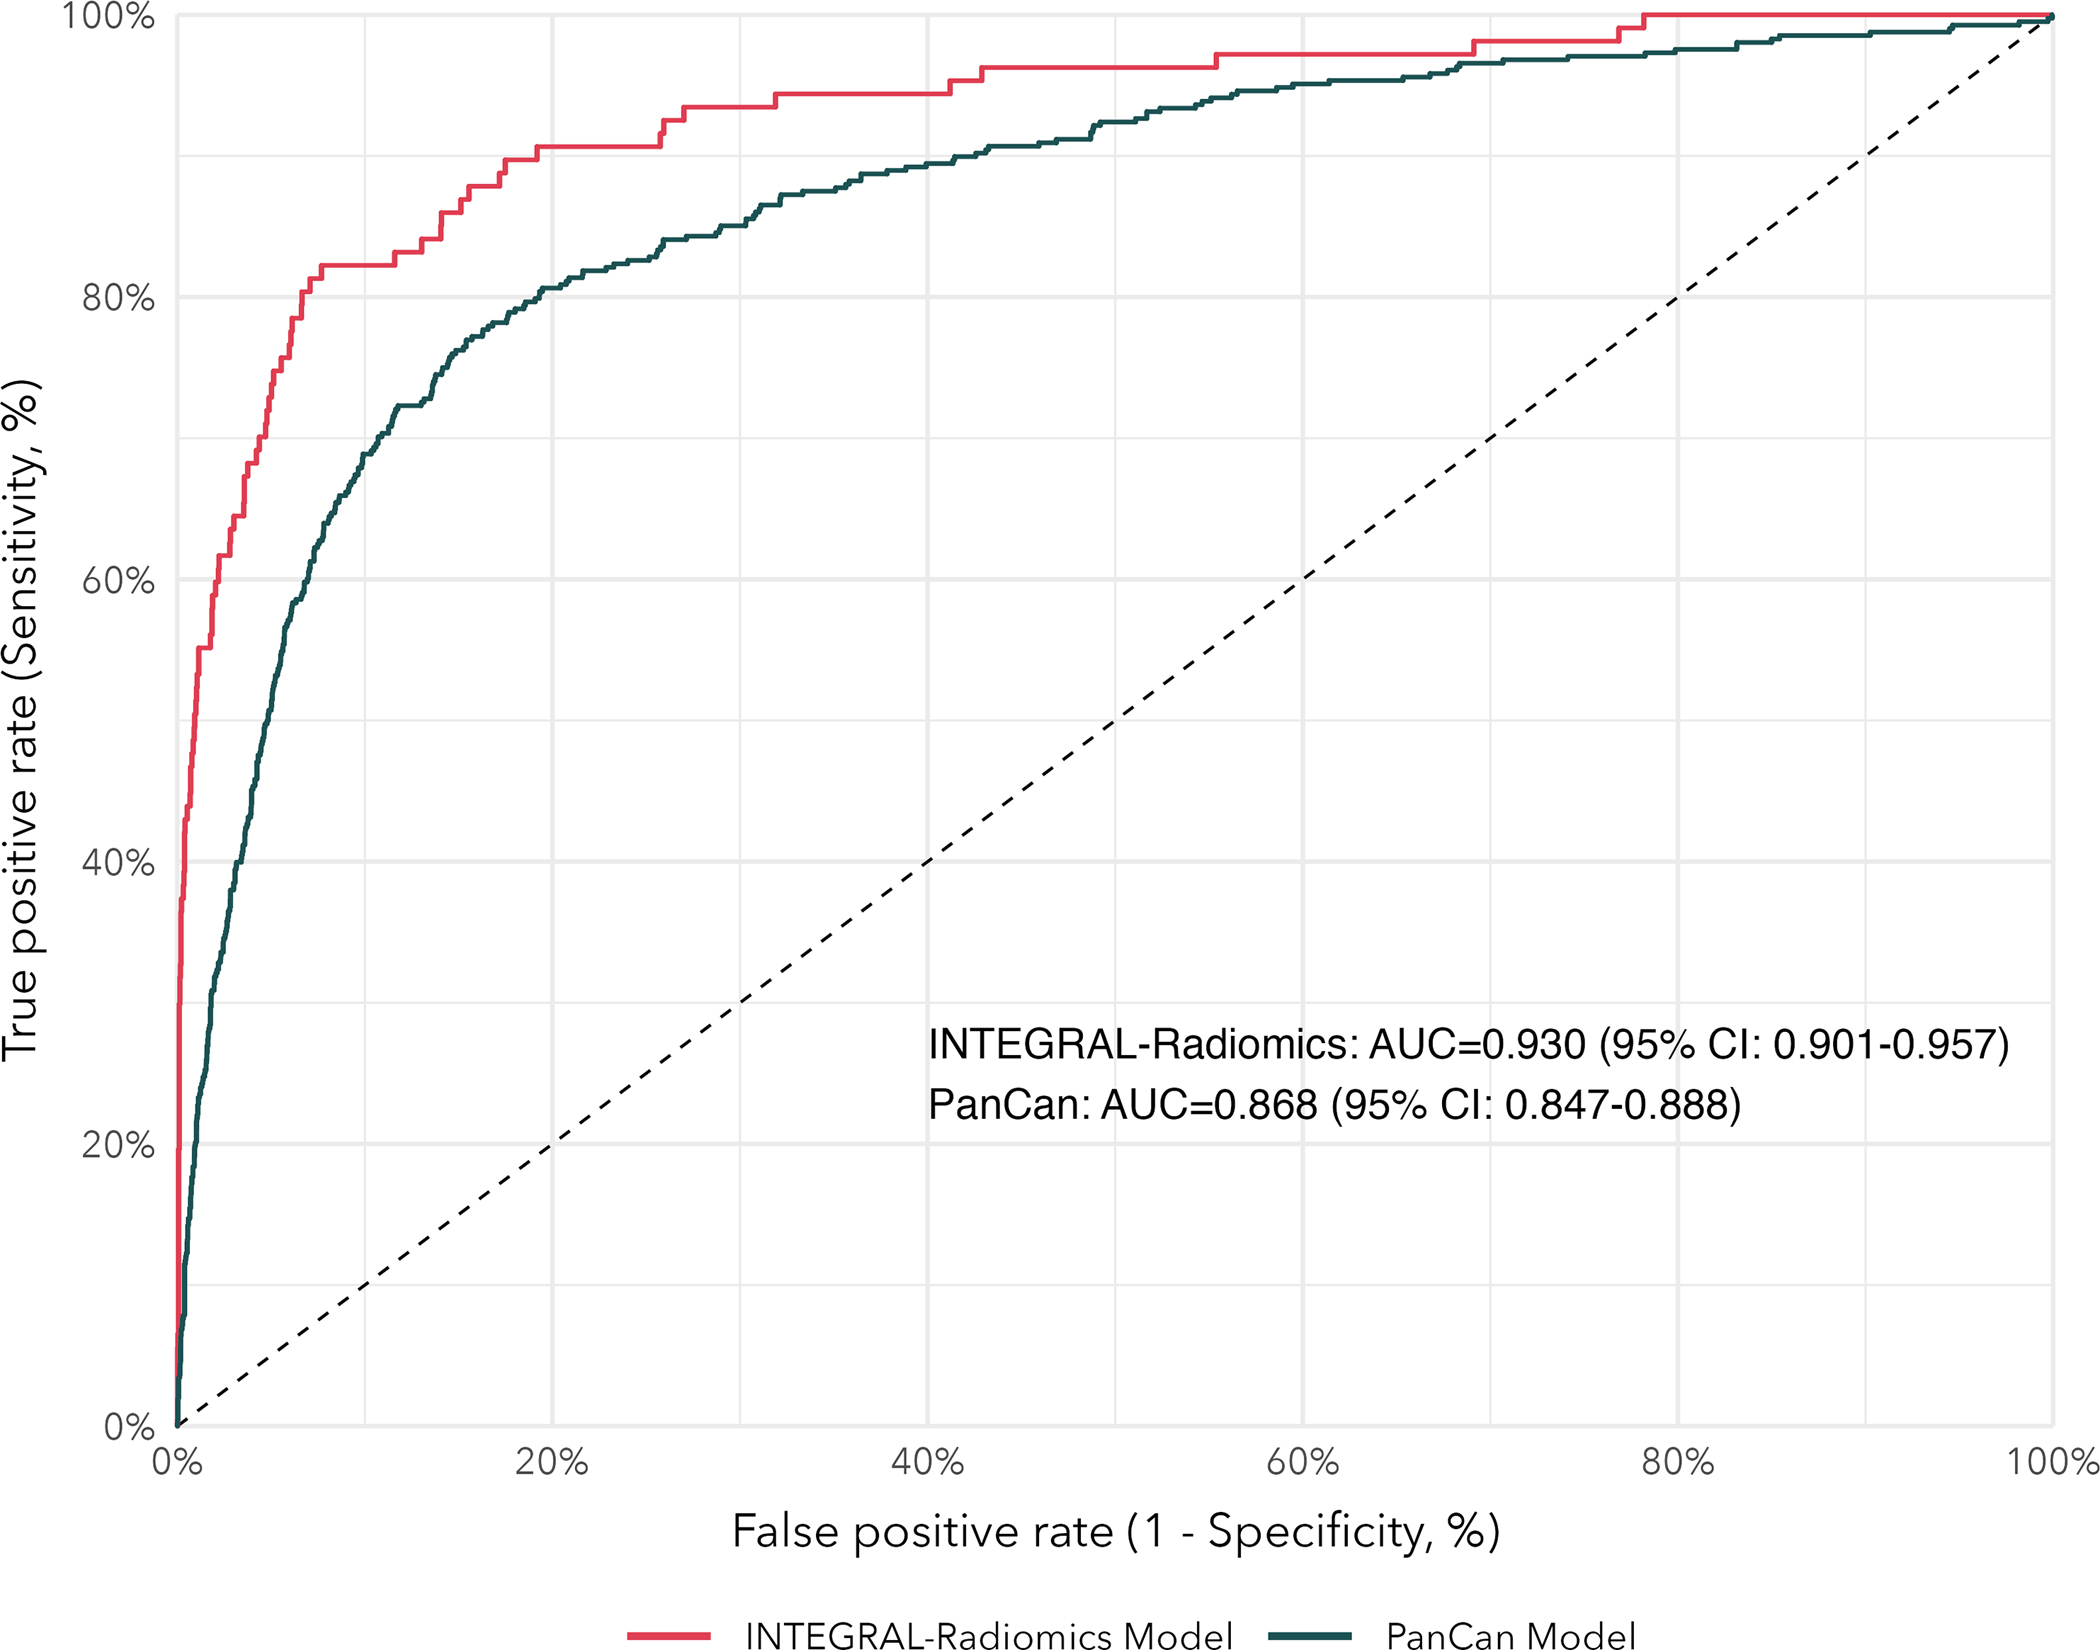
Results: The LASSO model yielded the best predictive performance in cross-validation and was fit in the full training set based on optimised hyperparameters. Our radiomics model had a test-set AUC of 0.93 (95% CI 0.90 to 0.96) and outperformed the established Pan-Canadian Early Detection of Lung Cancer model (AUC 0.87, 95% CI 0.85 to 0.89) for nodule assessment. Our model performed well among both solid (AUC 0.93, 95% CI 0.89 to 0.97) and subsolid nodules (AUC 0.91, 95% CI 0.85 to 0.95).
Conclusions: We developed highly accurate ML models based on radiomic and epidemiological features from four international lung cancer screening studies that may be suitable for assessing indeterminate screen-detected pulmonary nodules for risk of malignancy.
Keywords: clinical epidemiology; imaging/CT MRI etc; lung cancer.
© Author(s) (or their employer(s)) 2024. No commercial re-use. See rights and permissions. Published by BMJ.
Conflict of interest statement
Competing interests: None declared.
Figures
References
-
- Sung H, Ferlay J, Siegel RL, Laversanne M, Soerjomataram I, Jemal A, Bray F. Global cancer statistics 2020: GLOBOCAN estimates of incidence and mortality worldwide for 36 cancers in 185 countries. CA: a cancer journal for clinicians. 2021; - PubMed
-
- Howlader N, Noone A, Krapcho M, Miller D, Bishop K, Kosary C, Yu M, Ruhl J, Tatalovich Z, Mariotto A, others. SEER cancer statistics review, 1975–2014, national cancer institute. Bethesda, MD. 2017;1–12.
-
- Koning HJ de, Aalst CM van der, Jong PA de, Scholten ET, Nackaerts, Heuvelmans MA, Lammers J-WJ, Weenink C, Yousaf-Khan U, Horeweg N, others. Reduced lung-cancer mortality with volume CT screening in a randomized trial. New England Journal of Medicine. 2020;382(6):503–13. - PubMed
Publication types
MeSH terms
Grants and funding
LinkOut - more resources
Full Text Sources
Medical