. 2024 Jan;4(1):33-47.
doi: 10.1038/s43587-023-00550-7. Epub 2024 Jan 9.

Cerebrospinal fluid proteomics in patients with Alzheimer's disease reveals five molecular subtypes with distinct genetic risk profiles

Affiliations

Cerebrospinal fluid proteomics in patients with Alzheimer's disease reveals five molecular subtypes with distinct genetic risk profiles

Betty M Tijms et al. Nat Aging. 2024 Jan.

Abstract

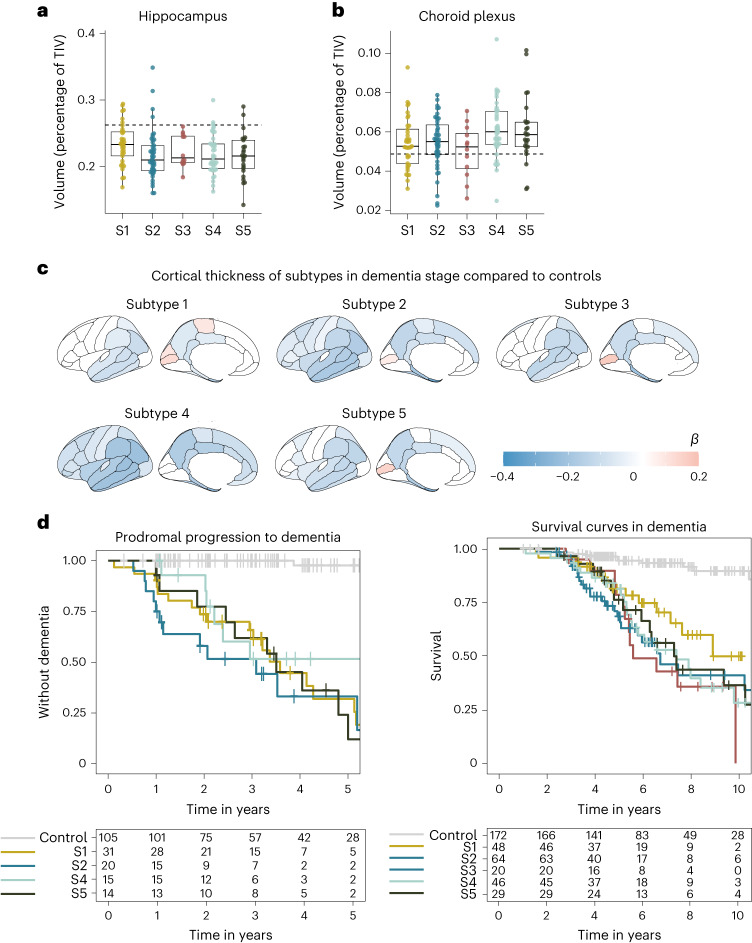
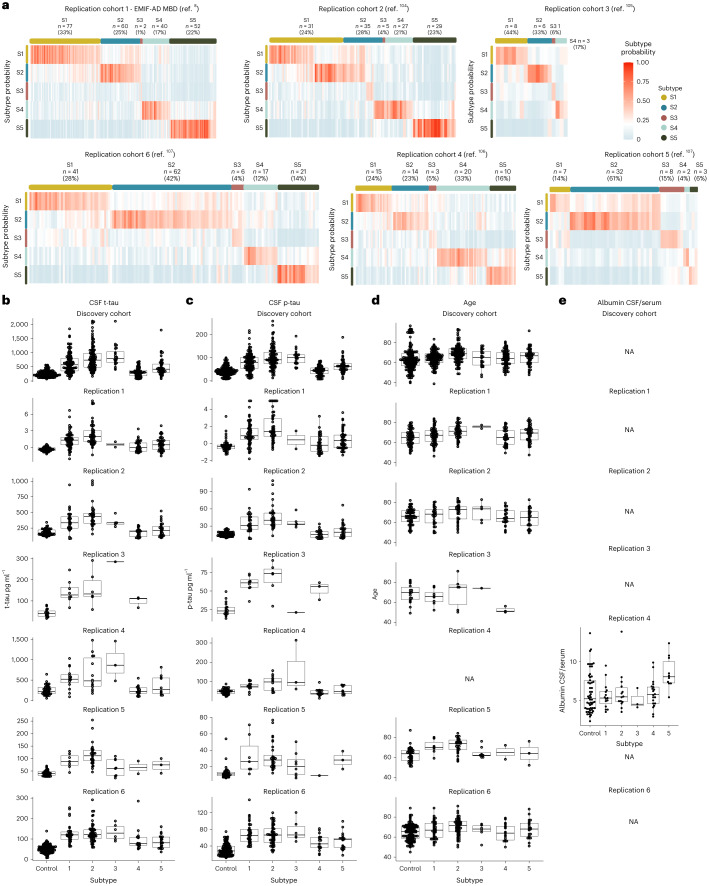
Alzheimer's disease (AD) is heterogenous at the molecular level. Understanding this heterogeneity is critical for AD drug development. Here we define AD molecular subtypes using mass spectrometry proteomics in cerebrospinal fluid, based on 1,058 proteins, with different levels in individuals with AD (n = 419) compared to controls (n = 187). These AD subtypes had alterations in protein levels that were associated with distinct molecular processes: subtype 1 was characterized by proteins related to neuronal hyperplasticity; subtype 2 by innate immune activation; subtype 3 by RNA dysregulation; subtype 4 by choroid plexus dysfunction; and subtype 5 by blood-brain barrier impairment. Each subtype was related to specific AD genetic risk variants, for example, subtype 1 was enriched with TREM2 R47H. Subtypes also differed in clinical outcomes, survival times and anatomical patterns of brain atrophy. These results indicate molecular heterogeneity in AD and highlight the need for personalized medicine.


Conflict of interest statement

P.J.V. and B.M.T. are coinventors on a patent of CSF proteomic subtypes (published under patent no. US2022196683A1, owner VUmc Foundation). E.V. is cofounder of ADx NeuroSciences, while J.G. is an employee of ADx NeuroSciences. F.B. is on the steering committee or data safety monitoring board for Biogen, Merck, ATRI/ACTC and Prothena. He is a consultant for Roche, Celltrion, Rewind Therapeutics, Merck, IXICO, Jansen and Combinostics. He has research agreements with Merck, Biogen, GE Healthcare and Roche, and he is cofounder and shareholder of Queen Square Analytics LTD. L.V. received consulting fees from Roche and Olink, all paid to Amsterdam UMC. C.E.T. performed contract research for ADx NeuroSciences, AC-Immune, Aribio, Axon Neurosciences, Beckman-Coulter, BioConnect, Bioorchestra, Brainstorm Therapeutics, Celgene, Cognition Therapeutics, EIP Pharma, Eisai, Eli Lilly, Fujirebio, Grifols, Instant Nano Biosensors, Merck, Novo Nordisk, Olink, PeopleBio, Quanterix, Roche, Siemens, Toyama and Vivoryon. She is editor of Alzheimer Research and Therapy, and serves on the editorial boards of Medidact Neurologie/Springer and Neurology: Neuroimmunology & Neuroinflammation. The remaining authors declare no competing interests.

Figures

Fig. 1
Fig. 1. Biological description of AD subtypes.
a, Patient subtypes projected to the uniform manifold approximation and projection (UMAP) space. b, CSF protein levels (rows) averaged across individuals within subtypes (columns). c, Cell-type-specificity signatures for proteins associated with the AD subtypes for proteins with increased (top row) and decreased (bottom row) level. The left circle diagram shows all cell types associated with a subtype combined. Proteins that could not be assigned to a specific cell type were not plotted (no colour to 100% in the left circle diagrams). The circle diagrams to the right zoom into the subcategories of specific cell types (neurons, glia, immune cells and endothelial cells). Cell-type specificity was determined according to the Human Protein Atlas. d, Top transcription factors associated with subtypes from the CHEA and ENCODE databases. e, Gene Ontology (GO) biological pathways associated with subtypes (see Supplementary Table 9 for all pathways). f, AD genetic risk factors associated with specific subtypes; white indicates not statistically significant. Differences between subtypes and controls were determined from linear regression models with estimated marginal means, providing a two-tailed test for group comparisons, uncorrected for multiple testing because this is a post hoc comparison. Supplementary Tables 4 and 9–11 list all the proteins, pathways, and transcription and genetic factors tested with the statistical metrics. NS, not statistically significant; S1, subtype 1 (hyperplasticity); S2, subtype 2 (innate immune activation); S3, subtype 3 (RNA dysregulation); S4, subtype 4 (choroid plexus dysfunction); S5, subtype 5 (blood–brain barrier dysfunction).
Fig. 2
Fig. 2. AD subtype comparisons on MRI and clinical outcomes.
a, Median hippocampal volume as the percentage of total intracranial volume (TIV) compared to subtypes in the dementia stage. b, Choroid plexus volume as the percentage of TIV compared to subtypes in the dementia stage. c, Cortical atrophy associated with AD subtypes in the dementia stage compared to controls (n = 160). β indicates mean cortical thickness in mm, averaged over the right and left hemispheres and adjusted for age and sex. d, Clinical progression from MCI to dementia according to subtype (left; excluding subtype 3 due to n = 2) and time from dementia to death according to subtypes (right). All atrophy measures are based on individuals with dementia only. a,b, The boxplots depict the median in the center; the boundaries indicate the first and third quartiles, while the whiskers extend up and down to 1.5 times the interquartile range (limited to actual observed data points), and the points indicate individual person values (subtype 1, n = 37; subtype 2, n = 45; subtype 3, n = 12; subtype 4, n = 40; subtype 5, n = 25). See Supplementary Tables 6a,b and 8 for the detailed statistical metrics.
Fig. 3
Fig. 3. Replication of AD subtypes in six cohorts.
a, Subtype probability for each individual in six replication cohorts. Most individuals showed high probability for one subtype only. be, Subtype comparisons on CSF t-tau levels (b), p-tau (c), age (d) and the CSF over serum albumin ratio (e) for each replication cohort when available. be, The boxplots depict the median in the center, the boundaries indicate the first and third quartiles, the whiskers extend up and down to 1.5 times the interquartile range (limited to actual observed data points) and the points indicate individual person values. The number of individuals per group in the boxplots are listed in Supplementary Tables 12 and 13, and provides the statistical metrics for the comparisons. NA, not applicable.
Extended Data Fig. 1
Extended Data Fig. 1. Trajectories of repeated cognitive test scores over time for AD subtypes.
Analyses were stratified according to clinical stage. In all plots the grey line represents the trajectory of the control group (that is, individuals with intact cognition and normal CSF markers). * indicates that the slope differs from zero with p < 0.05. a indicates slope different from controls, b indicates slope different from subtype 1, c indicates slope different from subtype 2, d indicates slope different from subtype 3, e indicates slope different from subtype 4 and f indicates slope different from subtype 5. See Supplementary Table 7 for statistical metrics.
Extended Data Fig. 2
Extended Data Fig. 2. Trajectories of repeated cognitive scores for subtype 3 individuals without dementia.
Grey lines indicate individuals with dementia and subtype 3. MMSE includes one individual with normal cognition (blue line), all other tests include two individuals with MCI (red lines). No statistics were performed for predementia individuals due to small sample size.
Extended Data Fig. 3
Extended Data Fig. 3. Comparing subtypes on cortical thickness in dementia stage.
ß indicates mean cortical thickness in mm, averaged over right and left hemispheres and adjusted for age and sex. a) Cortical thickness compared between AD subtypes (in dementia stage) with controls. b) Cortical thickness comparisons between AD subtypes within the dementia stage. Negative values indicate thinner cortex in the subtype indicated in the row as compared to the subtype indicated in the column. Analyses were adjusted for age and sex.
Extended Data Fig. 4
Extended Data Fig. 4. Comparing Alzheimer’s disease (AD) subtypes on protein levels against controls, plotted separately according to clinical stage.
Left for cognitively normal with abnormal amyloid, middle for MCI with abnormal amyloid and right for AD dementia and abnormal amyloid. Plots indicates highly similar subtype patterns, suggesting that protein levels reflect particular AD related traits. See Supplementary Table 5 columns CY to HU for statistical metrics of subtype comparisons within each clinical stage. All proteins were scaled according to the mean and standard deviation of the control group, such that positive values indicate higher levels than controls, and negative values lower levels than controls.
Extended Data Fig. 5
Extended Data Fig. 5. Batch correction of TMT experiments.
a) Biplot of first two principal components on unnormalized protein abundances have batch effects between TMT experiments as indicated by the non-overlapping circles that correspond to all 44 TMT experiments. b) Batch effects were successfully removed with the Internal Reference Scaling method as described in the online methods.

References

    1. Nichols E, et al. Estimation of the global prevalence of dementia in 2019 and forecasted prevalence in 2050: an analysis for the Global Burden of Disease Study 2019. Lancet Public Health. 2022;7:e105–e125. doi: 10.1016/S2468-2667(21)00249-8. - DOI - PMC - PubMed
    1. Johnson ECB, et al. Large-scale deep multi-layer analysis of Alzheimer’s disease brain reveals strong proteomic disease-related changes not observed at the RNA level. Nat. Neurosci. 2022;25:213–225. doi: 10.1038/s41593-021-00999-y. - DOI - PMC - PubMed
    1. Higginbotham L, et al. Integrated proteomics reveals brain-based cerebrospinal fluid biomarkers in asymptomatic and symptomatic Alzheimer’s disease. Sci. Adv. 2020;6:eaaz9360. doi: 10.1126/sciadv.aaz9360. - DOI - PMC - PubMed
    1. Bellenguez C, et al. New insights into the genetic etiology of Alzheimer’s disease and related dementias. Nat. Genet. 2022;54:412–436. doi: 10.1038/s41588-022-01024-z. - DOI - PMC - PubMed
    1. Neff RA, et al. Molecular subtyping of Alzheimer’s disease using RNA sequencing data reveals novel mechanisms and targets. Sci. Adv. 2021;7:eabb5398. doi: 10.1126/sciadv.abb5398. - DOI - PMC - PubMed