. 2024 Jan 9;15(1):404.
doi: 10.1038/s41467-023-44211-0.

IgM N-glycosylation correlates with COVID-19 severity and rate of complement deposition

Collaborators, Affiliations

IgM N-glycosylation correlates with COVID-19 severity and rate of complement deposition

Benjamin S Haslund-Gourley et al. Nat Commun. .

Abstract

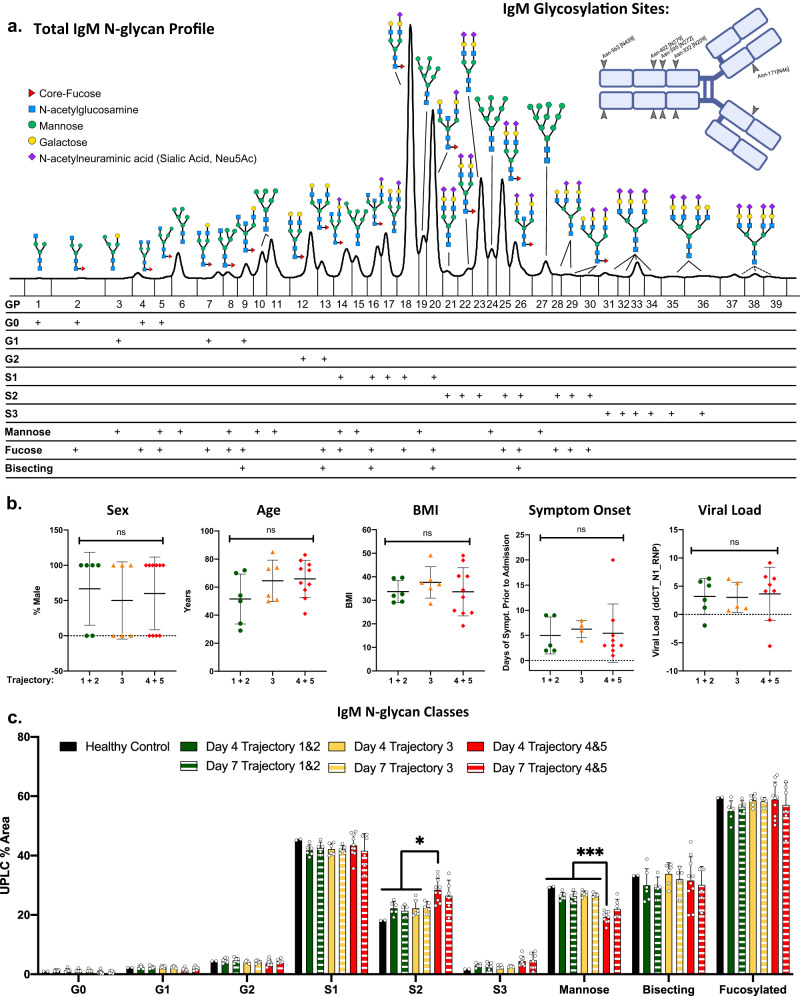
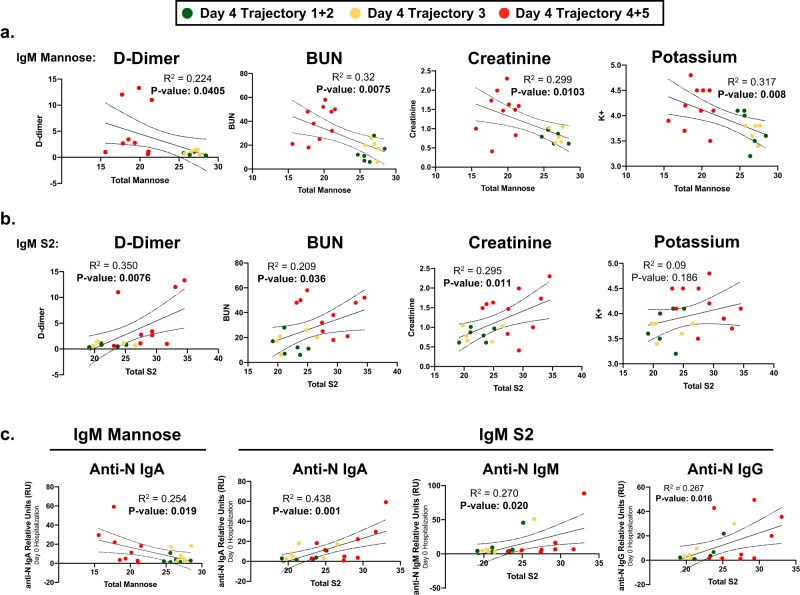
The glycosylation of IgG plays a critical role during human severe acute respiratory syndrome coronavirus 2 (SARS-CoV-2) infection, activating immune cells and inducing cytokine production. However, the role of IgM N-glycosylation has not been studied during human acute viral infection. The analysis of IgM N-glycosylation from healthy controls and hospitalized coronavirus disease 2019 (COVID-19) patients reveals increased high-mannose and sialylation that correlates with COVID-19 severity. These trends are confirmed within SARS-CoV-2-specific immunoglobulin N-glycan profiles. Moreover, the degree of total IgM mannosylation and sialylation correlate significantly with markers of disease severity. We link the changes of IgM N-glycosylation with the expression of Golgi glycosyltransferases. Lastly, we observe antigen-specific IgM antibody-dependent complement deposition is elevated in severe COVID-19 patients and modulated by exoglycosidase digestion. Taken together, this work links the IgM N-glycosylation with COVID-19 severity and highlights the need to understand IgM glycosylation and downstream immune function during human disease.


Conflict of interest statement

The Icahn School of Medicine at Mount Sinai has filed patent applications relating to SARS-CoV-2 serological assays and NDV-based SARS-CoV-2 vaccines which list Florian Krammer (F.K.) as co-inventor. Mount Sinai has spun out a company, Kantaro, to market serological tests for SARS-CoV-2. F.K. has consulted for Merck, Seqirus, Curevac and Pfizer, and is currently consulting for GSK, Gritstone, 3rd Rock Ventures and Avimex and he is a co-founder and scientific advisory board member of CastleVax. The Krammer laboratory is also collaborating with Pfizer on animal models of SARS-CoV-2 and Dynavax on influenza virus vaccines. All other authors have no competing interests to declare.

Figures

Fig. 1
Fig. 1. IgM N-glycosylation analysis reveals differences in COVID-19 patients stratified by trajectory.
a IgM N-glycans labeled with the RapiFluor (RFMS) were profiled with UPLC-FLR-ESI-MS. The resulting N-glycans were identified using mass spectrometry and retention time data. Please see Supplementary Table 1 for a complete list of N-glycans. Dashed lines represent N-glycans without confirmed mass identities due to the limitation of the RFMS label in the QDa mass spectrometer. IgM monomer is displayed with the 5 conserved glycosylation sites labeled, created using BioRender. GP = glycan peaks. b Cohort demographics: Sex, age, body mass index (BMI), time from symptom onset to hospital admission, and viral load expressed as the delta-delta change between SARS-CoV-2 nucleocapsid protein 1 (N1) and the house keeping gene RNP via RT qPCR are presented stratified across trajectory 1–2 (n = 6), 3 (n = 6), and 4-5 (n = 10) data are presented at mean values +/– S.D. Data was analyzed for significance using a one-way ANOVA with Tukey’s multiple comparisons test. c IgM N-glycans are grouped by class: G0 refers to core diantennary N-glycans lacking galactose, G1 refers to core diantennary N-glycans with a single galactose, G2 refers to core diantennary N-glycans with two galactoses, S1 refers to diantennary N-glycans with a single sialic acid, S2 refers to di- and tri-antennary N-glycans with two sialic acids, S3 refers to triantennary N-glycans with three sialic acids, Mannose refers to M4-M10 and hybrid-type N-glycans, Bisecting refers to any N-glycan with a bisecting GlcNAc moiety, Fucosylated refers to any N-glycan with a core-fucose. Healthy Control (n = 2), Day 4 Trajectory 1&2 (n = 6), Day 7 Trajectory 1&2 (n = 5), Day 4 Trajectory 3 (n = 6), Day 7 Trajectory 3 (n = 5), Day 4 Trajectory 4&5 (n = 10), Day 7 Trajectory 4&5 (n = 6). N-glycan classes are graphed as mean values +/– S.D. Statistical significance was determined using a one-way ANOVA with Tukey’s multiple comparisons test *p < 0.05, ***p < 0.001. Source data are provided as a Source Data file.
Fig. 2
Fig. 2. IgM N-glycan profile stratifies cohorts of nonsevere from severe trajectory COVID-19 patients.
a IgG N-glycans from healthy control (n = 2), day 4 trajectory 1–3 (n = 12), and day 4 trajectory 4&5 (n = 10) cohorts. N-glycans are graphed as grouped classes––see supplemental Fig. 4 for a full list of N-glycans and N-glycan grouping. b IgM N-glycan profiles from cohorts of healthy control (n = 2), day 4 trajectory 1–3 (n = 12), and day 4 trajectory 4&5 (n = 10) hospitalized COVID patients. Data are presented as mean values +/– S.D. See Fig. 1c for a detailed explanation of N-glycan classes. c IgM mannosylated N-glycans from non-severe compared to severe COVID-19. A summation of the indicated mannose/hybrid N-glycan sub-groups are graphed to the right. IgM N-glycan classes are graphed as mean +/– S.D. Statistical significance was determined using two-sided unpaired t-tests *p < 0.05, **p < 0.01, ***p < 0.001. Source data are provided as a Source Data file.
Fig. 3
Fig. 3. Changes in IgM N-glycosylation correlate with PBMC glycosyltransferase/glycosidase mRNA expression.
a COVID-19 trajectory 1–3 (nonsevere, n = 12 biologically independent samples) and trajectory 4 and 5 (severe, n = 10 biologically independent samples) expression of glycosyltransferases were significantly different between MAN1A2 (p = 0.007), MAN2A1 (p = 0.025), ST3GAL4 (p = 0.018), and ST6GALNAC2 (p = 0.025). Data are presented as mean values +/– S.D. The role of each glycosidase and glycosyltransferase are depicted below. b Total mannose on IgM positively correlated with MAN1A2 and TMTC3 expression while negatively correlating with ST3GAL4 expression. The summation of sialic acids on IgM positively correlated with ST3GAL4 expression. mRNA expression is graphed as mean +/– S.D. Statistical significance was determined using a two-sided Kruskal-Wallis test with *p < 0.05 and **p < 0.01. Associations between IgM N-glycosylation and mRNA expression were determined using simple linear regression analysis. Source data are provided as a Source Data file.
Fig. 4
Fig. 4. Changes in IgM N-glycosylation Associate with Clinical Markers of COVID-19 Severity.
a Total mannose content (summation of M4-M10 and hybrid N-glycans) was correlated to hospital laboratory measurements of D-dimer, Blood urea nitrogen (BUN), creatinine, and potassium measured on day 4 of hospitalization using simple linear regression analysis. R2 and p-values are reported for each comparison, estimated by simple linear regression, with bolded p-values considered statistically significant. b Total di-sialylated (S2) N-glycans were correlated with hospital laboratory measurements of D-dimer, BUN, creatinine, and potassium using simple linear regression. R2 and p-values are reported for each comparison, estimated by simple linear regression, with bolded p-values considered statistically significant. c Anti-nucleocapsid protein (anti-N) IgA, IgM, and IgG detected from patient plasma donated at the time of hospital admission (Day 0) were correlated to IgM mannose content and S2 content. Green dots identify day 4 Trajectory 1 + 2, yellow dots identify day 4 trajectory 3, and red dots identify day 4 trajectory 4 + 5 hospitalized COVID-19 cohorts. R2 and p-values are reported for each comparison, estimated by simple linear regression, with bolded p-values considered statistically significant. Source data are provided as a Source Data file.
Fig. 5
Fig. 5. Assessment of Day 4 SARS-CoV-2 spike S1-specific immunoglobulin G and M heavy chain N-glycosylation.
a Fluorescent N-glycan traces are overlaid from day 4 pooled severe (red line) and day 4 nonsevere (black line) anti-SARS-CoV-2 spike S1 IgG heavy chain (50 kDa) isolated from SDS-PAGE gel plugs b Fluorescent N-glycan traces are overlaid from day 4 pooled severe (red line) and day 4 nonsevere (black line) anti-SARS-CoV-2 spike S1 IgM heavy chain (75 kDa) isolated from SDS-PAGE gel plugs. c Sialidase digested fluorescent N-glycan traces are overlaid from day 4 pooled severe (red line) and day 4 nonsevere (black line) anti-SARS-CoV-2 spike S1 IgM heavy chain (75 kDa) isolated from SDS-PAGE gel plugs. Glycan peak (GP) number and Glucose units (GU) are indicated under each immunoglobulin heavy chain trace. N-glycosylation sites of IgG and IgM are presented in the upper right corner of each panel, created using BioRender. Green bars indicate high-mannose content while yellow bars indicate complex-type glycosylation sites on the IgM heavy chain. N-glycans with visible differences between severe and nonsevere cohort N-glycan profiles are displayed.
Fig. 6
Fig. 6. Antigen-specific complement deposition (ADCD) induced by plasma and IgM from severe and nonsevere COVID-19 cohorts.
a Gating strategy for the detection of complement deposition on fluorescent beads using flow cytometry. b ADCD assay using the RBD antigen assayed two times with pooled day 4 trajectory 1–3 (n = 1 biologically independent sample) and pooled day 4 trajectory 4&5 (n = 1 biologically independent sample) plasma or IgM. Data are presented as mean values +/– S.D. c SARS-CoV-2 spike S1 antigen was assayed for ADCD with pooled day 4 trajectory 1–3 (n = 1 biologically independent sample) and pooled day 4 trajectory 4&5 (n = 1 biologically independent sample) plasma six times. Spike S1 antigen was assayed for ADCD with pooled day 4 trajectory 1-3 (n = 1 biologically independent sample) and pooled day 4 trajectory 4&5 (n = 1 biologically independent sample) IgM five times. Data are presented as mean values +/– S.D. d Plasma and IgM samples from pooled day 4 trajectory 1–3 (n = 1 biologically independent sample) and pooled day 4 trajectory 4&5 (n = 1 biologically independent sample) remained undigested (U) before assaying for ADCD six times for plasma and five times for IgM. Samples of plasma and IgM from day 4 trajectory 1–3 (n = 1 biologically independent sample) and pooled day 4 trajectory 4&5 (n = 1 biologically independent sample) were digested with sialidase (S) before assaying for ADCD two times. Data are presented as mean values +/– S.D. Dotted horizontal lines refer to background binding by FITC anti-C3 antibody in PBS-only samples. Statistical significance was determined using a two-sided unpaired t-test. Source data are provided as a Source Data file.

Update of

References

    1. Jha P, Brown PE, Ansumana R. Counting the global COVID-19 dead. Lancet. 2022;399:1937–1938. doi: 10.1016/S0140-6736(22)00845-5. - DOI - PMC - PubMed
    1. Li W, et al. Angiotensin-converting enzyme 2 is a functional receptor for the SARS coronavirus. Nature. 2003;426:450–454. doi: 10.1038/nature02145. - DOI - PMC - PubMed
    1. Hernandez Acosta RA, et al. COVID-19 Pathogenesis and Clinical Manifestations. Infect. Dis. Clin. North Am. 2022;36:231–249. doi: 10.1016/j.idc.2022.01.003. - DOI - PMC - PubMed
    1. Yu H-H, et al. D-dimer level is associated with the severity of COVID-19. Thromb. Res. 2020;195:219–225. doi: 10.1016/j.thromres.2020.07.047. - DOI - PMC - PubMed
    1. Soy M, Keser G, Atagündüz P. Pathogenesis and treatment of cytokine storm in COVID-19. Turk. J. Biol. 2021;45:372–389. doi: 10.3906/biy-2105-37. - DOI - PMC - PubMed