. 2024 Jan;30(1):149-167.
doi: 10.1038/s41591-023-02743-4. Epub 2024 Jan 9.

Health effects associated with exposure to secondhand smoke: a Burden of Proof study

Affiliations

Health effects associated with exposure to secondhand smoke: a Burden of Proof study

Luisa S Flor et al. Nat Med. 2024 Jan.

Erratum in

Abstract

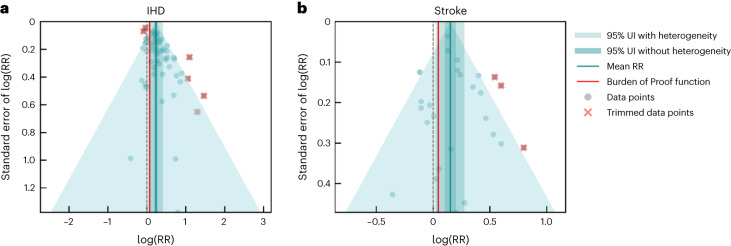
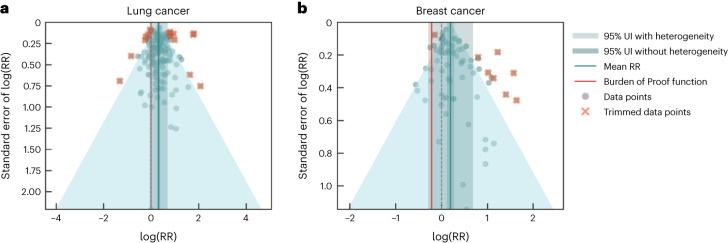
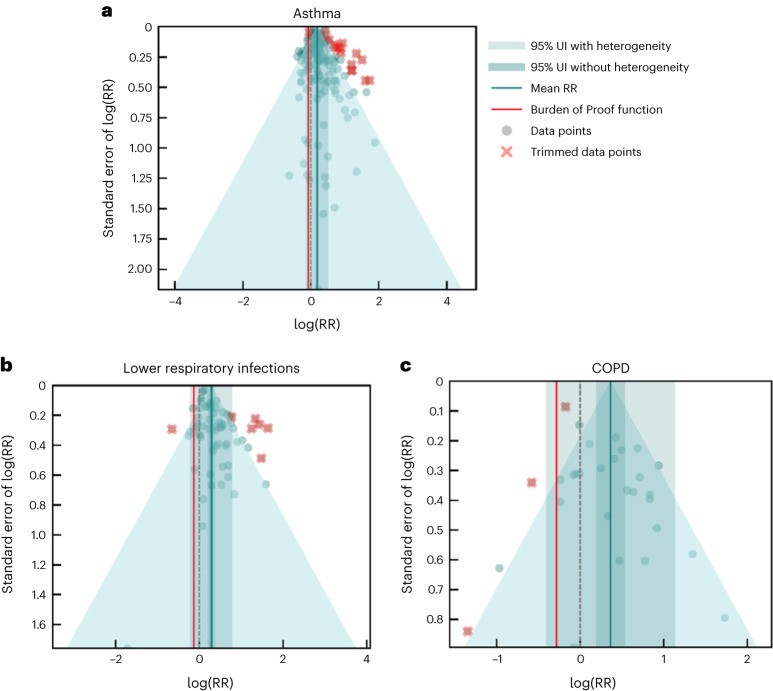
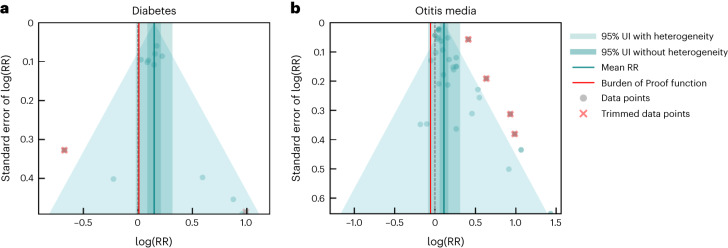
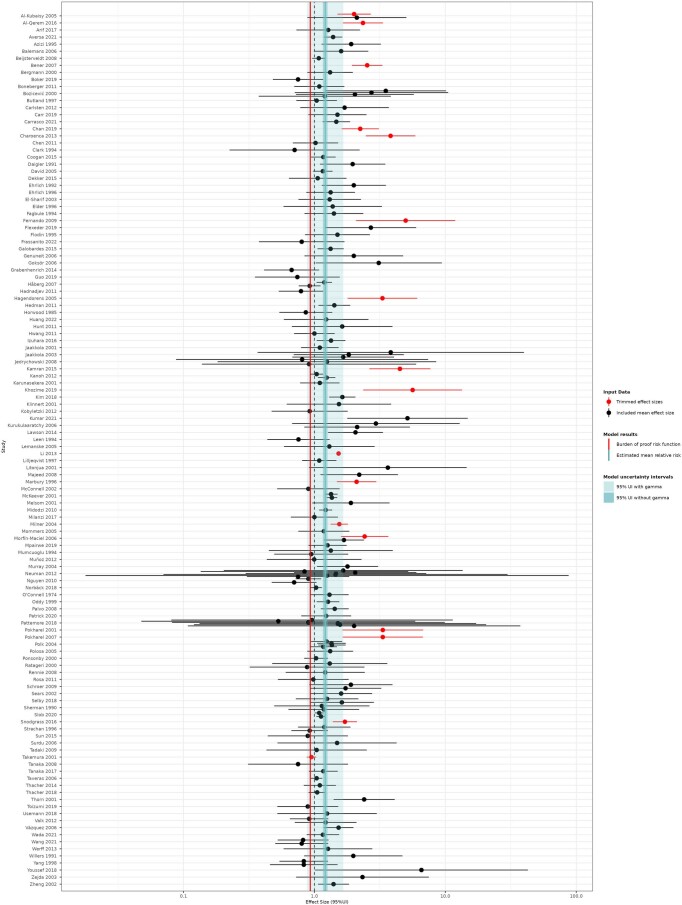
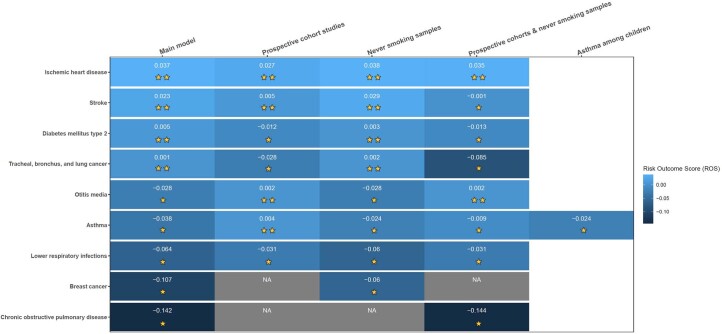
Despite a gradual decline in smoking rates over time, exposure to secondhand smoke (SHS) continues to cause harm to nonsmokers, who are disproportionately children and women living in low- and middle-income countries. We comprehensively reviewed the literature published by July 2022 concerning the adverse impacts of SHS exposure on nine health outcomes. Following, we quantified each exposure-response association accounting for various sources of uncertainty and evaluated the strength of the evidence supporting our analyses using the Burden of Proof Risk Function methodology. We found all nine health outcomes to be associated with SHS exposure. We conservatively estimated that SHS increases the risk of ischemic heart disease, stroke, type 2 diabetes and lung cancer by at least around 8%, 5%, 1% and 1%, respectively, with the evidence supporting these harmful associations rated as weak (two stars). The evidence supporting the harmful associations between SHS and otitis media, asthma, lower respiratory infections, breast cancer and chronic obstructive pulmonary disease was weaker (one star). Despite the weak underlying evidence for these associations, our results reinforce the harmful effects of SHS on health and the need to prioritize advancing efforts to reduce active and passive smoking through a combination of public health policies and education initiatives.


Conflict of interest statement

The authors of this manuscript declare no competing interests.

Figures

Fig. 1
Fig. 1. Modified funnel plots for SHS exposure and two cardiovascular outcomes.
a,b, These modified funnel plots show the residuals of the reported mean RR relative to 0, the null value, on the x axis and the residuals of the standard error, as estimated from both the reported standard error and gamma, relative to 0 on the y axis, for IHD (a) and stroke (b). The light-blue vertical interval corresponds to the 95% uncertainty interval incorporating between-study heterogeneity; the dark-blue vertical interval corresponds to the 95% uncertainty interval (UI) without between-study heterogeneity; the dots are each included observation; the red Xs are outliered observations; the gray dotted line reflects the null log(RR); the blue line is the mean log(RR) for SHS and the outcome of interest; and the red line is the Burden of Proof function at the fifth quantile for these harmful risk–outcome associations.
Fig. 2
Fig. 2. Modified funnel plots for SHS exposure and two cancer outcomes.
a,b, These modified funnel plots show the residuals of the reported mean RR relative to 0, the null value, on the x axis and the residuals of the standard error, as estimated from both the reported standard error and gamma, relative to 0 on the y axis, for lung cancer (a) and breast cancer (b). The light-blue vertical interval corresponds to the 95% uncertainty interval incorporating between-study heterogeneity; the dark-blue vertical interval corresponds to the 95% uncertainty interval (UI) without between-study heterogeneity; the dots are each included observation; the red Xs are outliered observations; the gray dotted line reflects the null log(RR); the blue line is the mean log(RR) for SHS and the outcome of interest; the red line is the Burden of Proof function at the fifth quantile for these harmful risk–outcome associations.
Fig. 3
Fig. 3. Modified funnel plots for SHS exposure and three respiratory outcomes.
These modified funnel plots show the residuals of the reported mean RR relative to 0, the null value, on the x axis and the residuals of the standard error, as estimated from both the reported standard error and gamma, relative to 0 on the y axis, for asthma (a), lower respiratory infections (b) and COPD (c). The light-blue vertical interval corresponds to the 95% uncertainty interval incorporating between-study heterogeneity; the dark-blue vertical interval corresponds to the 95% uncertainty interval (UI) without between-study heterogeneity; the dots are each included observation; the red Xs are outliered observations; the gray dotted line reflects the null log(RR); the blue line is the mean log(RR) for SHS and the outcome of interest; the red line is the Burden of Proof function at the fifth quantile for these harmful risk–outcome associations.
Fig. 4
Fig. 4. Modified funnel plots for SHS exposure and type 2 diabetes and otitis media.
a,b, These modified funnel plots show the residuals of the reported mean RR relative to 0, the null value, on the x axis and the residuals of the standard error, as estimated from both the reported standard error and gamma, relative to 0 on the y axis, for type 2 diabetes (a) and otitis media (b). The light-blue vertical interval corresponds to the 95% uncertainty interval incorporating between-study heterogeneity; the dark-blue vertical interval corresponds to the 95% uncertainty interval (UI) without between-study heterogeneity; the dots are each included observation; the red Xs are outliered observations; the gray dotted line reflects the null log(RR); the blue line is the mean log(RR) for SHS and the outcome of interest; the red line is the Burden of Proof function at the fifth quantile for these harmful risk–outcome associations.
Extended Data Fig. 1
Extended Data Fig. 1. Forest plot of the association between secondhand smoke exposure and ischemic heart disease.
This forest plot presents the estimated mean relative risk, its 95% uncertainty intervals (UI), and the data points underlying the estimates for ischemic heart disease in association with secondhand smoke exposure (two-star rating of the risk-outcome relationship). The color of the point indicates whether the point was detected and trimmed as an outlier. The light blue interval corresponds to the 95% UI incorporating between-study heterogeneity; the dark blue interval corresponds to the 95% UI without between-study heterogeneity. The black vertical dotted line reflects the null relative risk value (one) and the red vertical line is the burden of proof function at the 5th quantile for this harmful risk-outcome association. The black data points and horizontal lines each correspond to a mean effect size and 95% UI from the included study identified on the y-axis. We included multiple observations from a single study when effects were reported by location or source of exposure and/or separately by sex or other subgroups. See Supplementary Table 4 for more details on included observations from each study (n = 37 studies).
Extended Data Fig. 2
Extended Data Fig. 2. Forest plot of the association between secondhand smoke exposure and stroke.
This forest plot presents the estimated mean relative risk, its 95% uncertainty intervals (UI), and the data points underlying the estimates for ischemic heart disease in association with secondhand smoke exposure (two-star rating of the risk-outcome relationship). The color of the point indicates whether the point was detected and trimmed as an outlier. The light blue interval corresponds to the 95% UI incorporating between-study heterogeneity; the dark blue interval corresponds to the 95% UI without between-study heterogeneity. The black vertical dotted line reflects the null relative risk value (one) and the red vertical line is the burden of proof function at the 5th quantile for this harmful risk-outcome association. The black data points and horizontal lines each correspond to a mean effect size and 95% UI from the included study identified on the y-axis. We included multiple observations from a single study when effects were reported by location or source of exposure and/or separately by sex or other subgroups. See Supplementary Table 5 for more details on included observations from each study (n = 20 studies).
Extended Data Fig. 3
Extended Data Fig. 3. Forest plot of the association between secondhand smoke exposure and lung cancer.
This forest plot presents the estimated mean relative risk, its 95% uncertainty intervals (UI), and the data points underlying the estimates for ischemic heart disease in association with secondhand smoke exposure (two-star rating of the risk-outcome relationship). The color of the point indicates whether the point was detected and trimmed as an outlier. The light blue interval corresponds to the 95% UI incorporating between-study heterogeneity; the dark blue interval corresponds to the 95% UI without between-study heterogeneity. The black vertical dotted line reflects the null relative risk value (one) and the red vertical line is the burden of proof function at the 5th quantile for this harmful risk-outcome association. The black data points and horizontal lines each correspond to a mean effect size and 95% UI from the included study identified on the y-axis. We included multiple observations from a single study when effects were reported by location or source of exposure and/or separately by sex or other subgroups. See Supplementary Table 6 for more details on included observations from each study (n = 104 studies).
Extended Data Fig. 4
Extended Data Fig. 4. Forest plot of the association between secondhand smoke exposure and breast cancer.
This forest plot presents the estimated mean relative risk, its 95% uncertainty intervals (UI), and the data points underlying the estimates for ischemic heart disease in association with secondhand smoke exposure (one-star rating of the risk-outcome relationship). The color of the point indicates whether the point was detected and trimmed as an outlier. The light blue interval corresponds to the 95% UI incorporating between-study heterogeneity; the dark blue interval corresponds to the 95% UI without between-study heterogeneity. The black vertical dotted line reflects the null relative risk value (one) and the red vertical line is the burden of proof function at the 5th quantile for this harmful risk-outcome association. The black data points and horizontal lines each correspond to a mean effect size and 95% UI from the included study identified on the y-axis. We included multiple observations from a single study when effects were reported by location or source of exposure and/or separately by sex or other subgroups. See Supplementary Table 7 for more details on included observations from each study (n = 51 studies).
Extended Data Fig. 5
Extended Data Fig. 5. Forest plot of the association between secondhand smoke exposure and asthma.
This forest plot presents the estimated mean relative risk, its 95% uncertainty intervals (UI), and the data points underlying the estimates for ischemic heart disease in association with secondhand smoke exposure (one-star rating of the risk-outcome relationship). The color of the point indicates whether the point was detected and trimmed as an outlier. The light blue interval corresponds to the 95% UI incorporating between-study heterogeneity; the dark blue interval corresponds to the 95% UI without between-study heterogeneity. The black vertical dotted line reflects the null relative risk value (one) and the red vertical line is the burden of proof function at the 5th quantile for this harmful risk-outcome association. The black data points and horizontal lines each correspond to a mean effect size and 95% UI from the included study identified on the y-axis. We included multiple observations from a single study when effects were reported by location or source of exposure and/or separately by sex or other subgroups. See Supplementary Table 8 for more details on included observations from each study (n = 125 studies).
Extended Data Fig. 6
Extended Data Fig. 6. Forest plot of the association between secondhand smoke exposure and lower respiratory infections.
This forest plot presents the estimated mean relative risk, its 95% uncertainty intervals (UI), and the data points underlying the estimates for ischemic heart disease in association with secondhand smoke exposure (one-star rating of the risk-outcome relationship). The color of the point indicates whether the point was detected and trimmed as an outlier. The light blue interval corresponds to the 95% UI incorporating between-study heterogeneity; the dark blue interval corresponds to the 95% UI without between-study heterogeneity. The black vertical dotted line reflects the null relative risk value (one) and the red vertical line is the burden of proof function at the 5th quantile for this harmful risk-outcome association. The black data points and horizontal lines each correspond to a mean effect size and 95% UI from the included study identified on the y-axis. We included multiple observations from a single study when effects were reported by location or source of exposure and/or separately by sex or other subgroups. See Supplementary Table 9 for more details on included observations from each study (n = 50 studies).
Extended Data Fig. 7
Extended Data Fig. 7. Forest plot of the association between secondhand smoke exposure and chronic obstructive pulmonary disease.
This forest plot presents the estimated mean relative risk, its 95% uncertainty intervals (UI), and the data points underlying the estimates for ischemic heart disease in association with secondhand smoke exposure (one-star rating of the risk-outcome relationship). The color of the point indicates whether the point was detected and trimmed as an outlier. The light blue interval corresponds to the 95% UI incorporating between-study heterogeneity; the dark blue interval corresponds to the 95% UI without between-study heterogeneity. The black vertical dotted line reflects the null relative risk value (one) and the red vertical line is the burden of proof function at the 5th quantile for this harmful risk-outcome association. The black data points and horizontal lines each correspond to a mean effect size and 95% UI from the included study identified on the y-axis. We included multiple observations from a single study when effects were reported by location or source of exposure and/or separately by sex or other subgroups. See Supplementary Table 10 for more details on included observations from each study (n = 21 studies).
Extended Data Fig. 8
Extended Data Fig. 8. plot of the association between secondhand smoke exposure and type 2 diabetes mellitus.
This forest plot presents the estimated mean relative risk, its 95% uncertainty intervals (UI), and the data points underlying the estimates for ischemic heart disease in association with secondhand smoke exposure (two-star rating of the risk-outcome relationship). The color of the point indicates whether the point was detected and trimmed as an outlier. The light blue interval corresponds to the 95% UI incorporating between-study heterogeneity; the dark blue interval corresponds to the 95% UI without between-study heterogeneity. The black vertical dotted line reflects the null relative risk value (one) and the red vertical line is the burden of proof function at the 5th quantile for this harmful risk-outcome association. The black data points and horizontal lines each correspond to a mean effect size and 95% UI from the included study identified on the y-axis. We included multiple observations from a single study when effects were reported by location or source of exposure and/or separately by sex or other subgroups. See Supplementary Table 11 for more details on included observations from each study (n = 9 studies).
Extended Data Fig. 9
Extended Data Fig. 9. plot of the association between secondhand smoke exposure and otitis media.
This forest plot presents the estimated mean relative risk, its 95% uncertainty intervals (UI), and the data points underlying the estimates for ischemic heart disease in association with secondhand smoke exposure (one-star rating of the risk-outcome relationship). The color of the point indicates whether the point was detected and trimmed as an outlier. The light blue interval corresponds to the 95% UI incorporating between-study heterogeneity; the dark blue interval corresponds to the 95% UI without between-study heterogeneity. The black vertical dotted line reflects the null relative risk value (one) and the red vertical line is the burden of proof function at the 5th quantile for this harmful risk-outcome association. The black data points and horizontal lines each correspond to a mean effect size and 95% UI from the included study identified on the y-axis. We included multiple observations from a single study when effects were reported by location or source of exposure and/or separately by sex or other subgroups. See Supplementary Table 12 for more details on included observations from each study (n = 24 studies).
Extended Data Fig. 10
Extended Data Fig. 10. Summarized results of the primary model and sensitivity analyses conducted across all nine health outcomes.
This heatmap reports the summarized results of the main model and the sensitivity analyses (columns) conducted for each of the nine health outcomes (rows) reported in this study. Detailed results for each of the sensitivity models are presented in the Supplementary Information (Supplementary Tables 13–16). Sensitivity analyses reflect the impact of restricting the input data to 1) prospective cohort studies, 2) observations associated with never-smokers, and 3) both prospective cohort studies and never-smoking samples. For asthma, we additionally restrict the data to children population aged 16 or less. General model parameters remained constant across models; we trimmed 10% of the data if more than 10 observations were available for the specific model. The color of the blue boxes and the number depicted in each box corresponds to the resulting risk-outcome score (ROS) calculated for models in which the estimates of association without incorporating between-study heterogeneity were statistically significant. Grey boxes depict models that did not pass this threshold and, thus, ROS did not apply (NA). For models that did pass this threshold, the ROS reflects a conservative interpretation of the data that aligns with the Burden of Proof approach incorporating between-study heterogeneity and other sources of uncertainty. The ROS is translated into a star rating from 1 to 5 stars based on thresholds outlined in Zheng et al. The star rating for each model result is reported as the yellow stars in each box. A one-star association suggests that there is weak evidence supporting estimates of an association between the risk and the outcome. A two-star association reflects that there is weak-to-moderate evidence suggesting an association between the risk and outcome, and additional stars illustrate increasing strength of evidence.

References

    1. Murray CJL, et al. Global burden of 87 risk factors in 204 countries and territories, 1990–2019: a systematic analysis for the Global Burden of Disease Study 2019. Lancet. 2020;396:1223–1249. doi: 10.1016/S0140-6736(20)30752-2. - DOI - PMC - PubMed
    1. Dai X, Gakidou E, Lopez AD. Evolution of the global smoking epidemic over the past half century: strengthening the evidence base for policy action. Tob. Control. 2022;31:129–137. doi: 10.1136/tobaccocontrol-2021-056535. - DOI - PubMed
    1. Mbulo L, et al. Secondhand smoke exposure at home among one billion children in 21 countries: findings from the Global Adult Tobacco Survey (GATS) Tob. Control. 2016;25:e95–e100. doi: 10.1136/tobaccocontrol-2015-052693. - DOI - PMC - PubMed
    1. Gakidou E, et al. Global, regional, and national comparative risk assessment of 84 behavioural, environmental and occupational, and metabolic risks or clusters of risks, 1990–2016: a systematic analysis for the Global Burden of Disease Study 2016. Lancet. 2017;390:1345–1422. doi: 10.1016/S0140-6736(17)32366-8. - DOI - PMC - PubMed
    1. How Tobacco Smoke Causes Disease: The Biology and Behavioral Basis for Smoking-Attributable Disease: A Report of the Surgeon General (US Department of Health and Human Services, 2010). - PubMed

Publication types

Substances