Clinical Trial
. 2024 Feb;30(2):531-542.
doi: 10.1038/s41591-023-02760-3. Epub 2024 Jan 9.

Lymph-node-targeted, mKRAS-specific amphiphile vaccine in pancreatic and colorectal cancer: the phase 1 AMPLIFY-201 trial

Affiliations
Clinical Trial

Lymph-node-targeted, mKRAS-specific amphiphile vaccine in pancreatic and colorectal cancer: the phase 1 AMPLIFY-201 trial

Shubham Pant et al. Nat Med. 2024 Feb.

Abstract

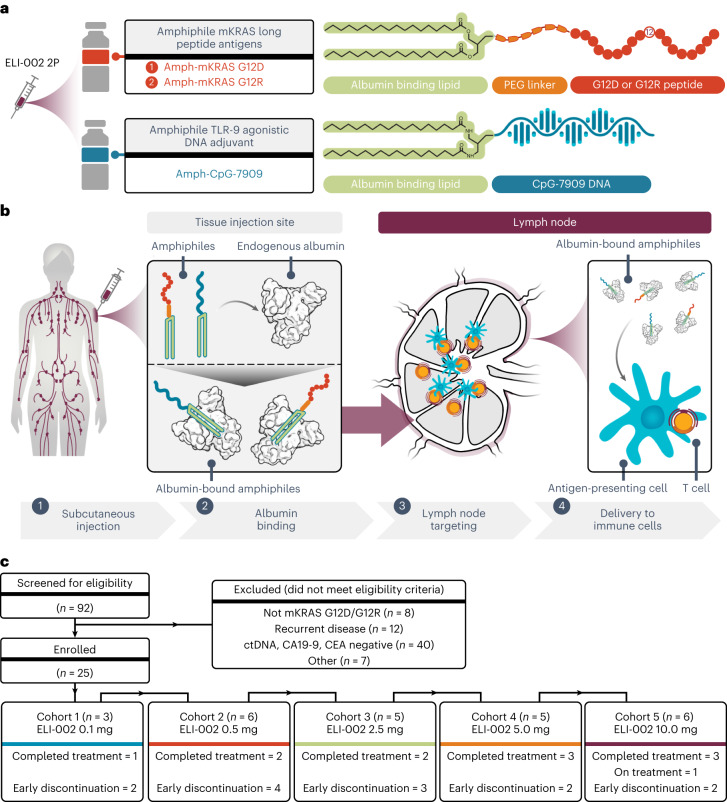
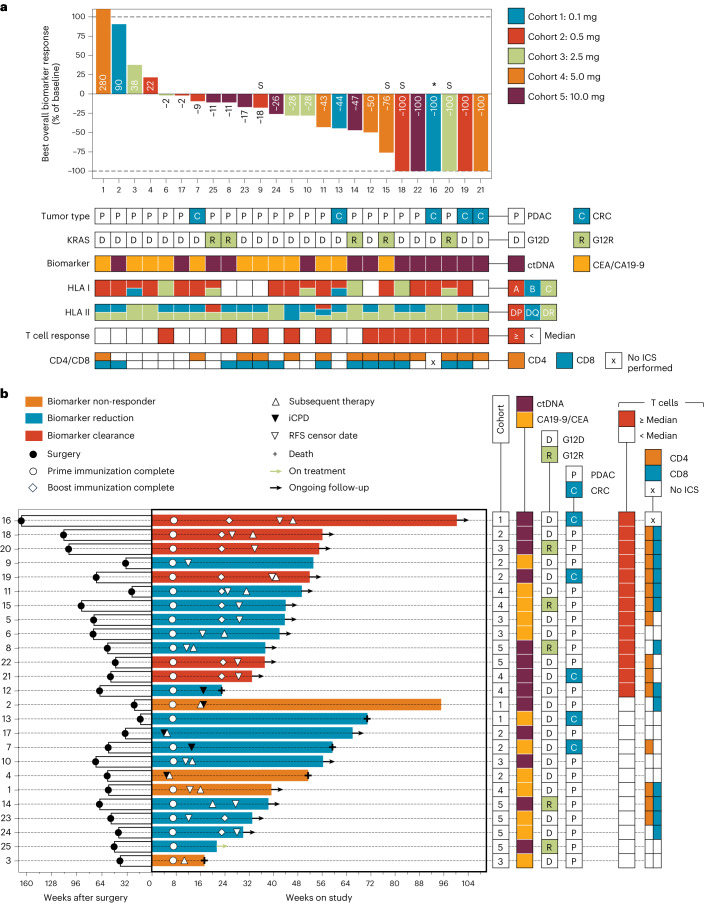
Pancreatic and colorectal cancers are often KRAS mutated and are incurable when tumor DNA or protein persists or recurs after curative intent therapy. Cancer vaccine ELI-002 2P enhances lymph node delivery and immune response using amphiphile (Amph) modification of G12D and G12R mutant KRAS (mKRAS) peptides (Amph-Peptides-2P) together with CpG oligonucleotide adjuvant (Amph-CpG-7909). We treated 25 patients (20 pancreatic and five colorectal) who were positive for minimal residual mKRAS disease (ctDNA and/or serum tumor antigen) after locoregional treatment in a phase 1 study of fixed-dose Amph-Peptides-2P and ascending-dose Amph-CpG-7909; study enrollment is complete with patient follow-up ongoing. Primary endpoints included safety and recommended phase 2 dose (RP2D). The secondary endpoint was tumor biomarker response (longitudinal ctDNA or tumor antigen), with exploratory endpoints including immunogenicity and relapse-free survival (RFS). No dose-limiting toxicities were observed, and the RP2D was 10.0 mg of Amph-CpG-7909. Direct ex vivo mKRAS-specific T cell responses were observed in 21 of 25 patients (84%; 59% both CD4+ and CD8+); tumor biomarker responses were observed in 21 of 25 patients (84%); biomarker clearance was observed in six of 25 patients (24%; three pancreatic and three colorectal); and the median RFS was 16.33 months. Efficacy correlated with T cell responses above or below the median fold increase over baseline (12.75-fold): median tumor biomarker reduction was -76.0% versus -10.2% (P < 0.0014), and the median RFS was not reached versus 4.01 months (hazard ratio = 0.14; P = 0.0167). ELI-002 2P was safe and induced considerable T cell responses in patients with immunotherapy-recalcitrant KRAS-mutated tumors. ClinicalTrials.gov identifier: NCT04853017 .


Conflict of interest statement

S.P. reports clinical research funding to institution from Arqule, Bristol Myers Squibb, Eli Lilly, Elicio Therapeutics, Holy Stone Healthcare, Ipsen, Mirati Therapeutics, Novartis, Rgenix, Sanofi-Aventis, Xencor, Astellas, Framewave, 4D Pharma, Boehringer Ingelheim, NGM Biopharmaceuticals, Janssen, Arcus Biosciences, BioNTech, Zymeworks and Pfizer. S.P. also reports consultant/advisory fees from Zymeworks, Ipsen, Novartis, Janssen and Boehringer Ingelheim. Z.A.W. has received consultant/advisory fees from Lilly Oncology, AstraZeneca, Merck, Daiichi Sankyo, Macrogenics, Amgen, Bristol Myers Squibb, Astellas, Ipsen, Arcus, Novartis, Roche, Seagen and Pfizer and has received research funding (institutional) from Elicio Therapeutics, Arcus, Plexxikon, Novartis and Merck. C.D.W. reports research funding from Elicio Therapeutics, Novartis, Actuate Therapeutics, Merck, AstraZeneca and Mirati and advisory board relationships with Ipsen, Actuate Therapeutics and Genentech. M.F. has received research funding (institutional) from AstraZeneca, Bristol Myers Squibb, Eli Lilly, Merck, Novartis, Pfizer, Roche, Genmab, Elicio Therapeutics, Mirati, Amgen, Replimmune, Checkmate Pharmaceuticals, Gilead, GlaxoSmithKline, Immunocore, Seagen, Tesaro and Abbvie and has been on advisory boards for Abbvie, Beigene, Jazz Pharmaceuticals, Mirati and AstraZeneca. P.M.K. reports a consultancy/advisory board relationship with Elicio (scientific advisory board member/stock ownership); consultancy/advisory board relationships with Guardant Health, Illumina, Natera, Foundation Medicine, Daichi Sankyo, Tempus, Bayer, MSD Oncology/Merck, Delcath Systems, QED Therapeutics, Taiho Oncology (self/institution), Exact Sciences, Eisai, BostonGene, Neogenomics, Saga Diagnostics, Servier, Seagen, Eli Lilly and Ipsen (to institution); and research funding/trial support from Merck (to institution), Novartis (to institution), Agenus Bio (to institution), Boston Scientific (to institution), Tersera (to institution) and Advanced Accelerator Applications as well as a travel grant for IIT from AstraZeneca. C.E.D. reports research funding from Elicio Therapeutics. A.D.L. reports institutional contracts with Elicio Therapeutics, Bristol Myers Squibb, Exelixis, Arrys Therapeutics, Hutchison Medipharma, Corcept Therapeutics, Conjupro Biotherapeutics and AbbVie for trials where she is the local principal investigator. She serves as Pancreatic Cancer/Neuroendocrine Co-Chair on the Elsevier ClinicalPath Oncology Committee. V.C. has held a consulting or advisory role at Ispen, Gristone Oncology, Westwood Bioscience and Apeiron Biologics; he has been on the speakers’ bureau for Ipsen and Celgene; and he has received research funding from Elicio Therapeutics, Roche and Merck. O.B. reports no relevant disclosures. H.V., L.M.S., A.M.T., J.R.P., E.W., L.K.M., P.C.D., T.K. and C.M.H. are current or former employees of Elicio Therapeutics and, as such, receive salary and benefits, including ownership of stock and stock options, from the company. L.K.M., P.C.D. and C.M.H. have amphiphile vaccine patents pending to Elicio Therapeutics. E.M.O. reports relationships with Rafael Therapeutics (DSMB); Seagen, Boehringer Ingelheim, BioNTech, Ipsen, Merck, Silenseed, Novartis, AstraZeneca, BioSapien, Thetis and Autem, Tempus (consulting/advisory relationship); Agios, Genentech/Roche, Eisai, Zymeworks (spouse: consulting/advisory relationship); and Genentech/Roche, Celgene/Bristol Myers Squibb, BioNTech, AstraZeneca, Arcus, Elicio Therapeutics, Parker Institute, Pertzye and NCI/NIH (research funding).

Figures

Fig. 1
Fig. 1. Design of ELI-002 2P, Amph mechanism of action and study participant disposition.
a, Schematic for ELI-002 2P vaccine components, including Amph-mKRAS G12D and G12R long peptide antigens and Amph-CpG-7909 TLR9 agonist. PEG, polyethylene glycol. b, Stepwise schematic for Amph-directed lymph-node-targeted biodistribution mechanism using albumin ‘hitchhiking’: (1) subcutaneous Amph injection, followed by (2) lipid-mediated non-covalent molecular association of Amph vaccines with tissue-resident endogenous albumin, resulting in (3) preferential absorption into lymphatics and accumulation through afferent lymph flow into draining lymph nodes and, finally, (4) uptake of Amph vaccines by lymph-node-resident APCs to induce antigen presentation and coordinated co-stimulation of cognate T cells. c, CONSORT diagram. Patients were enrolled into five successive cohorts with progressively increasing doses of Amph-CpG-7909 with a fixed dose of Amph-Peptides 2P. Graphical elements from a and b were adapted from previous publications under a Creative Commons Attribution 4.0 International License (http://creativecommons.org/licenses/by/4.0/) (refs. ,).
Fig. 2
Fig. 2. ELI-002 2P treatment results in tumor biomarker reduction and clearance.
a, Best overall tumor biomarker response for study participants reported as percentage of the baseline value. Responses are annotated for patient number, dose cohort, participant tumor type, KRAS mutation, tumor biomarker type and presence or absence of previously reported mKRAS-responsive HLA class I and II. * Patient 16 underwent excisional biopsy to assess iRECIST, and T cell infiltrate was observed; a contribution to ctDNA clearance could not be ruled out. ‘S’ indicates that the patient underwent splenectomy. b, Swimmer plot supervised by T cell response (maximum fold change from baseline; top: ≥median; bottom: <median) showing time from surgery to start of ELI-002 2P (left) and time from start of ELI-002 2P to endpoint (right; data cutoff or death), n = 25. Bar color indicates best overall tumor biomarker response for each patient. Symbols annotate the timing of completion of prime and boost immunizations, the start of subsequent therapy, iCPD, the most recent date of censor for RFS (the date of the most recent radiographic scan before the date of subsequent therapy, the data cutoff or the date of death) and the date of death where applicable. Arrows indicate ongoing treatment or ongoing follow-up. iCPD, immune confirmed progressive disease.
Fig. 3
Fig. 3. Robust direct ex vivo mKRAS-specific T cell responses induced by ELI-002 2P in a majority of patients.
Patients were immunized with 1.4 mg of Amph-Peptides 2P admixed with 0.1, 0.5, 2.5, 5 or 10 mg of Amph-CpG-7909. PBMCs were collected for T cell response assessment at baseline and post-immunization timepoints. a, Shown is the fold change from baseline to maximum response in the ex vivo FluoroSpot assay or ICS assay for T cell responders (n = 21/25 patients). T cell responders are defined as patients having a ≥2-fold increase from baseline at any post-vaccination timepoint (dotted line) and >50 SFCs/1 × 106 PBMCs for FluoroSpot assay or >0.1% cytokine-positive for ICS assay. The median fold change is shown at 12.75, indicated by a dashed line. * Patients without baseline-detectable T cell responses (below the response threshold) had on-treatment fold change of 348×, 58.3×, 20.7×, 18.3×, 9.7×, 3.7× and 2.1×. b, Pie chart shows the percentage of T cell responders and non-responders to ex vivo FluoroSpot and ICS. c, Table shows the percentage of T cell responders to ex vivo FluoroSpot and ICS and average fold change of T cell responders per dose cohort. d, Pie chart depicts the percentage of T cell responders that induce CD4+, CD8+ or both CD4+ and CD8+ cytokine-positive cells in ICS assay. e, Pie chart indicates the percentage of T cell responders that induce T cell responses to 1, 2–4, 5–6 or all 7 assessed mKRAS antigens. f, Pie chart shows the percentage of T cell responders that induce T cell responses to immunizing antigens G12D and/or G12R. g, Bar graph indicates the number of mKRAS antigens that induced T cell responses after vaccination for each patient, n = 25. h, CD3 immunohistochemical analysis of hepatic tumor biopsy tissue section collected from patient 2 after observation of a contrast avid lesion by computed tomography (CT) 33 d after the start of treatment. Twenty-four CD3+ T cells per high-powered field (×400) were quantitated by the study pathologist in the region of highest labeling. i, CD3 immunohistochemical analysis of hepatic tumor biopsy tissue section collected from patient 18 after observation of a contrast avid lesion by CT. Seventy-six CD3+ T cells per high-powered field (×400) were quantitated by the study pathologist in the region of highest labeling. Pt., patient.
Fig. 4
Fig. 4. mKRAS T cell response correlates to tumor biomarker response and delayed tumor recurrence.
a, OS from study start (date of first vaccine dose), n = 25; n indicates individual patients. b, Best overall tumor biomarker response for study participants reported as percentage of the baseline value, stratified by T cell response (maximum fold change from baseline; ≥ median versus < median), n = 25. P value was calculated by two-tailed Mann–Whitney test. c, RFS from study start (date of first vaccine dose), n = 25; n indicates individual patients. Values depicted are mean ± s.d. d, RFS from study start (date of first vaccine dose) stratified by T cell response (maximum fold change from baseline; ≥median versus <median), n = 25; n indicates individual patients. HR indicates hazard ratio with 95% CI. P values were calculated using two-tailed log-rank test.
Extended Data Fig. 1
Extended Data Fig. 1. Study schema.
Treatment with ELI-002 2P was conducted in a priming immunization period (B: baseline – week 7) and subsequent boosting immunization period (week 20-23) for CRC or PDAC patients exhibiting tumor expression of mKRAS G12D or G12R following completion of locoregional therapy, radiological confirmation of no evidence of disease, and detection of either ctDNA or serum tumor biomarker indicating positivity for minimal residual disease (MRD).
Extended Data Fig. 2
Extended Data Fig. 2. ELI-002 2P treatment results in tumor biomarker reduction and clearance.
Longitudinal changes in biomarker levels as a percentage of baseline values for each evaluable patient, n = 25. Responses are annotated based on the best overall biomarker response observed for each patient during the course of study.
Extended Data Fig. 3
Extended Data Fig. 3. Robust direct ex vivo mKRAS-specific T cell responses induced by ELI-002 2P in a majority of patients.
Patients were immunized with 1.4 mg Amph-Peptides 2P admixed with 0.1, 0.5, 2.5, 5 or 10 mg of Amph-CpG-7909. PBMCs were collected for T cell response assessment at baseline and post-immunization timepoints. a, PBMCs were stimulated with OLPs to all 7 mKRAS antigens in the IFNγ/GrB Fluorospot assay for 44 hours. Shown are background-subtracted IFNγ and/or GrB SFCs per 1 × 10⁶ PBMCs for the maximum response for each patient. T cell responders are defined as a patients having ≥2-fold increase from baseline at any post-vaccination timepoint and >50 SFC/1×106 PBMCs (dotted line). b, PBMCs were stimulated with all 7 mKRAS OLPs prior to analysis for intracellular cytokines, IFNγ, TNFa and IL-2 by flow cytometry. Shown are frequencies of the maximum cytokine producing CD4+ or CD8+ T cells for each patient. T cell responders are defined as a patients having ≥2-fold increase from baseline at any post-vaccination timepoint and > 0.1% cytokine+ (dotted line). c, Pie chart shows the percentage of T cell responders that induce T cell responses to non-immunizing antigens (G12V, G12C, G12A, G12S, G13D). d, Pie chart depicts the percentage of T cell responders exhibiting pre-existing mKRAS-specific T cells seen at baseline before ELI-002 2P vaccination, n = 21. e, PBMCs were stimulated with OLPs to all 7 mKRAS antigens in the IFNγ/GrB Fluorospot assay for 44 hours. Shown are background-subtracted IFNγ and/or GrB SFCs per 1 × 10⁶ PBMCs for the 7 patients with post-booster vaccination timepoints. The arrows on the graph indicate the prime and boost vaccinations; dotted line indicates 50 SFC/1 x 106 PBMCs.
Extended Data Fig. 4
Extended Data Fig. 4. ELI-002 2P immunization induces robust T cell responses to mKRAS antigens.
Patient 11 was immunized with 1.4 mg Amph-Peptides 2P admixed with 5 mg of Amph-CpG-7909. PBMCs were collected for ex vivo T cell response assessments at baseline (B) and week 9. a, Schema showing dosing and experimental schedule. PBMCs were stimulated with OLPs to b, G12D or G12R, c, G12V, G12C, G12A, G12S or G13D or d, WT KRAS in the same IFNγ/GrB Fluorospot assay for 44 hours. Shown are background-subtracted IFNγ and/or GrB SFCs per 1 × 106 PBMCs; dotted line indicates 50 SFC/1 x 106 PBMCs. The pie charts in b, c show the percentage of mKRAS OLP-stimulated PBMCs at week 9 secreting IFNγ, GrB or both IFNγ and GrB. e, f, PBMCs were stimulated with G12R or G12D OLPs prior to analysis for intracellular cytokines, IFNγ, TNFa and IL-2 by flow cytometry. Shown are frequencies of total IL2, TNFα, IFNγ polyfunctional cytokine producing e, CD4+ and f, CD8+ T cells. The pie charts in e, f show the percentage of G12R and G12D stimulated PBMCs producing IFNγ, IL2, TNFα, producing 2 cytokines (2+) or producing 3 cytokines (3+) at week 9. g, The pie charts depict the percentage of G12R-stimulated memory CD4+ and CD8+ T cells in cytokine negative and cytokine positive cells at week 9 (Naïve: CCR7+ CD45RA+, Central memory: CCR7 + CD45RA-, Effector memory: CCR7- CD45RA-, Terminal effector memory: CCR7- CD45RA+).
Extended Data Fig. 5
Extended Data Fig. 5. ELI-002 immunization induces robust T cell responses to mKRAS antigens.
Patient 23 was immunized with 1.4 mg Amph-Peptides 2P admixed with 10 mg of Amph-CpG-7909. PBMCs were collected for ex vivo T cell response assessments at baseline (B) and Week 9. a, Schema showing dosing and experimental schedule. PBMCs were stimulated with OLPs to b, G12D or G12R, c, G12V, G12C, G12A, G12S or G13D or d, WT KRAS in the same IFNγ/GrB Fluorospot assay for 44 hours; dotted line indicates 50 SFC/1 x 106 PBMCs. Shown are background-subtracted IFNγ and/or GrB SFCs per 1 × 10⁶ PBMCs. The pie charts in b, c show the percentage of mKRAS OLP-stimulated PBMCs at week 9 secreting IFNγ, GrB or both IFNγ and GrB. e, f, PBMCs were stimulated with G12R or G12D OLPs prior to analysis for intracellular cytokines, IFNγ, TNFa and IL-2 by flow cytometry. Shown are frequencies of total IL2, TNFα, IFNγ polyfunctional cytokine producing e, CD4+ and f, CD8+ T cells. The pie charts in e, f show the percentage of G12R and G12D stimulated PBMCs producing IFNγ, IL2, TNFα, producing 2 cytokines (2+) or producing 3 cytokines (3+) at week 9. g, The pie charts depict the percentage of G12R-stimulated memory CD4+ and CD8+ T cells in cytokine negative and cytokine positive cells at week 9 (Naïve: CCR7 + CD45RA+, Central memory: CCR7 + CD45RA-, Effector memory: CCR7- CD45RA-, Terminal effector memory: CCR7- CD45RA+).
Extended Data Fig. 6
Extended Data Fig. 6. Baseline prognostic values and landmark RFS analysis.
a-e, RFS from study start (date of first vaccine dose) stratified by a, tumor stage at baseline, n = 25, b, absolute lymphocyte count in peripheral blood at baseline, n = 25, c, absolute neutrophil count in peripheral blood at baseline, n = 25, d, %CD4+ among CD3+ lymphocytes at baseline among ICS evaluable patients, n = 22, e, %CD8+ among CD3+ lymphocytes at baseline among ICS evaluable patients, n = 22. f, RFS from landmark (completion of prime immunization) stratified by T cell response (Maximum fold change from baseline; ≥ Median versus < Median) among evaluable patients with RFS exceeding the landmark as of the data cut-off, n = 22. n indicates individual patients. HR indicates hazard ratio with 95% CI. P values calculated using two-tailed log-rank test.
Extended Data Fig. 7
Extended Data Fig. 7. T cell response to infectious disease epitopes does not correlate to tumor biomarker response or delayed tumor recurrence.
a, Best overall biomarker response for study participants reported as percentage of the baseline value, stratified by infectious disease epitope-specific T cell response (≥Median versus < Median), n = 23. Values depicted are mean ± standard deviation. P value calculated by two-tailed Mann-Whitney test. b, RFS from study start (date of first vaccine dose) stratified by infectious disease epitope-specific T cell response (≥Median versus < Median), n = 23. n indicates individual patients. HR indicates hazard ratio with 95% CI. P value calculated using two-tailed log-rank test.

Comment in

References

    1. Siegel, R. L., Miller, K. D., Fuchs, H. E. & Jemal, A. Cancer statistics, 2021. CA Cancer J. Clin.71, 7–33 (2021). - PubMed
    1. Siegel, R. L., Miller, K. D. & Jemal, A. Cancer statistics, 2020. CA Cancer J. Clin.70, 7–30 (2020). - PubMed
    1. Park, W., Chawla, A. & O’Reilly, E. M. Pancreatic cancer. JAMA326, 851 (2021). - PMC - PubMed
    1. Modest, D. P., Pant, S. & Sartore-Bianchi, A. Treatment sequencing in metastatic colorectal cancer. Eur. J. Cancer109, 70–83 (2019). - PubMed
    1. Royal, R. E. et al. Phase 2 trial of single agent ipilimumab (anti-CTLA-4) for locally advanced or metastatic pancreatic adenocarcinoma. J. Immunother.33, 828–833 (2010). - PMC - PubMed

Publication types

MeSH terms

Associated data