Neurogenesis-independent mechanisms of MRI-detectable hippocampal volume increase following electroconvulsive stimulation
- PMID: 38195908
- PMCID: PMC11224397
- DOI: 10.1038/s41386-023-01791-1
Neurogenesis-independent mechanisms of MRI-detectable hippocampal volume increase following electroconvulsive stimulation
Abstract
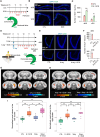
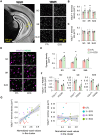
Electroconvulsive therapy (ECT) is one of the most effective psychiatric treatments but the underlying mechanisms are still unclear. In vivo human magnetic resonance imaging (MRI) studies have consistently reported ECT-induced transient hippocampal volume increases, and an animal model of ECT (electroconvulsive stimulation: ECS) was shown to increase neurogenesis. However, a causal relationship between neurogenesis and MRI-detectable hippocampal volume increases following ECT has not been verified. In this study, mice were randomly allocated into four groups, each undergoing a different number of ECS sessions (e.g., 0, 3, 6, 9). T2-weighted images were acquired using 11.7-tesla MRI. A whole brain voxel-based morphometry analysis was conducted to identify any ECS-induced brain volume changes. Additionally, a histological examination with super-resolution microscopy was conducted to investigate microstructural changes in the brain regions that showed volume changes following ECS. Furthermore, parallel experiments were performed on X-ray-irradiated mice to investigate the causal relationship between neurogenesis and ECS-related volume changes. As a result, we revealed for the first time that ECS induced MRI-detectable, dose-dependent hippocampal volume increase in mice. Furthermore, increased hippocampal volumes following ECS were seen even in mice lacking neurogenesis, suggesting that neurogenesis is not required for the increase. The comprehensive histological analyses identified an increase in excitatory synaptic density in the ventral CA1 as the major contributor to the observed hippocampal volume increase following ECS. Our findings demonstrate that modification of synaptic structures rather than neurogenesis may be the underlying biological mechanism of ECT/ECS-induced hippocampal volume increase.
© 2024. The Author(s).
Conflict of interest statement
The authors declare no competing interests.
Figures


Similar articles
-
Neurobiological mechanisms of electroconvulsive therapy for depression: Insights into hippocampal volumetric increases from clinical and preclinical studies.J Neurochem. 2024 Sep;168(9):1738-1750. doi: 10.1111/jnc.16054. Epub 2024 Jan 18. J Neurochem. 2024. PMID: 38238933 Review.
-
Electroconvulsive stimulation results in long-term survival of newly generated hippocampal neurons in rats.Hippocampus. 2017 Jan;27(1):52-60. doi: 10.1002/hipo.22670. Epub 2016 Oct 31. Hippocampus. 2017. PMID: 27756104
-
Rapid and lasting enhancement of dopaminergic modulation at the hippocampal mossy fiber synapse by electroconvulsive treatment.J Neurophysiol. 2017 Jan 1;117(1):284-289. doi: 10.1152/jn.00740.2016. Epub 2016 Oct 26. J Neurophysiol. 2017. PMID: 27784811 Free PMC article.
-
Effects of single and repeated electroconvulsive stimulation on hippocampal cell proliferation and spontaneous behaviors in the rat.Brain Res. 2013 Jan 23;1491:88-97. doi: 10.1016/j.brainres.2012.10.052. Epub 2012 Nov 2. Brain Res. 2013. PMID: 23123207
-
Electroconvulsive shock increases neurotrophy and neurogenesis: Time course and treatment session effects.Psychiatry Res. 2022 Mar;309:114390. doi: 10.1016/j.psychres.2022.114390. Epub 2022 Jan 11. Psychiatry Res. 2022. PMID: 35063747 Review.
Cited by
-
Combination method of macroscopic imaging with MRI and microscopic imaging with super resolution microscopy for brain microstructure analysis.Anat Sci Int. 2025 Jun 30. doi: 10.1007/s12565-025-00862-1. Online ahead of print. Anat Sci Int. 2025. PMID: 40587002
-
Duplication of the autism-related gene Chd8 leads to behavioral hyperactivity and neurodevelopmental defects in mice.Nat Commun. 2025 May 26;16(1):4641. doi: 10.1038/s41467-025-59853-5. Nat Commun. 2025. PMID: 40419468 Free PMC article.
-
Electroconvulsive therapy-specific volume changes in nuclei of the amygdala and their relationship to long-term anxiety improvement in depression.Mol Psychiatry. 2025 Jun;30(6):2653-2664. doi: 10.1038/s41380-024-02874-1. Epub 2024 Dec 16. Mol Psychiatry. 2025. PMID: 39681629 Free PMC article.
-
MRI textural plasticity in limbic gray matter associated with clinical response to electroconvulsive therapy for psychosis.Mol Psychiatry. 2025 Apr;30(4):1453-1460. doi: 10.1038/s41380-024-02755-7. Epub 2024 Sep 26. Mol Psychiatry. 2025. PMID: 39327507 Free PMC article.
References
-
- Kellner CH, Obbels J, Sienaert P. When to consider electroconvulsive therapy (ECT) Acta Psychiatr Scand. 2020;141:304–15. - PubMed
-
- Bahji A, Hawken ER, Sepehry AA, Cabrera CA, Vazquez GECT. beyond unipolar major depression: systematic review and meta-analysis of electroconvulsive therapy in bipolar depression. Acta Psychiatr Scand. 2019;139:214–26. - PubMed
-
- Petrides G, Malur C, Braga R, Bailine S, Schooler N, Malhotra A, et al. Electroconvulsive therapy augmentation in clozapine-resistant schizophrenia: a prospective, randomized study. Am J Psychiatry. 2015;172:52–58. - PubMed
-
- Castren E. Neuronal network plasticity and recovery from depression. JAMA Psychiatry. 2013;70:983–9. - PubMed
MeSH terms
Grants and funding
LinkOut - more resources
Full Text Sources
Medical
Research Materials
Miscellaneous

