Mapping Astrocytic and Neuronal μ-opioid Receptor Expression in Various Brain Regions Using MOR-mCherry Reporter Mouse
- PMID: 38196135
- PMCID: PMC10789176
- DOI: 10.5607/en23039
Mapping Astrocytic and Neuronal μ-opioid Receptor Expression in Various Brain Regions Using MOR-mCherry Reporter Mouse
Abstract
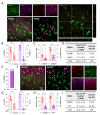
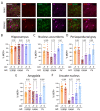
The μ-opioid receptor (MOR) is a class of opioid receptors characterized by a high affinity for β-endorphin and morphine. MOR is a G protein-coupled receptor (GPCR) that plays a role in reward and analgesic effects. While expression of MOR has been well established in neurons and microglia, astrocytic MOR expression has been less clear. Recently, we have reported that MOR is expressed in hippocampal astrocytes, and its activation has a critical role in the establishment of conditioned place preference. Despite this critical role, the expression and function of astrocytic MOR from other brain regions are still unknown. Here, we report that MOR is significantly expressed in astrocytes and GABAergic neurons from various brain regions including the hippocampus, nucleus accumbens, periaqueductal gray, amygdala, and arcuate nucleus. Using the MOR-mCherry reporter mice and Imaris analysis, we demonstrate that astrocytic MOR expression exceeded 60% in all tested regions. Also, we observed similar MOR expression of GABAergic neurons as shown in the previous distribution studies and it is noteworthy that MOR expression is particularly in parvalbumin (PV)-positive neurons. Furthermore, consistent with the normal MOR function observed in the MOR-mCherry mouse, our study also demonstrates intact MOR functionality in astrocytes through iGluSnFr-mediated glutamate imaging. Finally, we show the sex-difference in the expression pattern of MOR in PV-positive neurons, but not in the GABAergic neurons and astrocytes. Taken together, our findings highlight a substantial astrocytic MOR presence across various brain regions.
Keywords: Astrocytes; Mapping; Mu-opioid receptor; Sex-difference.
Figures


Similar articles
-
Expression of µ-Opioid Receptor in CA1 Hippocampal Astrocytes.Exp Neurobiol. 2018 Apr;27(2):120-128. doi: 10.5607/en.2018.27.2.120. Epub 2018 Apr 24. Exp Neurobiol. 2018. PMID: 29731678 Free PMC article.
-
Signaling mechanisms of μ-opioid receptor (MOR) in the hippocampus: disinhibition versus astrocytic glutamate regulation.Cell Mol Life Sci. 2021 Jan;78(2):415-426. doi: 10.1007/s00018-020-03595-8. Epub 2020 Jul 15. Cell Mol Life Sci. 2021. PMID: 32671427 Free PMC article. Review.
-
Microglia Express Mu Opioid Receptor: Insights From Transcriptomics and Fluorescent Reporter Mice.Front Psychiatry. 2019 Jan 4;9:726. doi: 10.3389/fpsyt.2018.00726. eCollection 2018. Front Psychiatry. 2019. PMID: 30662412 Free PMC article.
-
Activation of Astrocytic μ-opioid Receptor Elicits Fast Glutamate Release Through TREK-1-Containing K2P Channel in Hippocampal Astrocytes.Front Cell Neurosci. 2018 Sep 27;12:319. doi: 10.3389/fncel.2018.00319. eCollection 2018. Front Cell Neurosci. 2018. PMID: 30319359 Free PMC article.
-
[Direct involvement of the supraspinal phosphoinositide 3-kinase/phospholipase C gamma 1 pathway in the mu-opioid receptor agonist-induced supraspinal antinociception in the mouse].Nihon Shinkei Seishin Yakurigaku Zasshi. 2003 Jun;23(3):121-8. Nihon Shinkei Seishin Yakurigaku Zasshi. 2003. PMID: 12884752 Review. Japanese.
Cited by
-
Morphine self-administration is inhibited by the antioxidant N-acetylcysteine and the anti-inflammatory ibudilast; an effect enhanced by their co-administration.PLoS One. 2024 Oct 29;19(10):e0312828. doi: 10.1371/journal.pone.0312828. eCollection 2024. PLoS One. 2024. PMID: 39471200 Free PMC article.
-
Sex and Strain Differences in Analgesic and Hyperlocomotor Effects of Morphine and μ-Opioid Receptor Expression in Mice.J Neurosci Res. 2025 Apr;103(4):e70039. doi: 10.1002/jnr.70039. J Neurosci Res. 2025. PMID: 40247818 Free PMC article.
-
Targeting PI3K-mTOR signaling in the anterior cingulate cortex improves emotional behavior, and locomotor activity in rats with bone cancer pain.Ann Med Surg (Lond). 2025 Mar 19;87(4):1985-1994. doi: 10.1097/MS9.0000000000003206. eCollection 2025 Apr. Ann Med Surg (Lond). 2025. PMID: 40212145 Free PMC article.
-
Drp1 mitochondrial fission in astrocyte modulates behavior and neuroinflammation during morphine addiction.J Neuroinflammation. 2025 Apr 17;22(1):108. doi: 10.1186/s12974-025-03438-y. J Neuroinflammation. 2025. PMID: 40247294 Free PMC article.
-
Role of astrocytic mu-opioid receptors of the ventrolateral periaqueductal gray in modulating anxiety-like responses.Behav Brain Funct. 2025 Jul 23;21(1):24. doi: 10.1186/s12993-025-00291-0. Behav Brain Funct. 2025. PMID: 40702536 Free PMC article.
References
-
- Woo DH, Bae JY, Nam MH, An H, Ju YH, Won J, Choi JH, Hwang EM, Han KS, Bae YC, Lee CJ. Activation of astrocytic μ-opioid receptor elicits fast glutamate release through TREK-1-containing K2P channel in hippocampal astrocytes. Front Cell Neurosci. 2018;12:319. doi: 10.3389/fncel.2018.00319. - DOI - PMC - PubMed
LinkOut - more resources
Full Text Sources
Research Materials

