. 2024 Feb 6;123(3):374-388.
doi: 10.1016/j.bpj.2024.01.002. Epub 2024 Jan 9.

Single-molecule FRET probes allosteric effects on protein-translocating pore loops of a AAA+ machine

Affiliations

Single-molecule FRET probes allosteric effects on protein-translocating pore loops of a AAA+ machine

Marija Iljina et al. Biophys J. .

Abstract

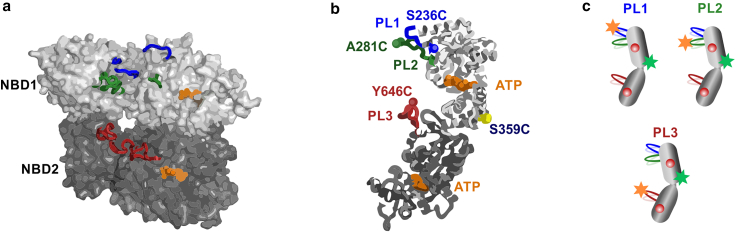
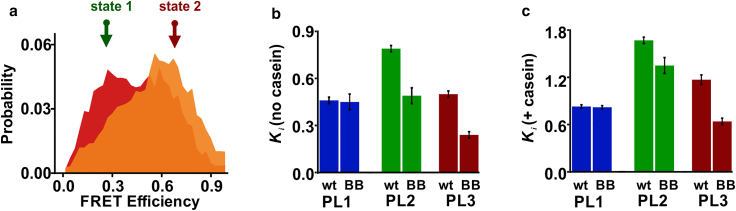
AAA+ proteins (ATPases associated with various cellular activities) comprise a family of powerful ring-shaped ATP-dependent translocases that carry out numerous vital substrate-remodeling functions. ClpB is a AAA+ protein disaggregation machine that forms a two-tiered hexameric ring, with flexible pore loops protruding into its center and binding to substrate proteins. It remains unknown whether these pore loops contribute only passively to substrate-protein threading or have a more active role. Recently, we have applied single-molecule FRET spectroscopy to directly measure the dynamics of substrate-binding pore loops in ClpB. We have reported that the three pore loops of ClpB (PL1-3) undergo large-scale fluctuations on the microsecond timescale that are likely to be mechanistically important for disaggregation. Here, using single-molecule FRET, we study the allosteric coupling between the pore loops and the two nucleotide-binding domains of ClpB (NBD1-2). By mutating the conserved Walker B motifs within the NBDs to abolish ATP hydrolysis, we demonstrate how the nucleotide state of each NBD tunes pore-loop dynamics. This effect is surprisingly long-ranged; in particular, PL2 and PL3 respond differentially to a Walker B mutation in either NBD1 or NBD2, as well as to mutations in both. We characterize the conformational dynamics of pore loops and the allosteric paths connecting NBDs to pore loops by molecular dynamics simulations and find that both principal motions and allosteric paths can be altered by changing the ATPase state of ClpB. Remarkably, PL3, which is highly conserved in AAA+ machines, is found to favor an upward conformation when only NBD1 undergoes ATP hydrolysis but a downward conformation when NBD2 is active. These results explicitly demonstrate a significant long-range allosteric effect of ATP hydrolysis sites on pore-loop dynamics. Pore loops are therefore established as active participants that undergo ATP-dependent conformational changes to translocate substrate proteins through the central pores of AAA+ machines.


Conflict of interest statement

Declaration of interests The authors declare no competing interests.

Figures

Figure 1
Figure 1
Location of pore loops in ClpB hexamer and fluorescence labeling scheme for single-molecule experiments. (a) Side view of ClpB hexamer from E. coli (PDB: 6OAX) (9), with three protomers removed to reveal the central pore. The topmost N-terminal domain is absent in this structure. Nucleotides at NBD1 and NBD2, bound at the subunit interfaces, are shown in orange. PL1, PL2, and PL3 of the three shown protomers (A, B, and F) are colored in blue, green and red, respectively. (b) Monomer structure of ClpB (PDB: 6OAX, protomer A (9)). Pore loop 1 (PL1) residues 235–245, corresponding to the sequence GSLLAGAKYRG, are shown in blue. Pore loop 2 (PL2) residues 272–290 (LHTVVGAGKAEGAVDAGNM) are in green. Pore loop 3 (PL3) residues 637–650 (IGAPPGYVGYEEGG) are in red. Numbering and the primary sequence are as in full-length T. thermophilus (TT) ClpB, used in all experiments in this work. Conserved residues of the primary sequence are in bold. (A short additional pore loop adjacent to PL3, identified in the PDB 6OAX (9) structure, was found to be too close to PL3 and was not studied here.) Residues S236C, A281C, and Y646C, used for fluorescence labeling of the pore loops, are shown as spheres on PL1, PL2, and PL3, whereas residue S359C, used as a reference position in FRET assays, is shown in yellow. Residue numbers are from TT ClpB. (c) Cartoon representation of the fluorescence double-labeling scheme to study PLs showing the positions of two Alexa Fluor dyes (as stars) within ClpB monomer. Red spheres represent ATP bound to the two NBDs of ClpB. PL1 construct S236C-S359C, PL2 construct A281C-S359C, and PL3 construct S359C-Y646C. In all experiments, we use N-terminally truncated TT ClpB. This and all the subsequent figures are available in color online. To see this figure in color, go online.
Figure 2
Figure 2
Effect of BB mutations on the dynamic equilibrium of PL1, PL2, and PL3. (a) FRET efficiency histograms of PL3 (red) and PL3 BB (orange), both in the presence of 25 μM κ-casein. Here and elsewhere below, single-molecule measurements were conducted using 1:100 labeled:unlabeled ClpB with 2 mM ATP. BB mutations are E271A/E668A (numbering as in the full-length TT ClpB). Arrows show the FRET efficiency values of two fixed states (same across different PL3 mutants) used in the H2MM analysis of PL3 (Table S1). The positions of these two states were obtained from a global analysis of pore-loop data with and without κ-casein done previously (28) (detailed in Supporting material, under section “supplemental smFRET data analysis details”). See Fig. S1 for smFRET histograms of PL1, PL2, and PL3 wt and BB constructs with and without κ-casein. (b) H2MM-derived equilibrium coefficients, Ki , for wt and BB mutants, measured without κ-casein. (c) H2MM-derived equilibrium coefficients, Ki, for the same constructs, measured with 25 μM κ-casein. All Ki values are listed in Table S6. Overall higher values than in (b) are due to a clear increase in the population of the low-FRET state in all pore loops in the presence of κ-casein. In both (b) and (c), a differential effect of the BB mutation was registered (average values are reported, errors are SD, n = 2–3 repeats of the experiment). To see this figure in color, go online.
Figure 3
Figure 3
Effect of BB mutation on pore-loop dynamics. Motions associated with the PC1 eigenvector are shown for (a) PL1; (b) PL2, and (c) PL3 in protomers 2–4 (blue, green, and red, respectively) of the wild-type ClpB (left panels) and of the BB variant (right panels). Top and side views are shown. Directions of motions are indicated using spikes. Motions of PL1 loops are less affected by mutations than those of the hexamer and PL2-3 loops. See also Video S1. Motions associated with the principal component PC1 of PL1 loops in wild-type ClpB (left) and in the BB variant (right), Video S2. Motions associated with the principal component PC1 of PL2 loops in wild-type ClpB (left) and in the BB variant (right), Video S3. Motions associated with the principal component PC1 of PL3 loops in wild-type ClpB (left) and in the BB variant (right). To see this figure in color, go online.
Figure 4
Figure 4
Computed allosteric paths connecting the Walker B and pore-loop regions in ClpB. Probability density distributions of the 200 shortest paths between Walker B residues targeted by mutations, E279 in NBD1 and E678 in NBD2, and the pore-loop residue labeled in FRET experiments, A244 in PL1, A289 in PL2, and Y656 in PL3 in one protomer of wt ClpB (E. coli) and BB mutant for (a) PL1 (b) PL2, and (c) PL3 wt and BB. The effect of perturbation on allosteric communication is weak in PL1 but strong in PL2 and PL3. Structural details of optimal and suboptimal paths are shown for PL3 (d) wt and (e) BB. Optimal paths (see Tables S3 and S4), which have the shortest length, illustrate the strongest set of allosteric couplings between nodes (green) of the allosteric network, which mediate the signaling between the Walker B site and the pore loop. The optimal path is slightly perturbed by BB mutations, whereas the ensemble of suboptimal paths (purple), which have longer path lengths, is strongly perturbed by mutations. Line thickness is proportional to the strength of the coupling. To see this figure in color, go online.
Figure 5
Figure 5
smFRET κ-casein titration experiments with wt and BB constructs. The average ratio of state 1 population with κ-casein to that without κ-casein is plotted (as circles) against casein concentration. Error is SD (n = 3) for PL1 and PL3 datasets, and SD (n = 2) for PL2 datasets. Solid lines are fits to a binding model (details in Table S5). To see this figure in color, go online.
Figure 6
Figure 6
Effect of single NBD mutations on PL1, PL2, and PL3. (ac) H2MM-derived equilibrium coefficients, Ki, for sets of single Walker A/B mutants of PL1 (a), PL2 (b), and PL3 (c), all measured with 25 μM κ-casein (average values, errors are SD, n = 2–3 repeats). See Table S6 for Ki values without κ-casein and Figs. S13 and S14 for complete sets of smFRET histograms with single-NBD mutants. (d–f) DMCs for PL1, PL2, and PL3 with κ-casein (25 μM). The values along the edges are the average changes in free energy upon mutation, ΔΔGi (in J.mol−1), calculated from the H2MM-derived Ki s detailed in section “materials and methods.” The values at the centers of the squares are the average coupling energies, defined as the differences between free-energy changes of opposing edges (see section “materials and methods”). Error values are from the propagation of the SEs in Ki. The cycles without κ-casein are in Fig. S15. To see this figure in color, go online.
Figure 7
Figure 7
smFRET results suggest an ATP-dependent modulation of the pore-loop dynamics. (ad) States of ClpB monomer are schematically shown, with bound κ-casein (in yellow) and pore loops PL2 and PL3 in green and dark red, respectively. PL1s are omitted for simplicity but included in Fig. S16. The ATPase states of the NBDs are depicted as follows: red circles, bound ATP molecules not undergoing hydrolysis (ATP arrested state); blue wheels, bound ATP undergoing hydrolysis, which corresponds to a mixture of ATP/ADP, although ATP is in excess in these measurements (2 mM). As a consequence of altered microsecond rates, PLs favor either an up or a down conformation depending on the ATPase state of the NBDs, and the size of the PLs on the scheme reflects their state occupancy from the H2MM analysis. Numbers are the average H2MM-derived equilibrium coefficients, Ki (errors are SD, n = 2–3). The conformational equilibrium of the pore loops periodically switches between the up/down states in response to the changing ATPase state of the machine, and this might facilitate substrate-protein translocation. To see this figure in color, go online.

References

    1. Jessop M., Felix J., Gutsche I. AAA+ ATPases: structural insertions under the magnifying glass. Curr. Opin. Struct. Biol. 2021;66:119–128. - PMC - PubMed
    1. Gates S.N., Martin A. Stairway to translocation: AAA+ motor structures reveal the mechanisms of ATP-dependent substrate translocation. Protein Sci. 2020;29:407–419. - PMC - PubMed
    1. Crampton D.J., Mukherjee S., Richardson C.C. DNA-induced switch from independent to sequential dTTP hydrolysis in the bacteriophage T7 DNA helicase. Mol. Cell. 2006;21:165–174. - PubMed
    1. Enemark E.J., Joshua-Tor L. Mechanism of DNA translocation in a replicative hexameric helicase. Nature. 2006;442:270–275. - PubMed
    1. Neuwald A.F., Aravind L., et al. Koonin E.V. AAA+: A class of chaperone-like ATPases associated with the assembly, operation, and disassembly of protein complexes. Genome Res. 1999;9:27–43. - PubMed

Publication types

MeSH terms

LinkOut - more resources