. 2024 Apr;23(4):e14083.
doi: 10.1111/acel.14083. Epub 2024 Jan 9.

Rapid and synchronous chemical induction of replicative-like senescence via a small molecule inhibitor

Affiliations

Rapid and synchronous chemical induction of replicative-like senescence via a small molecule inhibitor

Spiros Palikyras et al. Aging Cell. 2024 Apr.

Abstract

Cellular senescence is acknowledged as a key contributor to organismal ageing and late-life disease. Though popular, the study of senescence in vitro can be complicated by the prolonged and asynchronous timing of cells committing to it and by its paracrine effects. To address these issues, we repurposed a small molecule inhibitor, inflachromene (ICM), to induce senescence to human primary cells. Within 6 days of treatment with ICM, senescence hallmarks, including the nuclear eviction of HMGB1 and -B2, are uniformly induced across IMR90 cell populations. By generating and comparing various high throughput datasets from ICM-induced and replicative senescence, we uncovered a high similarity of the two states. Notably though, ICM suppresses the pro-inflammatory secretome associated with senescence, thus alleviating most paracrine effects. In summary, ICM rapidly and synchronously induces a senescent-like phenotype thereby allowing the study of its core regulatory program without confounding heterogeneity.

Keywords: 3D genome organization; SASP; cellular ageing; chromatin; senescence; single cell genomics.


Conflict of interest statement

WW is cofounder of Cygenia GmbH (www.cygenia.com) providing epigenetic senescence analysis services. Apart from this, the authors declare that they have no conflict of interest.

Figures

FIGURE 1
FIGURE 1
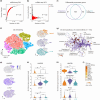
ICM treatment induces a senescent‐like phenotype. (a) Mean proliferation rates (±SEM from three independent replicates) of DMSO‐ and ICM‐treated IMR90 for 3–6 days using automated live‐cell imaging. *p < 0.01, unpaired two‐tailed Student's t test at 240 h. (b) Representative widefield images of proliferating (top) and 610CP‐C6‐ICM‐treated IMR90 (bottom) with DNA counterstained with Hoechst. The overlap between the two signals was assessed via a linescan. Bar, 5 μm. (c) Proliferating, ICM‐treated and senescent IMR90 assayed for β‐galactosidase activity. ICM‐treated and senescent cells appeared darker, indicative of their senescent state. (d) FACS cell cycle profiles of PI‐stained proliferating (DMSO), senescent or ICM‐treated IMR90 for 3 and 6 days. (e) Representative images of IMR90 showing treated or not with ICM for 6 days and immunostained for HMGB2 and p21. Bars, 6 μm. Violin plots (right) quantify changes in the levels of the two markers. N, number of cells analyzed per each condition. *p < 0.05, two‐tailed Wilcoxon‐Mann–Whitney test. (f) As in panel e, but immunostained for HMGB1 and CTCF. (g) As in panel e, but immunostained for HP1α and H3K27me3. (h) Western blot analysis of CTCF, HMGB2, EZH2 and histone H3 in proliferating (DMSO) and 6‐day ICM‐treated IMR90; α‐tubulin levels provide a loading control. (i) Mean mRNA levels (±SD from two independent isolates) of selected senescence marker genes in proliferating (DMSO) and 6‐day ICM‐treated IMR90. *p < 0.05, unpaired two‐tailed Student's t test. (j) Mean ChIP‐qPCR enrichment levels (±SD from two independent isolates) at selected genomic positions (a–f) in proliferating (DMSO) and 3‐ or 6‐day ICM‐treated IMR90. *p < 0.05, unpaired two‐tailed Student's t test.
FIGURE 2
FIGURE 2
An automated classifier approach for assessing senescent cell nuclear morphology. (a) Overview of the automated imaging and analysis workflow. Coarse‐resolution confocal stacks were acquired in a tiled fashion and, once a nucleus of sufficient quality was detected, a mid‐plane STED image of it was also acquired. GLCM features were extracted from single nuclei from confocal (after tile stitching and maximum projection of z‐stacks) or STED images and used for downstream embedding and classification. (b) t‐SNE embedding of features extracted from confocal images with randomly selected example images from proliferating (orange), senescent (purple), and ICM‐treated cells (turquoise) shown. Bar, 5 μm. (c) As in panel b, but highlighting proliferating, senescent and 3‐ or 6‐day ICM‐treated cells of different replicates. (d) Confusion matrix showing the fraction of ICM‐treated cells classified as similar to proliferating or senescent cells using an SVM classifier trained on confocal‐ (top) or STED‐imaged nuclear features (bottom). (e) Box plots showing the distribution of nuclear size (left), GLCM energy values (in a 4‐pixel distance along the x‐axis; middle), and GLCM dissimilarity (in a 2‐pixel distance along the y‐axis; right) in confocal images of proliferating, senescent, 3‐ or 6‐/9‐day ICM‐treated cells.
FIGURE 3
FIGURE 3
Transcriptional changes in ICM‐treated human lung fibroblasts. (a) Quantification of nascent EU‐RNA levels (by immunofluorescence) in IMR90 passaged into senescence (left) or treated with ICM (right). *Significantly different to starting nuclear/nucleolar levels; p < 0.05, unpaired two‐tailed Student's t test. (b) Volcano plot showing all differentially expressed mRNAs between proliferating and ICM‐treated IMR90. Significantly up‐ (orange; >0.6 log2FC) or down‐regulated ones (green; <−0.6 log2FC) are indicated. (c) RNA‐Seq profiles in the CDK1 and CDKN1A locus from proliferating, 3‐ and 6‐day ICM‐treated IMR90s. (d) Heatmap showing transcription factors predicted to regulate genes from panel C based on motif enrichment. (e) Heatmap showing changes in mRNA levels upon senescence and ICM treatment of genes encoding selected chromatin‐associated factors. For each gene shown, statistically significant expression changes (log2FC) were recorded in at least one condition. (f) Volcano plot showing nascent RNA differences (fold enrichment) between 3 and 6 days of ICM treatment. Significantly up‐/downregulated genes are shown (>|0.6| log2‐fold change). N is the number of the genes in each group. (g) Venn diagrams of up‐/down‐regulated genes from ICM mRNA‐Seq and 3‐ or 6‐day ICM nascent RNA‐Seq. (h) GO term/pathway analysis of all commonly downregulated genes from panel g. (i) Comparison of differentially expressed genes between replicative senescence and 3 or 6 days of ICM treatment (left and middle panel, R 2 = 0.28 and 0.36, respectively) and oncogene induced senescence and ICM (right panel, R 2 = −0.1). N is the number of genes in each comparison. (j) Plot showing changes (log2FC ± SD) in mean RNAPII elongation rates calculated using nascent RNA‐Seq data.
FIGURE 4
FIGURE 4
Single‐cell analysis of ICM‐induced transcriptomes. (a) Scatter plot of the number of unique molecular identifiers (UMIs) versus the number of detected genes in each cell analyzed. Cells that passed (red) or not (black) this quality filter and the calculated Spearman's correlation coefficient (R 2) are indicated. (b) As in panel a, but for the number of UMIs versus the percent of mitochondrial genes detected in each cell. (c) Left: t‐SNE embedding of gene expression profiles from 25,744 cells clustered in an unsupervised manner. Right: Projection of proliferating (DMSO), senescent (RS), and 6‐day ICM‐treated cells (+ICM) onto the t‐SNE map. (d) Projection of selected marker gene expression levels onto the t‐SNE map of panel c. (e) Violin plots showing expression level distribution of the marker genes from panel d in proliferating (prolif), senescent (RS), and 6‐day ICM‐treated cells (+ICM). *p < 0.01, Wilcoxon‐Mann–Whitney test. (f) Venn diagram showing the overlap of differentially expressed genes from senescent and ICM‐treated cells. (g) GO term/pathway analysis of the 105 shared differentially expressed genes from panel f. (h) As in panel e, but for exemplary SASP‐related genes. *p < 0.01, Wilcoxon–Mann–Whitney test. (i) Heatmap showing transcription factors predicted to regulate genes from panel f based on motif enrichment.
FIGURE 5
FIGURE 5
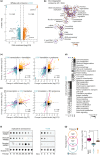
Proteomic changes induced by ICM treatment of IMR90. (a) Volcano plot showing whole proteome up‐ (orange, >0.6 log2LFQ) and downregulated proteins (turquoise, <−0.6 log2LFQ) upon 6 days of ICM treatment. The number of proteins (N) in each set is indicated. (b) GO term/pathways analysis of all downregulated proteins from panel a. (c) Left: Scatter plots showing correlation between mRNA‐Seq (transcription) and Ribo‐Seq levels (translation) of transcripts differentially expressed upon 6‐day ICM treatment. Right: Correlation between mRNA‐Seq and whole proteome levels for the same set of genes. The number of genes/proteins (N) in each set and Pearson's correlation coefficient (ρ) are indicated. (d) Heatmap showing GO terms/pathways associated with transcripts in the different quadrants of panel c (color‐coded the same way). The number of transcripts in each subgroup (N) is indicated. (e) As in panel c, but using differentially expressed genes from replicative senescence. (f) Dot blot showing intracellular HMGB1 and HMGB2 and secreted HMGB1 levels across passages (left panel) and days of ICM treatment. Histone H4 levels provide a control. (g) Left: Venn diagram showing up‐ and downregulated proteins from whole‐cell proteomics crossed with all known fibroblast SASP factors. Right: Box plot showing changes in SASP‐related protein levels (log2LFQ). *p < 0.01, unpaired two‐tailed Student's t test.
FIGURE 6
FIGURE 6
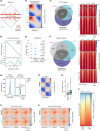
3D genome reorganization at 6 days post‐ICM treatment. (a) Heatmap showing Micro‐C contacts at 10‐kbp in an exemplary 4‐Mbp segments from chr1. Differences in loop formation between proliferating (DMSO) and ICM‐treated IMR90 (+ICM) are denoted (circles). (b) Plots showing decay of contact frequency as a function of genomic distance (top) and its first derivative (bottom) for proliferating and ICM‐treated cells. (c) Saddle plots showing contact distribution among and between inactive (top left corner) and active compartments (bottom right corner) in proliferating (DMSO) and ICM‐treated Micro‐C data (+ICM). (d) Representative genome browser views of CTCF and SMC1A CUT&Tag signal along a 100‐kbp region of chr17 from proliferating (grey), ICM‐treated (green) or senescent IMR90 (purple). (e) Left: Venn diagram showing the overlap of CTCF peaks (top 1%) in CUT&Tag data from proliferating, ICM‐treated, and senescent IMR90. Right: Heatmaps showing scaled CUT&Tag signal in the 4 kbp around the peaks. (f) As in panel e, but for SMC1A CUT&Tag data. (g) Line plots showing mean CTCF or SMC1A CUT&Tag signal coverage in the 4 kbp around all shared peaks from proliferating (grey), ICM‐treated (green) or senescent IMR90 (purple). (h) Insulation plot averaging Micro‐C contacts in the 600 kbp around CTCF peaks from proliferating (DMSO) and ICM‐treated IMR90 (+ICM). (i) Aggregate plots showing average Micro‐C signal in the 100 kbp around CTCF loop summits called at 5‐kbp resolution from unique to or shared by proliferating and ICM‐treated IMR90. (j) As in panel i, but for nonCTCF‐anchored loops. (k) Box plots showing the distribution of CTCF loop lengths in proliferating (DMSO) and ICM‐treated IMR90 (+ICM). *p < 0.01, Wilcoxon–Mann–Whitney test. (l) Heatmaps showing nucleosome distribution signal derived from Micro‐C data in the 2 kbp around CTCF motifs under CUT&Tag peaks from proliferating (DMSO) or ICM‐treated IMR90 (+ICM).

Similar articles

Cited by

References

    1. Acosta, J. C. , Banito, A. , Wuestefeld, T. , Georgilis, A. , Janich, P. , Morton, J. P. , Athineos, D. , Kang, T. W. , Lasitschka, F. , Andrulis, M. , Pascual, G. , Morris, K. J. , Khan, S. , Jin, H. , Dharmalingam, G. , Snijders, A. P. , Carroll, T. , Capper, D. , Pritchard, C. , … Gil, J. (2013). A complex secretory program orchestrated by the inflammasome controls paracrine senescence. Nature Cell Biology, 15(8), 978–990. - PMC - PubMed
    1. Baker, D. J. , Childs, B. G. , Durik, M. , Wijers, M. E. , Sieben, C. J. , Zhong, J. , Saltness, R. A. , Jeganathan, K. B. , Verzosa, G. C. , Pezeshki, A. , Khazaie, K. , Miller, J. D. , & Van Deursen, J. M. (2016). Naturally occurring p16Ink4a‐positive cells shorten healthy lifespan. Nature, 530, 184–189. - PMC - PubMed
    1. Baker, D. J. , Wijshake, T. , Tchkonia, T. , Lebrasseur, N. K. , Childs, B. G. , Van De Sluis, B. , Kirkland, J. L. , & Van Deursen, J. M. (2011). Clearance of p16Ink4a‐positive senescent cells delays ageing‐associated disorders. Nature, 479(7372), 232–236. - PMC - PubMed
    1. Boumendil, C. , Hari, P. , Olsen, K. C. F. , Acosta, J. C. , & Bickmore, W. A. (2019). Nuclear pore density controls heterochromatin reorganization during senescence. Genes & Development, 33, 144–149. 10.1101/gad.321117.118 - DOI - PMC - PubMed
    1. Browder, K. C. , Reddy, P. , Yamamoto, M. , Haghani, A. , Guillen, I. G. , Sahu, S. , Wang, C. , Luque, Y. , Prieto, J. , Shi, L. , Shojima, K. , Hishida, T. , Lai, Z. , Li, Q. , Choudhury, F. K. , Wong, W. R. , Liang, Y. , Sangaraju, D. , Sandoval, W. , … Izpisua Belmonte, J. C. (2022). In vivo partial reprogramming alters age‐associated molecular changes during physiological aging in mice. Nature Aging, 2, 243–253. - PubMed

Publication types