. 2024 Jan;21(210):20230425.
doi: 10.1098/rsif.2023.0425. Epub 2024 Jan 10.

High connectivity and human movement limits the impact of travel time on infectious disease transmission

Affiliations

High connectivity and human movement limits the impact of travel time on infectious disease transmission

Reju Sam John et al. J R Soc Interface. 2024 Jan.

Abstract

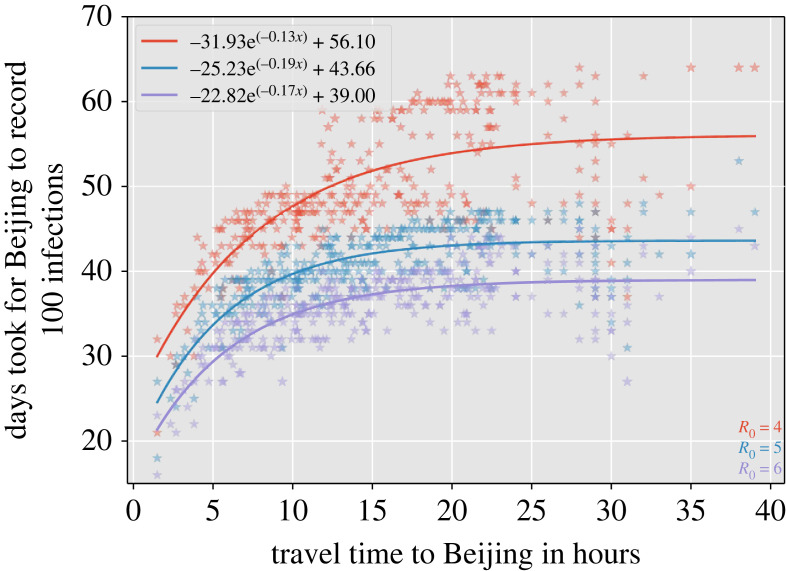
The speed of spread of severe acute respiratory syndrome coronavirus 2 (SARS-CoV-2) during the coronavirus disease 2019 (COVID-19) pandemic highlights the importance of understanding how infections are transmitted in a highly connected world. Prior to vaccination, changes in human mobility patterns were used as non-pharmaceutical interventions to eliminate or suppress viral transmission. The rapid spread of respiratory viruses, various intervention approaches, and the global dissemination of SARS-CoV-2 underscore the necessity for epidemiological models that incorporate mobility to comprehend the spread of the virus. Here, we introduce a metapopulation susceptible-exposed-infectious-recovered model parametrized with human movement data from 340 cities in China. Our model replicates the early-case trajectory in the COVID-19 pandemic. We then use machine learning algorithms to determine which network properties best predict spread between cities and find travel time to be most important, followed by the human movement-weighted personalized PageRank. However, we show that travel time is most influential locally, after which the high connectivity between cities reduces the impact of travel time between individual cities on transmission speed. Additionally, we demonstrate that only significantly reduced movement substantially impacts infection spread times throughout the network.

Keywords: connectivity; epidemiological models; human mobility; infectious disease outbreaks; respiratory diseases.


Conflict of interest statement

We declare we have no competing interests.

Figures

Figure 1.
Figure 1.
The schematic of the SEIR metapopulation model. In the compartment diagram, inhabitants of a particular city or location are represented by a particular colour. The square boxes represent the set of individuals who are in the Susceptible, Exposed, Infectious and Recovered class. The downward arrows represent the flow from one compartment to another within a city or population and are annotated with the corresponding flow rates. The arrow pointing to the right between the square boxes represents the flow between the corresponding compartments of another city or population and is annotated with the emigration rate. The dashed circles represent immigrants in a particular city, for example, i, who emigrated from another city, for example, j. The dashed arrow represents the return of immigrants to the home city and is annotated with the return rate. The outward and inward arrows from and to the square boxes represent death and birth, annotated with the respective death and birth numbers, assuming the same birth and death rates.
Figure 2.
Figure 2.
Shortest possible route between Wuhan and Beijing centroids (red) calculated from the China road network (white).
Figure 3.
Figure 3.
Beijing’s simulated epidemic size. Beijing’s initial epidemic size based on our metapopulation SEIR, taking 60 days to reach 100 local cases. (a) Beijing’s initial simulated epidemic trajectory, (b) Beijing’s simulated epidemic size.
Figure 4.
Figure 4.
Time for Beijing to record 100 infections following infection introduction in each location in the simulated metapopulation SEIR model. Simulations start with 100 initial infections at each location. Locations within a travel time of less than 5 h from Beijing deviate from the fit, which may be attributed to the fact that people move more frequently at shorter distances, whereas our assumption is of a constant return rate (π) is 1/5days. (a) Time for Beijing to record 100 infections. Locations with travel time less than 5 h are highlighted in red and shown in b; (b) Beijing can be reached from locations highlighted in red with a travel time of less than 5 h.
Figure 5.
Figure 5.
This figure depicts the same data as shown in figure 4a, but with varying values of R0.
Figure 6.
Figure 6.
Factors and network metrics that putatively affect the speed of an infection’s spread to Beijing. The principal component analysis shows the relationship between the metrics among the network nodes. From the results of the PCA, we identified unique features, including travel time, degree centrality, betweenness centrality, population size, PageRank, weighted personalized PageRank (Wuhan outflow) and weighted personalized PageRank (Beijing flow). These unique features were used in machine learning methods to determine their variable importance. See text for details. The numbers in the bracket represent the loading magnitude for each feature.
Figure 7.
Figure 7.
The most important factors affecting the speed of an infection’s spread to Beijing calculated using two different machine learning algorithms, gradient boosting regression trees (green) and random forest (blue).
Figure 8.
Figure 8.
Return rate variation and its effect in infection spread. (a) Variation in return rate and response from simulations for the number of days to reach 100 infections and its asymptote values according to different derivative marks. (b) Kernel density estimation for the fitted values. (a) Days taken for different cites in China to record 100 infections as a function of the return rate, assuming Wuhan has an initial 100 infections. In the upper panel, we have plotted the fitted exponential curve, while the bottom panel displays its derivatives. We calculated the derivatives to determine the point at which the infection dynamics are no longer affected by the return rate. i.e. dy/dt → 0 (Here, dy/dt represents the rate of change of the time it took to record 100 infections with respect to the inverse of the return rate.) (b) The histograms display the distribution of the set of points with a derivative greater than 1.0,0.5and0.1. We conducted kernel density estimation on the same set of points, and it is overlaid on the histograms.

References

    1. Zhu N, et al. 2020. A novel coronavirus from patients with pneumonia in China, 2019. New England J. Med. 382, 727--733. (10.1056/NEJMoa2001017) - DOI - PMC - PubMed
    1. van Dorp L, et al. 2020. Emergence of genomic diversity and recurrent mutations in SARS-CoV-2. Infect. Genet. Evol. 83, 104351. (10.1016/j.meegid.2020.104351) - DOI - PMC - PubMed
    1. Wu JT, Leung K, Leung GM. 2020. Nowcasting and forecasting the potential domestic and international spread of the 2019-nCoV outbreak originating in Wuhan, China: a modelling study. Lancet 395, 689-697. (10.1016/S0140-6736(20)30260-9) - DOI - PMC - PubMed
    1. Tatem AJ, Rogers DJ, Hay SI. 2006. Global transport networks and infectious disease spread. Adv. Parasitol. 62, 293-343. (10.1016/S0065-308X(05)62009-X) - DOI - PMC - PubMed
    1. Gibbs H, Liu Y, Pearson CA, Jarvis CI, Grundy C, Quilty BJ, Diamond C, Eggo RM. 2020. Changing travel patterns in China during the early stages of the COVID-19 pandemic. Nat. Commun. 11, 1-9. (10.1038/s41467-020-18783-0) - DOI - PMC - PubMed

Publication types